Upgrade to Pro — share decks privately, control downloads, hide ads and more …

Full Stack Visibility with Elastic

Full Stack Visibility with Elastic

"With microservices every outage is like a murder mystery" is a common complaint. But it doesn't have to be! This talk gives an overview on how to monitor distributed applications. We dive into:

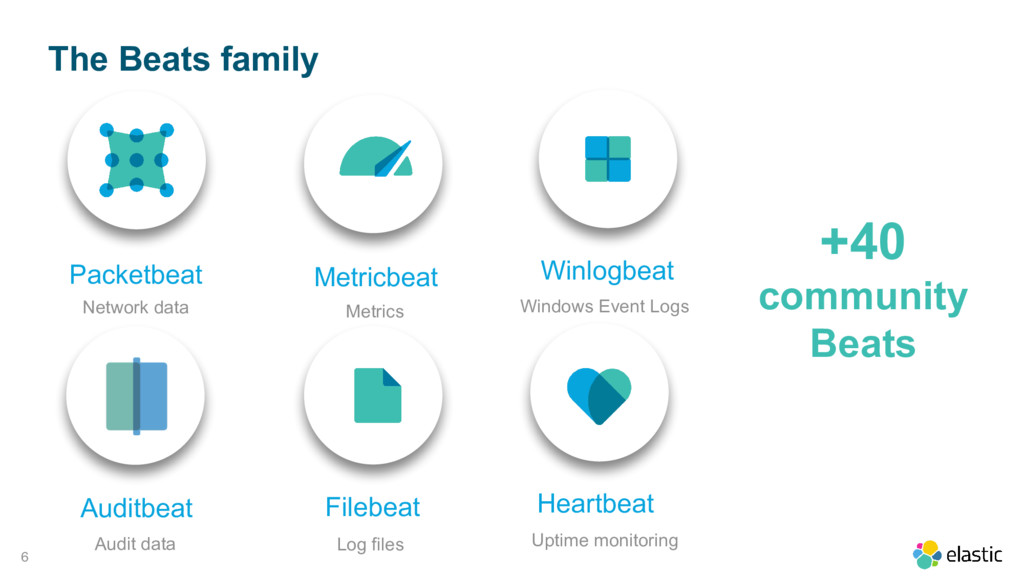
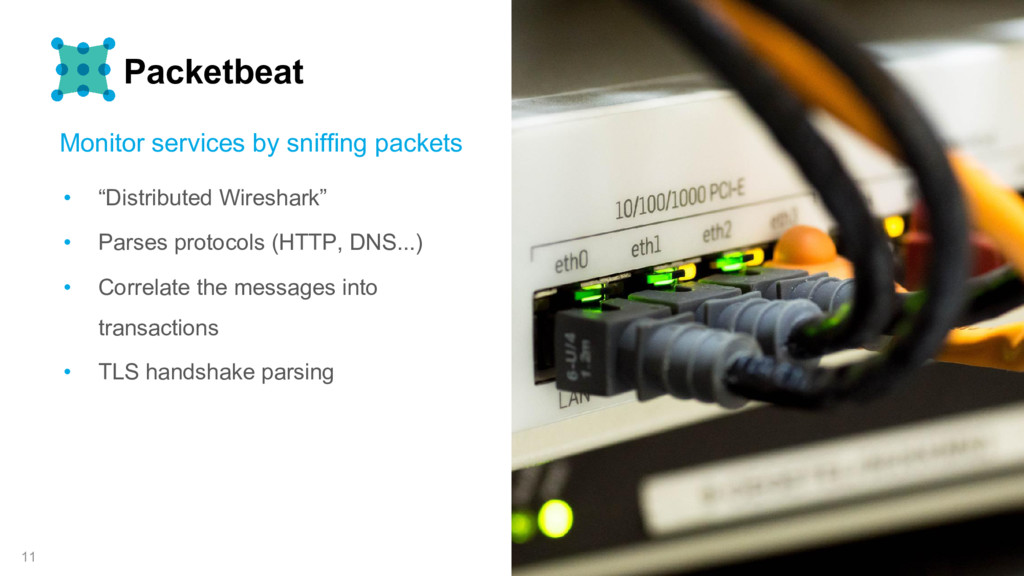
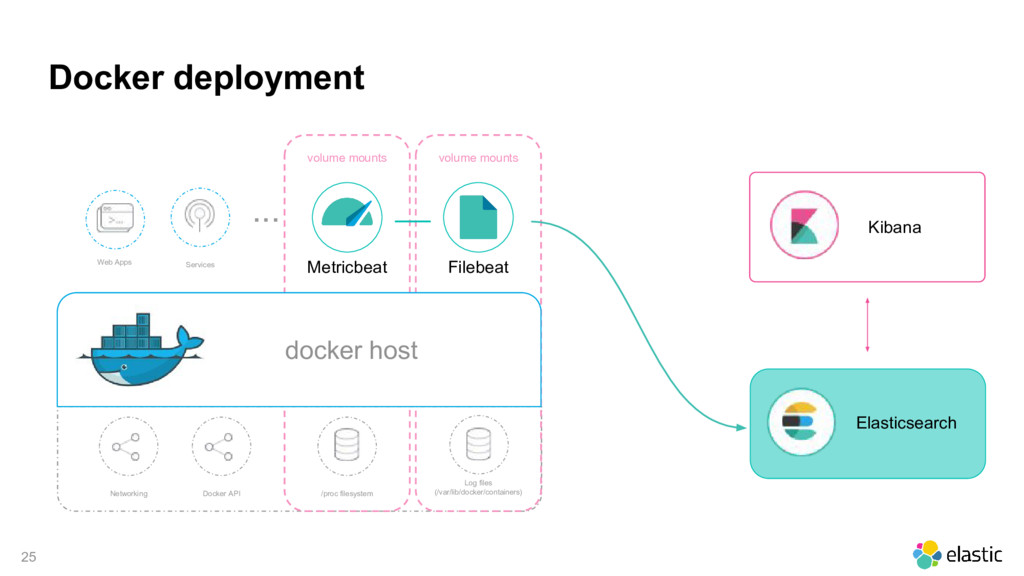
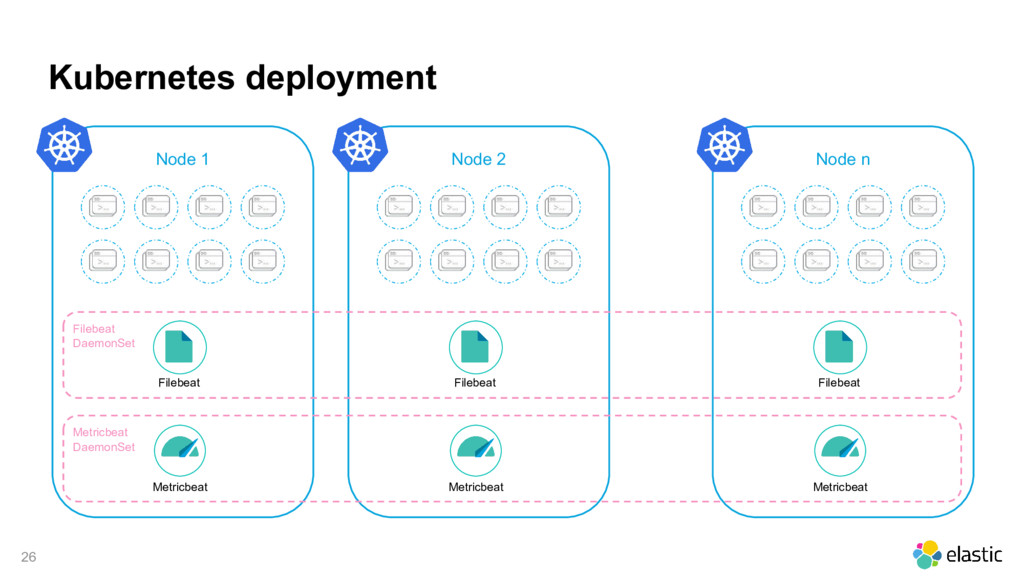
System metrics: Keep track of network traffic and system load.
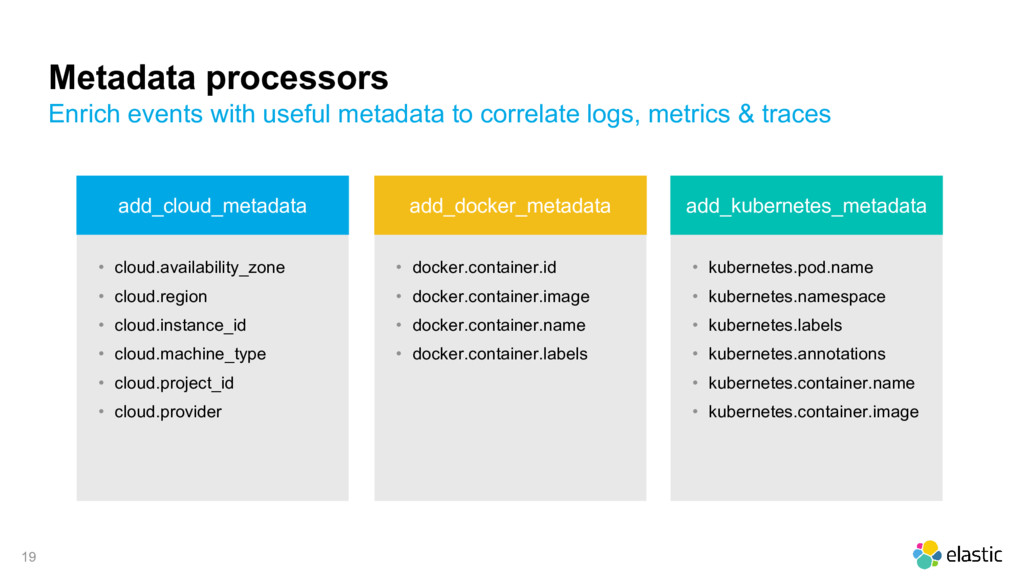
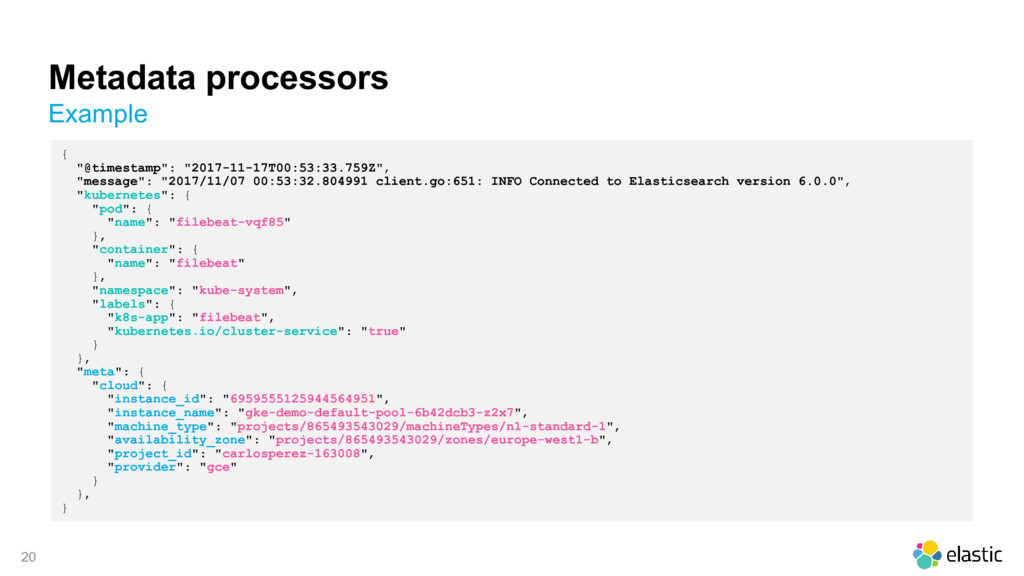
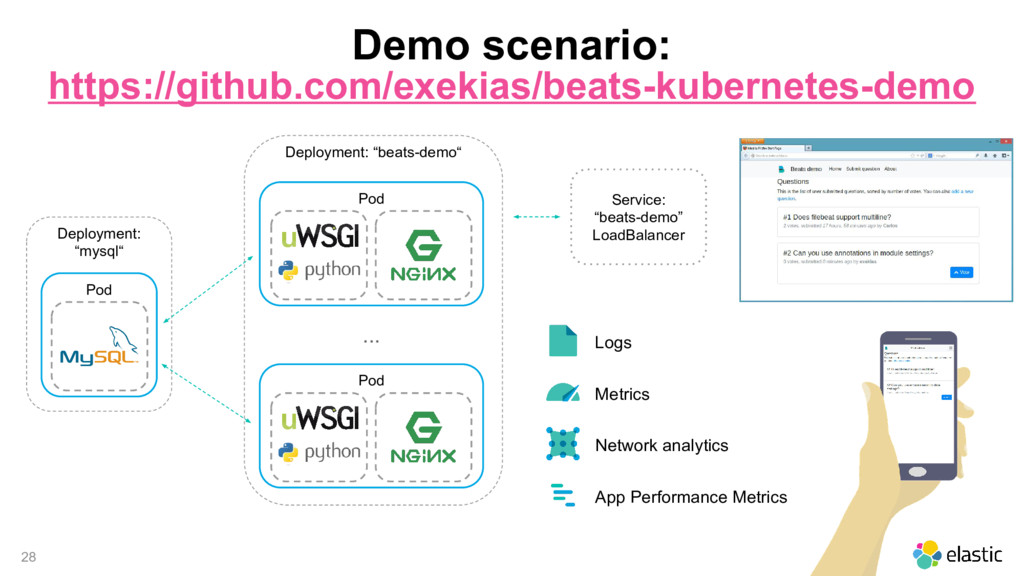
Application logs: Collect structured logs in a central location.
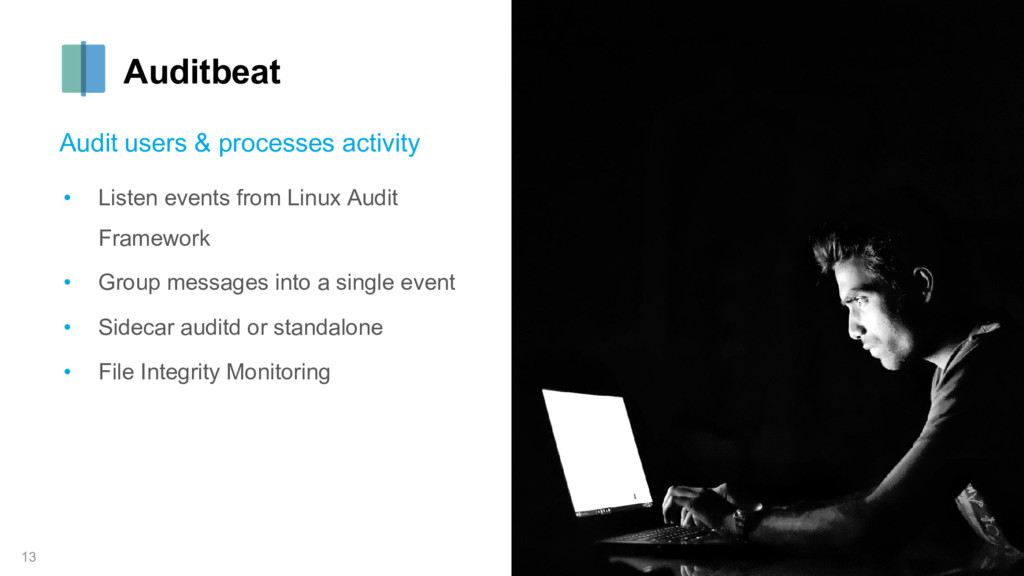
Audit info: Watch for user and processes activity in the system.
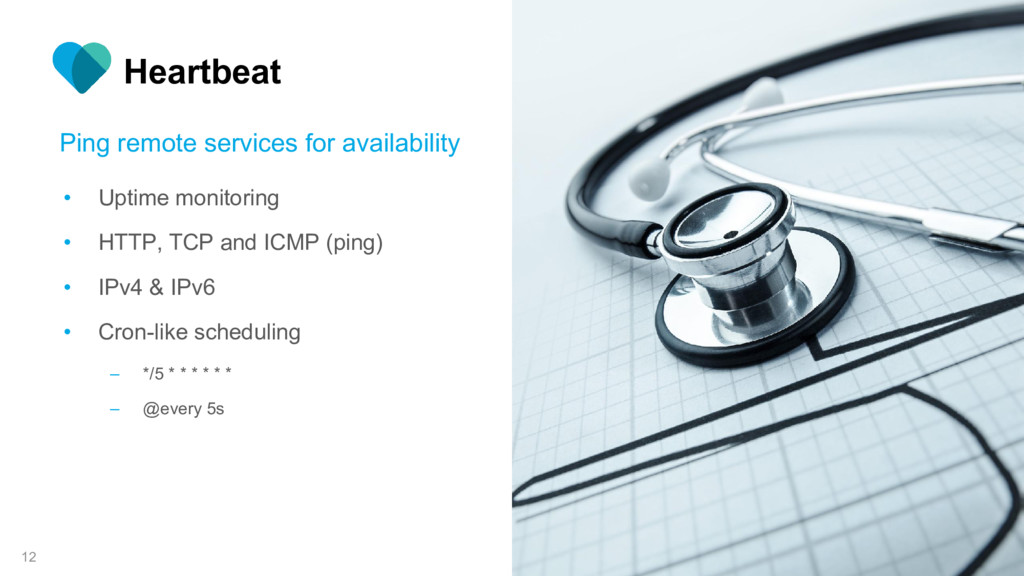
Uptime monitoring: Ping services and actively monitor their availability and response time.
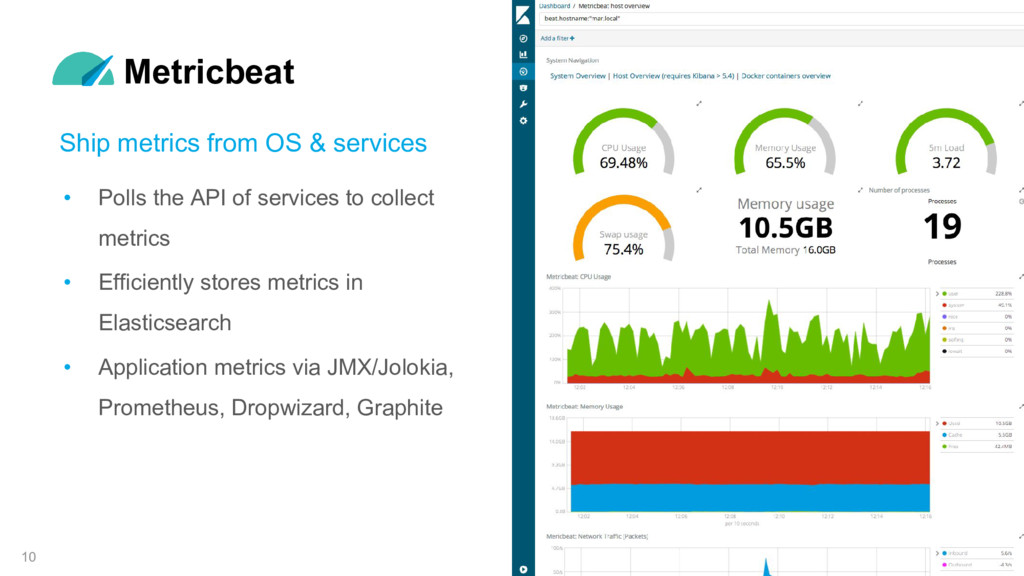
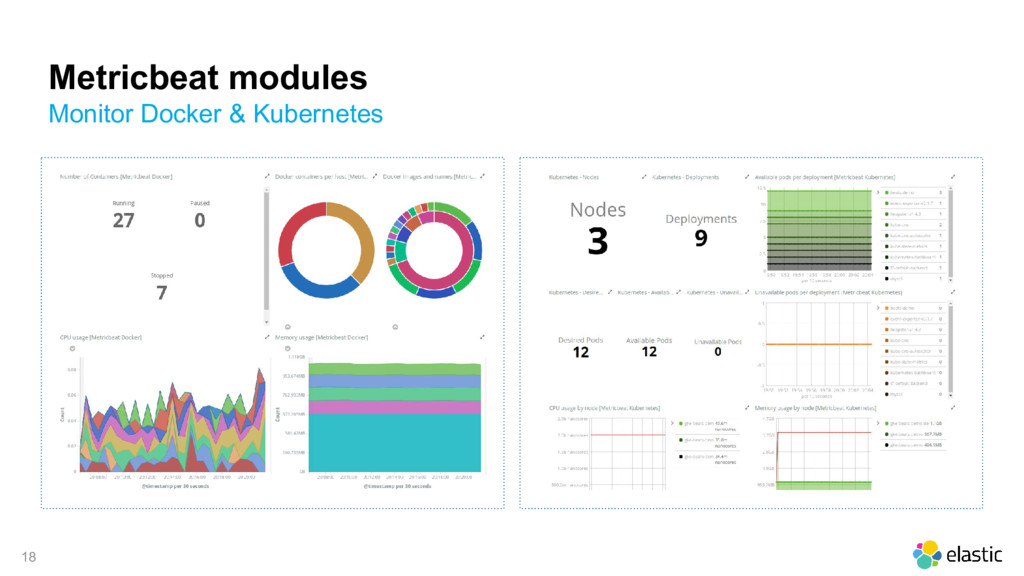
Application metrics: Get metrics and health information from for application via REST or JMX.
Request tracing: Gather timing data by using Elastic APM to retrieve and show call traces.

Avatar for Carlos Pérez-Aradros Herce

Carlos Pérez-Aradros Herce

December 06, 2017
Tweet

More Decks by Carlos Pérez-Aradros Herce

Other Decks in Technology

Transcript

  1. Full Stack Visibility with Elastic Logs, Metrics and Traces Carlos

    Pérez-Aradros, Software Engineer, Elastic
  2. 4

  3. 5 Beats is a family of lightweight shippers that collect

    and ship all kinds of operational data to Elasticsearch
  4. 6 The Beats family Heartbeat Uptime monitoring Filebeat Log files

    Winlogbeat Windows Event Logs Packetbeat Network data +40 community Beats Metricbeat Metrics Auditbeat Audit data
  5. 8 Filebeat Tails and ships logs • Correctly handles log

    rotation • Back-pressure sensitive • “at least once” guarantee • Structured logging • Multiline • Conditional filtering
  6. 10 Metricbeat Ship metrics from OS & services • Polls

    the API of services to collect metrics • Efficiently stores metrics in Elasticsearch • Application metrics via JMX/Jolokia, Prometheus, Dropwizard, Graphite
  7. 11 Packetbeat Monitor services by sniffing packets • “Distributed Wireshark”

    • Parses protocols (HTTP, DNS...) • Correlate the messages into transactions • TLS handshake parsing
  8. 12 Heartbeat Ping remote services for availability • Uptime monitoring

    • HTTP, TCP and ICMP (ping) • IPv4 & IPv6 • Cron-like scheduling – */5 * * * * * * – @every 5s
  9. 13 Auditbeat Audit users & processes activity • Listen events

    from Linux Audit Framework • Group messages into a single event • Sidecar auditd or standalone • File Integrity Monitoring
  10. 15 Elastic APM Previously Opbeat, 6.0.0 in alpha • apm-server

    based on libbeat – collects traces from agents – benefits from metadata processors • Node.js & Python agents, more coming…
  11. 16

  12. 17 17 We need specific tools to track things down

    With containers architecture everything is a moving target
  13. 19 Metadata processors Enrich events with useful metadata to correlate

    logs, metrics & traces • cloud.availability_zone • cloud.region • cloud.instance_id • cloud.machine_type • cloud.project_id • cloud.provider • docker.container.id • docker.container.image • docker.container.name • docker.container.labels • kubernetes.pod.name • kubernetes.namespace • kubernetes.labels • kubernetes.annotations • kubernetes.container.name • kubernetes.container.image add_cloud_metadata add_docker_metadata add_kubernetes_metadata
  14. 20 Metadata processors Example { "@timestamp": "2017-11-17T00:53:33.759Z", "message": "2017/11/07 00:53:32.804991

    client.go:651: INFO Connected to Elasticsearch version 6.0.0", "kubernetes": { "pod": { "name": "filebeat-vqf85" }, "container": { "name": "filebeat" }, "namespace": "kube-system", "labels": { "k8s-app": "filebeat", "kubernetes.io/cluster-service": "true" } }, "meta": { "cloud": { "instance_id": "6959555125944564951", "instance_name": "gke-demo-default-pool-6b42dcb3-z2x7", "machine_type": "projects/865493543029/machineTypes/n1-standard-1", "availability_zone": "projects/865493543029/zones/europe-west1-b", "project_id": "carlosperez-163008", "provider": "gce" } }, }
  15. 21 Metadata processors add_kubernetes_metadata internals API Server add_kubernetes_metadata pod watcher

    Pod start/stop events Docker Logs Cont. ID Metadata update 418a913c7076 ……………… c626cfdf38614 ……………… e5563a7cb80e ……………… 73de79be045c ……………... Elasticsearch Parse Enrich
  16. 22 Autodiscover (new in 6.1) metricbeat.autodiscover: providers: - type: docker

    templates: - condition: contains.docker.container.image: etcd config: - module: etcd metricsets: ["leader", "self", "store"] hosts: "${data.host}:2379" Watch Docker events and react to changes
  17. 23 Autodiscover (new in 6.1) Watch Docker events and react

    to changes Events API Container start/stop events Beats { "host": "10.4.15.9", "port": 2379, "docker": { "container": { "id": "13a2...d716" "name": "etcd", "image": "quay.io/coreos/etcd:v3.0.0", "labels": { "io.kubernetes.pod.name": "etcd-4dk4c", "io.kubernetes.pod.namespace": "kube-system" ... } } } } 1. autodiscover event - module: etcd metricsets: ["leader", "self", "store"] hosts: "${data.host}:2379" config template 3. var expansion 2. match condition 4. launch module - module: etcd metricsets: ["leader", "self", "store"] hosts: "10.4.15.9:2379"
  18. 25 volume mounts volume mounts Docker deployment Kibana Elasticsearch docker

    host Log files (/var/lib/docker/containers) Web Apps Services Docker API ... Networking Filebeat Metricbeat /proc filesystem
  19. 26 Kubernetes deployment Node 1 Metricbeat Filebeat Node 2 Metricbeat

    Filebeat Node n Metricbeat Filebeat Filebeat DaemonSet Metricbeat DaemonSet
  20. 28 Service: “beats-demo” LoadBalancer Deployment: “beats-demo“ Demo scenario: https://github.com/exekias/beats-kubernetes-demo Pod

    Pod ... Deployment: “mysql“ Logs Metrics Network analytics App Performance Metrics Pod