Upgrade to Pro — share decks privately, control downloads, hide ads and more …

Lightning Talk: Data Visualization Specialist (Ari Sanoff, Truven Health Analytics)

exploreUX
March 09, 2016

Lightning Talk: Data Visualization Specialist (Ari Sanoff, Truven Health Analytics)

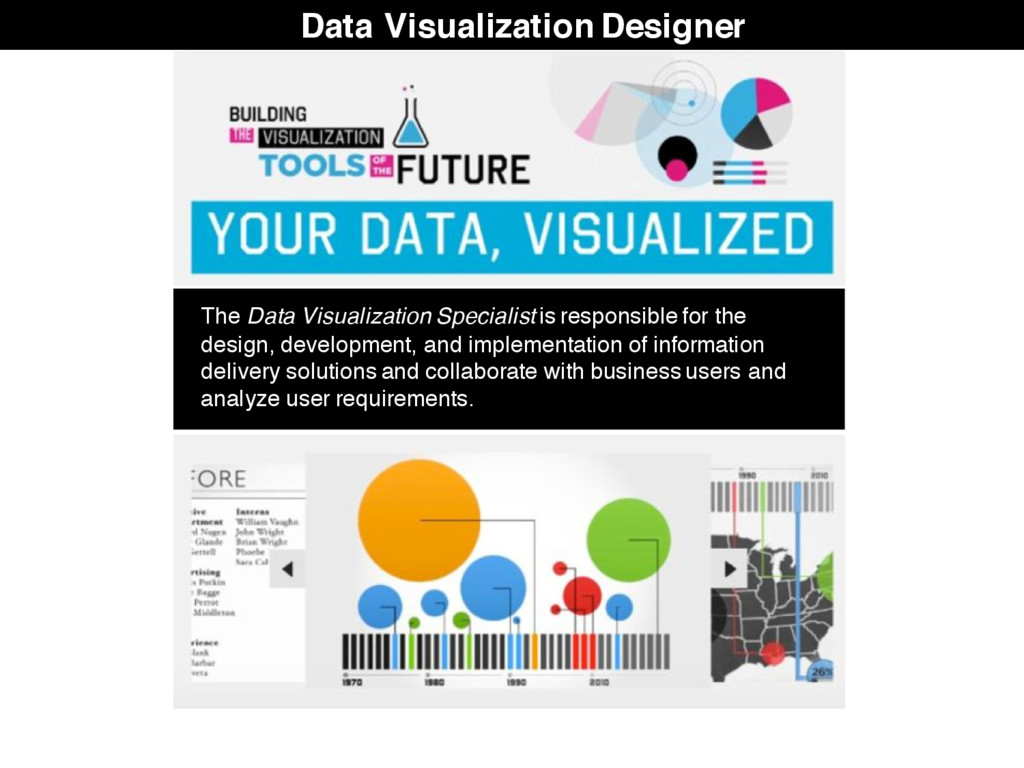
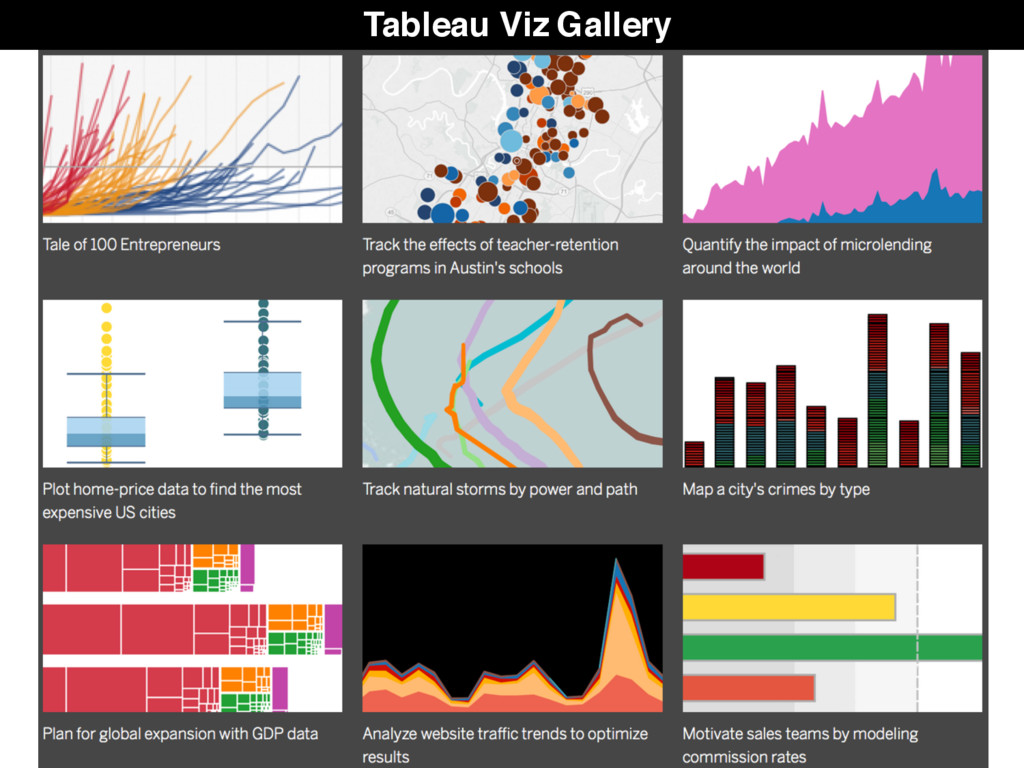
This was part of a kick-off event "A Day in the Life of a [UX Role]," where we had current practitioners present lightning talks about their UX role. The event was held on March 9, 2016 (http://www.meetup.com/exploreUX-raleigh/events/228364314/). Ari spoke about being data visualization specialist.

In the coming months, we'll be doing monthly presentations that dive deeper on a UX role. To learn more, check out http://www.meetup.com/exploreUX-raleigh This series is brought to you by exploreUX and Triangle UXPA.

exploreUX

March 09, 2016
Tweet

More Decks by exploreUX

Other Decks in Design

Transcript

  1. Data Visualization Designer The Data Visualization Specialist is responsible for

    the design, development, and implementation of information delivery solutions and collaborate with business users and analyze user requirements.
  2. The Happy Couple User experience (UX) is the bridge between

    big data analytics and the end user. The richness of big data being collected by all types of companies has unleashed a treasure trove of information for user experience designers. UX designers can create more robust solutions for users by analyzing these enormous data sets.
  3. • How fast are you going? • How much fuel

    remains? • Does anything need your attention? A dashboard is a visual display of the most important information needed to achieve one or more objectives, consolidated and arranged on a single screen so the information can be monitored at a glance. – Stephen Few What is a Dashboard?
  4. • How fast are you going? • How much fuel

    remains? • Does anything need your attention? Data visualization is a form of visual communication where data is presented in a pictorial or graphical format. By presenting complex data sets in a visual way, people can comprehend and analyze the information set faster and more clearly. What is a Data Visualization?
  5. • Consider your audience • How will they use the

    information? • How “statistically savvy” are they? • How do they consume the information? Different things to different people… Business Questions
  6. Data Visualization: Why it Matters Because of the way the

    human brain processes information, using charts or graphs to visualize large amounts of complex data is easier than poring over spreadsheets or reports. Data visualization is a quick, easy way to convey concepts in a universal manner – and you can experiment with different scenarios by making slight adjustments. Why is data visualization important? Data visualization can also: • Identify areas that need attention or improvement. • Clarify which factors influence customer behavior. • Help you understand which products to place where. • Predict sales volumes.
  7. Experts “5 Grand Principles of Data Visualization” “7 Core Design

    Principles for Displaying Quantitative Information”