Upgrade to Pro — share decks privately, control downloads, hide ads and more …

how ruby uses memory and tuning

Sponsored · SiteGround - Reliable hosting with speed, security, and support you can count on.

how ruby uses memory and tuning

A brief of ruby memory mechanism and optimization tips

Avatar for Jason Hou

Jason Hou

May 25, 2018

More Decks by Jason Hou

Other Decks in Technology

Transcript

  1. R U B Y M E M O RY H

    O W R U B Y M E M O RY W O R K S A N D T U N E 侯俊杰@BOOHEE 2018.5
  2. A G E N D A • Ruby 内存⼯工作原理理 •

    内存消耗过⾼高的原因 • 解决内存过⾼高的⽅方案 • 如何调试内存泄漏漏
  3. R U B Y M E M O RY S

    T R U C T U R E R U B Y 内 存 ⼯工 作 原 理理
  4. G C : : I N T E R N

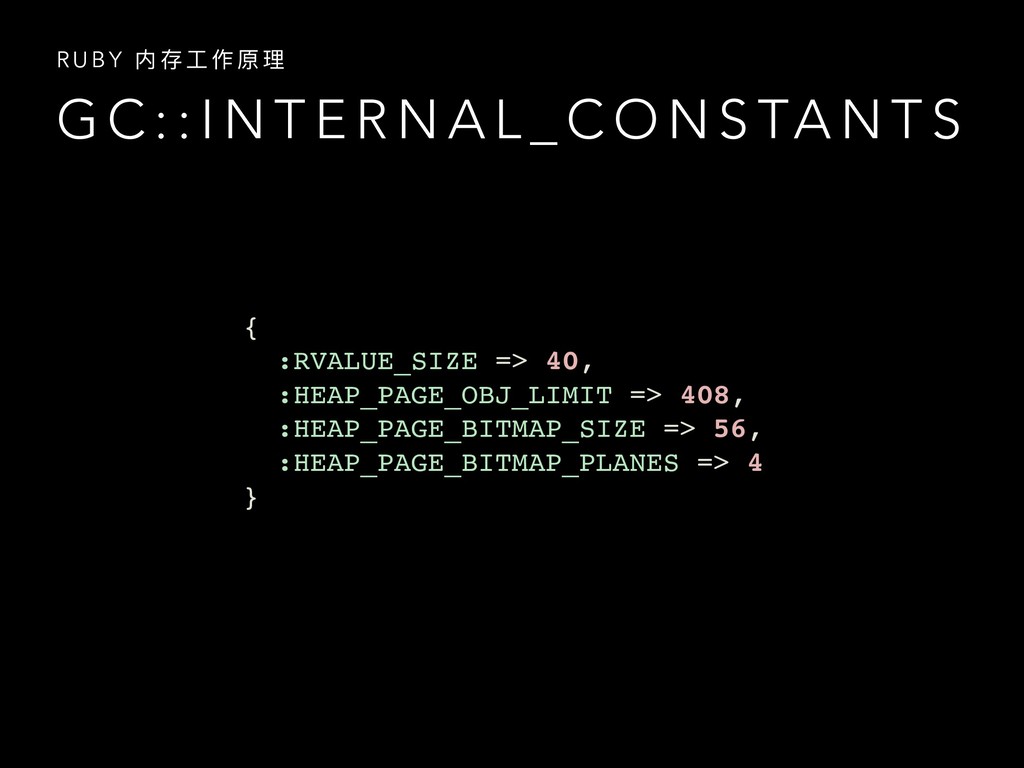
    A L _ C O N S TA N T S R U B Y 内 存 ⼯工 作 原 理理 { :RVALUE_SIZE => 40, :HEAP_PAGE_OBJ_LIMIT => 408, :HEAP_PAGE_BITMAP_SIZE => 56, :HEAP_PAGE_BITMAP_PLANES => 4 }
  5. G A R B A G E C O L

    L E C T O R R U B Y 内 存 ⼯工 作 原 理理
  6. G A R B A G E C O L

    L E C T O R R U B Y 内 存 ⼯工 作 原 理理
  7. B L O AT & L E A K S

    内 存 消 耗 过 ⾼高 的 原 因
  8. T O O M U C H O B J

    E C T S 内 存 消 耗 过 ⾼高 的 原 因 def make_an_array array = [] 10_000_000.times do array << "a string" end return nil end
  9. M E M O RY F R A G M

    E N T 内 存 消 耗 过 ⾼高 的 原 因
  10. M E M O RY F R A G M

    E N T 内 存 消 耗 过 ⾼高 的 原 因
  11. G L I B C M A L L O

    C 内 存 消 耗 过 ⾼高 的 原 因
  12. C O D E O P T I M I

    Z AT I O N 解 决 内 存 膨 胀 的 ⽅方 案 • N + 1 Query • Sidekiq ActiveRecord query cache • Ruby 2.4.1 和 RestClient https://bugs.ruby-lang.org/ issues/13772#note-11
  13. J E M A L L O C 解 决

    内 存 膨 胀 的 ⽅方 案
  14. J E M A L L O C 解 决

    内 存 膨 胀 的 ⽅方 案
  15. J E M A L L O C 解 决

    内 存 膨 胀 的 ⽅方 案
  16. C O M PA C T I N G G

    C 解 决 内 存 膨 胀 的 ⽅方 案
  17. T U N I N G G C 解 决

    内 存 膨 胀 的 ⽅方 案 • RUBY_GC_HEAP_INIT_SLOTS: Ruby初始化slots数量量,数量量 越⼤大后续malloc次数越⼩小 • RUBY_GC_HEAP_GROWTH_FACTOR: 内存分配增⻓长因⼦子 • RUBY_GC_MALLOC_LIMIT: 分配内存超过限制后触发GC • RUBY_GC_HEAP_FREE_SLOTS: free slot⼩小于阈值时触发GC
  18. M E M O RY L E A K S

    如 何 调 试 内 存 泄 漏漏
  19. L E A K G E M S 如 何

    调 试 内 存 泄 漏漏 • celluloid > 0.16.0 < 0.17.2 • redis = 3.3.0 • sidekiq < 3.5.1 • https://github.com/ASoftCo/leaky-gems
  20. A P M 如 何 调 试 内 存 泄

    漏漏 • newrelic • one_apm • scout_apm • …..
  21. P R O F I L E R T O

    O L S 如 何 调 试 内 存 泄 漏漏 • derailed_benchmarks • oink • allocation_tracer • memory_profiler
  22. D E R A I L E D _ B

    E N C H M A R K S 如 何 调 试 内 存 泄 漏漏 status git:(master) derailed bundle:mem bundle exec derailed exec perf:mem bundle exec derailed exec perf:objects TOP: 90.6914 MiB rails/all: 15.9336 MiB carrierwave/mongoid: 8.3438 MiB passport_rpc: 6.8516 MiB elasticsearch: 6.4531 MiB oj_mimic_json: 3.7656 MiB admin_gateway: 3.7188 MiB airbrake: 3.6406 MiB state_machine: 3.5742 MiB sass-rails: 3.4063 MiB slim: 2.3594 MiB mobile_recharge: 2.1719 MiB paranoia: 2.1445 MiB aasm: 1.8867 MiB elasticsearch/model: 1.582 MiB enumerize: 1.5586 MiB
  23. O I N K 如 何 调 试 内 存

    泄 漏漏 $ oink --threshold=75 /tmp/logs/* ---- MEMORY THRESHOLD ---- THRESHOLD: 75 MB -- SUMMARY -- Worst Requests: 1. Feb 02 16:26:06, 157524 KB, SportsController#show 2. Feb 02 20:11:54, 134972 KB, DashboardsController#show 3. Feb 02 19:06:13, 131912 KB, DashboardsController#show 4. Feb 02 08:07:46, 115448 KB, GroupsController#show 5. Feb 02 12:19:53, 112924 KB, GroupsController#show 6. Feb 02 13:03:00, 112064 KB, ColorSchemesController#show 7. Feb 02 13:01:59, 109148 KB, SessionsController#create … Rails.application.middleware.use(Oink::Middleware, instruments: :memory)
  24. M E M O RY _ P R O F

    I L E R 如 何 调 试 内 存 泄 漏漏 gem install 'memory_profiler' bundle show memory_profiler bundle exec rails console 2.4.1 :001 > $LOAD_PATH << ‘~/.rvm/gems/ruby-2.3.0/gems/redis-3.3.1' 2.4.1 :002 > MemoryProfiler.report { foo }
  25. M E M O RY _ P R O F

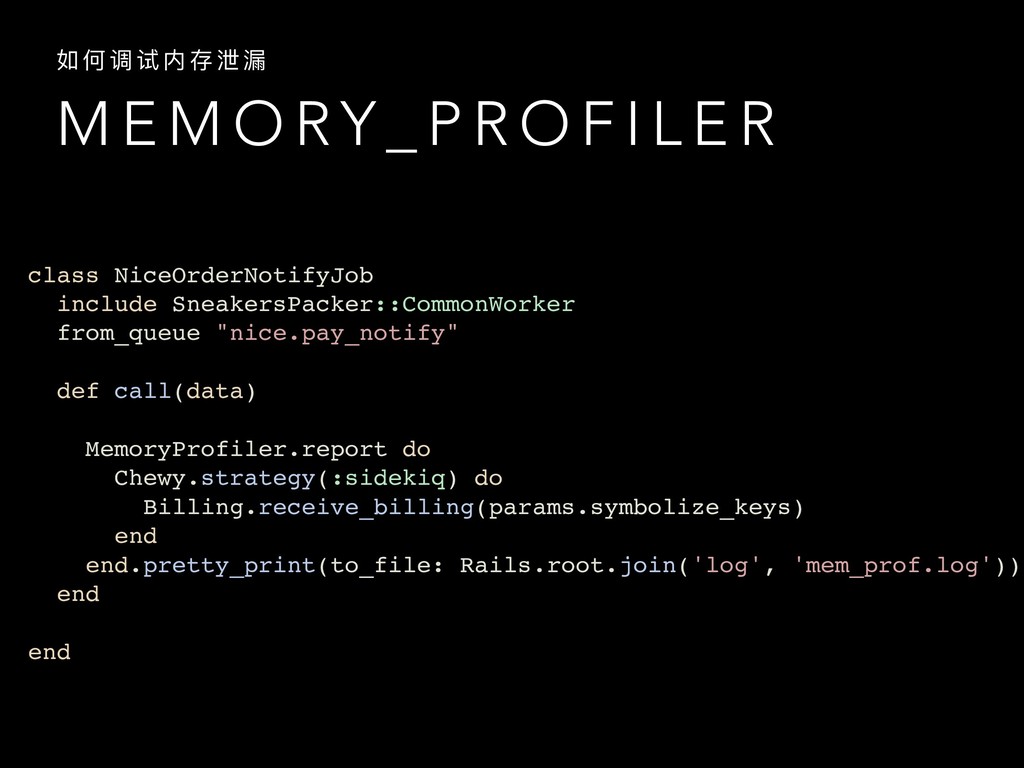
    I L E R 如 何 调 试 内 存 泄 漏漏 class NiceOrderNotifyJob include SneakersPacker::CommonWorker from_queue "nice.pay_notify" def call(data) MemoryProfiler.report do Chewy.strategy(:sidekiq) do Billing.receive_billing(params.symbolize_keys) end end.pretty_print(to_file: Rails.root.join('log', 'mem_prof.log')) end end
  26. C O N C L U S I O N

    • 内存堆栈空间,分代GC • 程序和分配器器产⽣生碎⽚片导致内存消耗过⾼高 • 更更换内存分配器器,可以解决内存碎⽚片问题 • 检查内存泄漏漏的gem包,使⽤用APM⼯工具或⼿手动调试