Upgrade to Pro — share decks privately, control downloads, hide ads and more …

Introduction to StatsD

Introduction to StatsD

WebCamp KL August 2013

Farzad Ghanei

August 28, 2013
Tweet

More Decks by Farzad Ghanei

Other Decks in Programming

Transcript

  1. Information • Improving a system requires resources • Increase return

    on investment by correct assignment of resources • Decisions are made by analyzing information
  2. Data Collection • Accurate data helps better decisions • Data

    from different aspects provide a better understanding • Data collection should have least affect on performance of the running system
  3. Measurement • Measurement from outside simulates users better, but is

    limited to the surface layer (interface) • Measurement from inside provides accurate results from all layers of the system
  4. StatsD • A solution to send data from within the

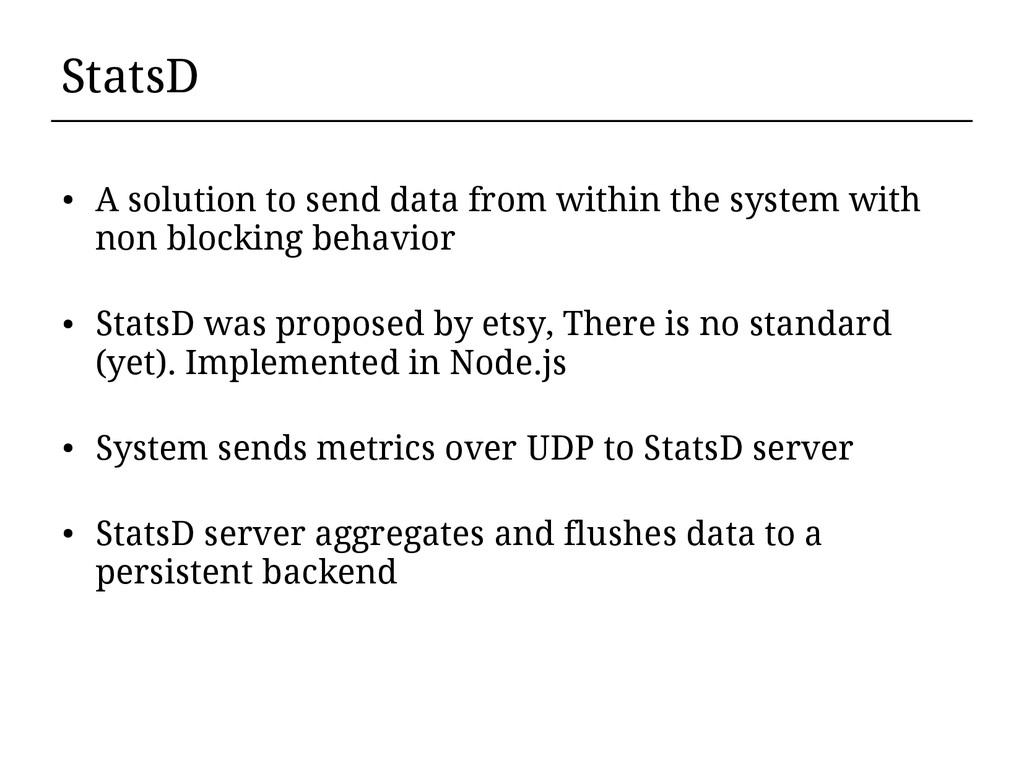
    system with non blocking behavior • StatsD was proposed by etsy, There is no standard (yet). Implemented in Node.js • System sends metrics over UDP to StatsD server • StatsD server aggregates and flushes data to a persistent backend
  5. StatsD • Protocol is simple: Metrics have name, value and

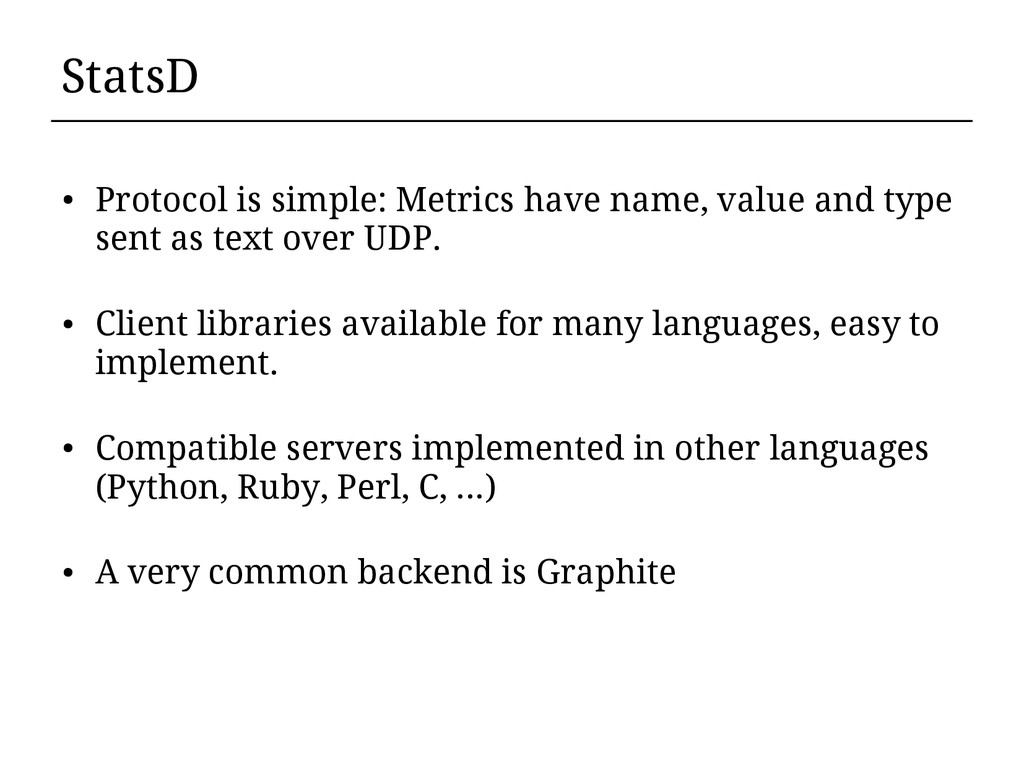
    type sent as text over UDP. • Client libraries available for many languages, easy to implement. • Compatible servers implemented in other languages (Python, Ruby, Perl, C, …) • A very common backend is Graphite
  6. Metric Types • Counter: Anything you count • Timer: Duration

    of a task • Gauge: Any arbitrary value • Set: Number of unique values in each sampling period
  7. Bucky • Bucky is a StatsD server written in Python

    $ pip install bukcy $ pip install bukcy $ bucky bucky.conf metricsd_enabled = False collectd_enabled = False statsd_enabled = True statsd_ip = "" statsd_port = 8125 statsd_flush_time = 1.0 graphite_ip = "127.0.0.1" graphite_port = 2003 • Sample Bucky configuration file
  8. Sample Code #!/usr/bin/env python # - install statsd module: pip

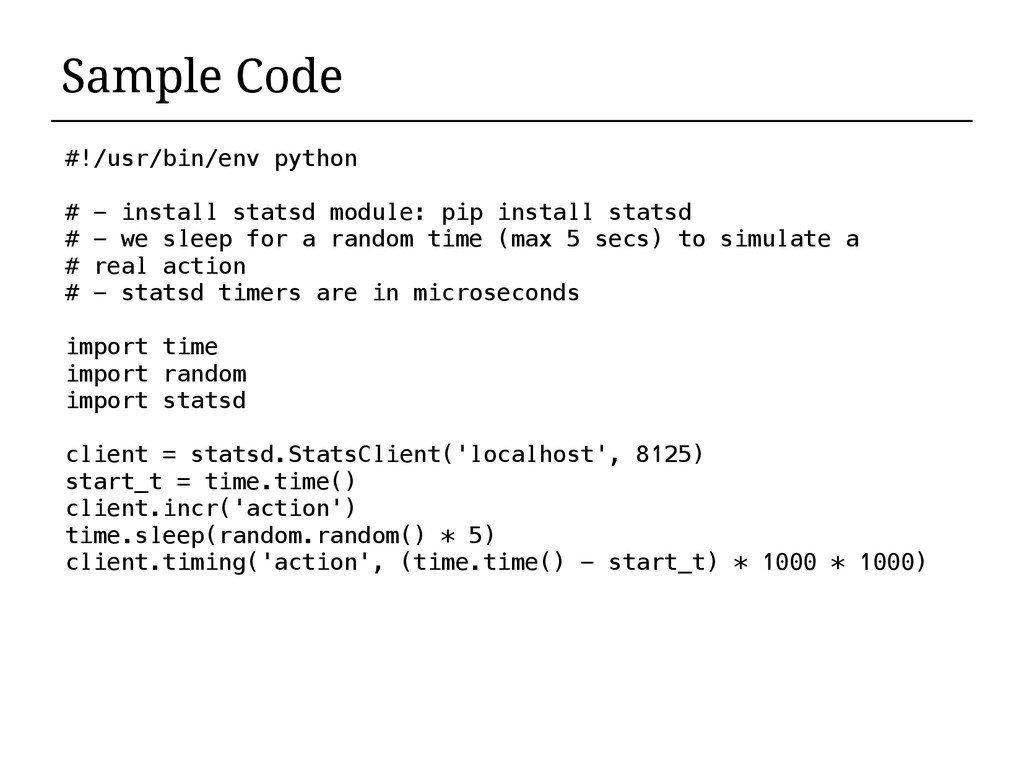
    install statsd # - we sleep for a random time (max 5 secs) to simulate a # real action # - statsd timers are in microseconds import time import random import statsd client = statsd.StatsClient('localhost', 8125) start_t = time.time() client.incr('action') time.sleep(random.random() * 5) client.timing('action', (time.time() - start_t) * 1000 * 1000)
  9. Graphite • A solution to collect, store and visualize data

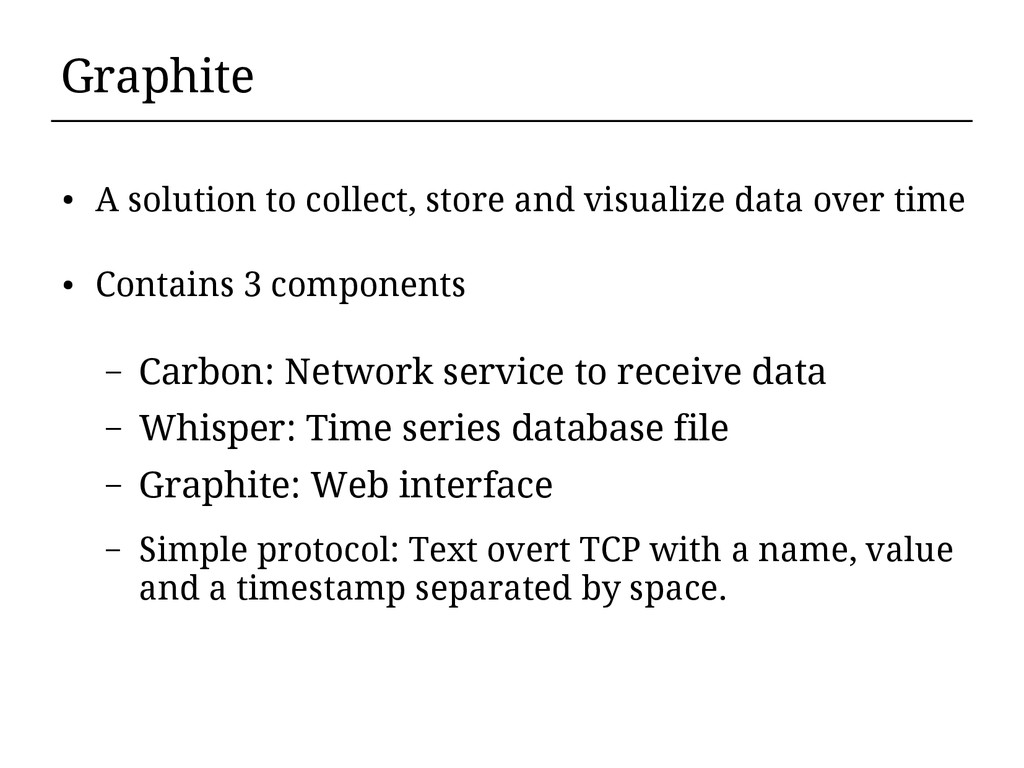
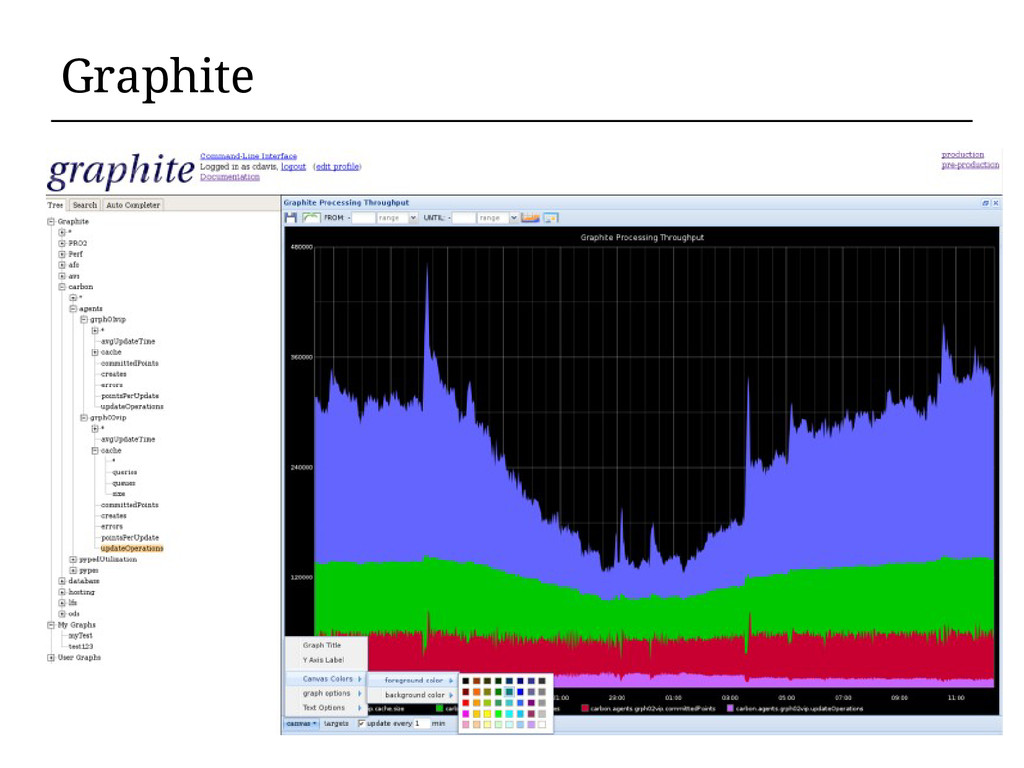
    over time • Contains 3 components – Carbon: Network service to receive data – Whisper: Time series database file – Graphite: Web interface – Simple protocol: Text overt TCP with a name, value and a timestamp separated by space.