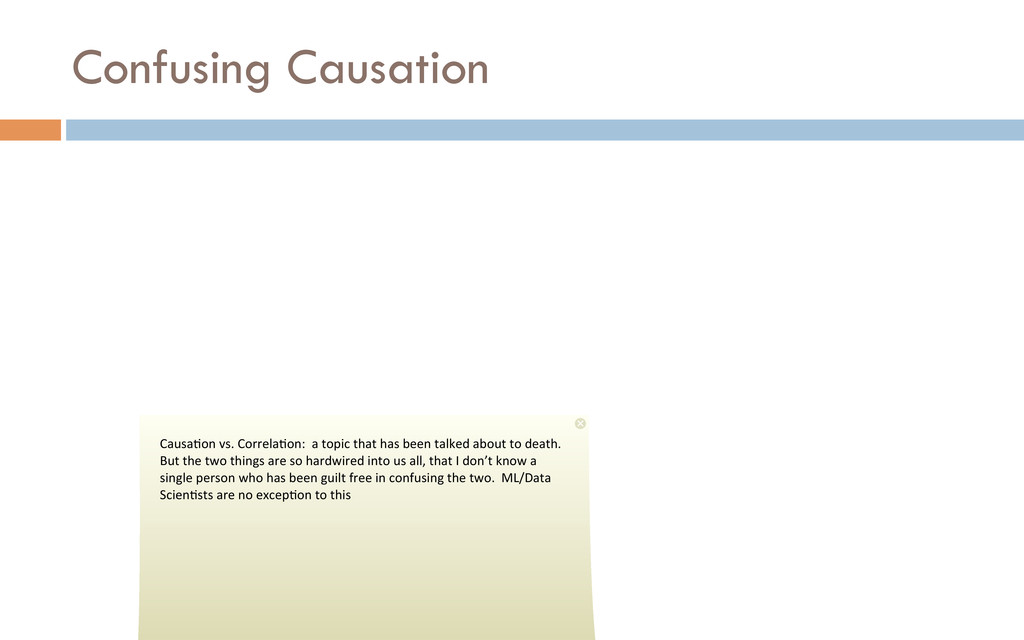
been talked about to death. But the two things are so hardwired into us all, that I don’t know a single person who has been guilt free in confusing the two. ML/Data Scien%sts are no excep%on to this
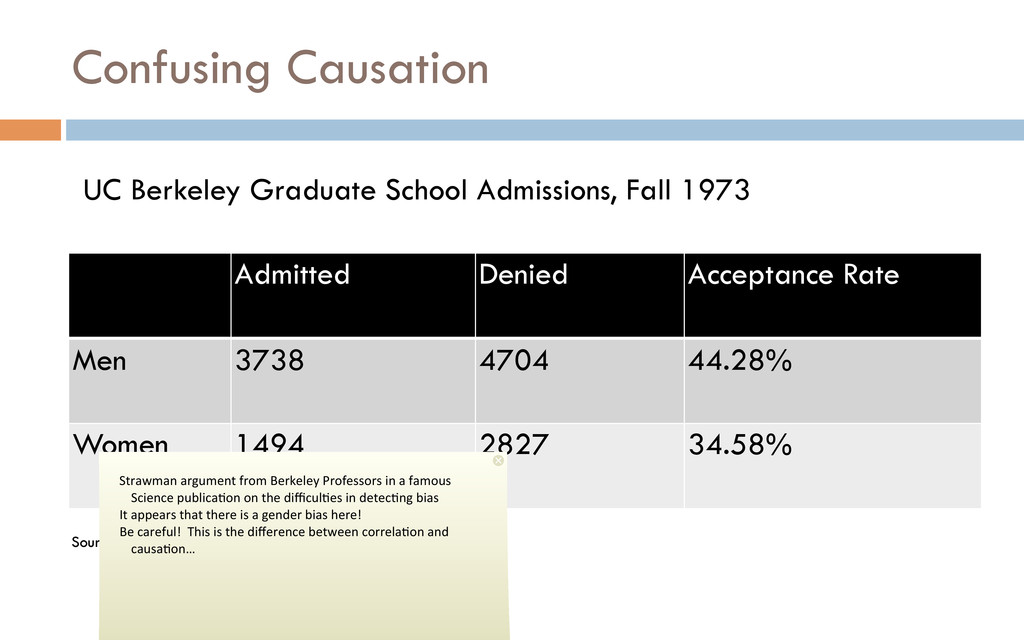
Women 1494 2827 34.58% UC Berkeley Graduate School Admissions, Fall 1973 Source: Bickel, Hammel, and O’Connell. Science 187, 4175 (1975) Strawman argument from Berkeley Professors in a famous Science publica%on on the difficul%es in detec%ng bias It appears that there is a gender bias here! Be careful! This is the difference between correla%on and causa%on…
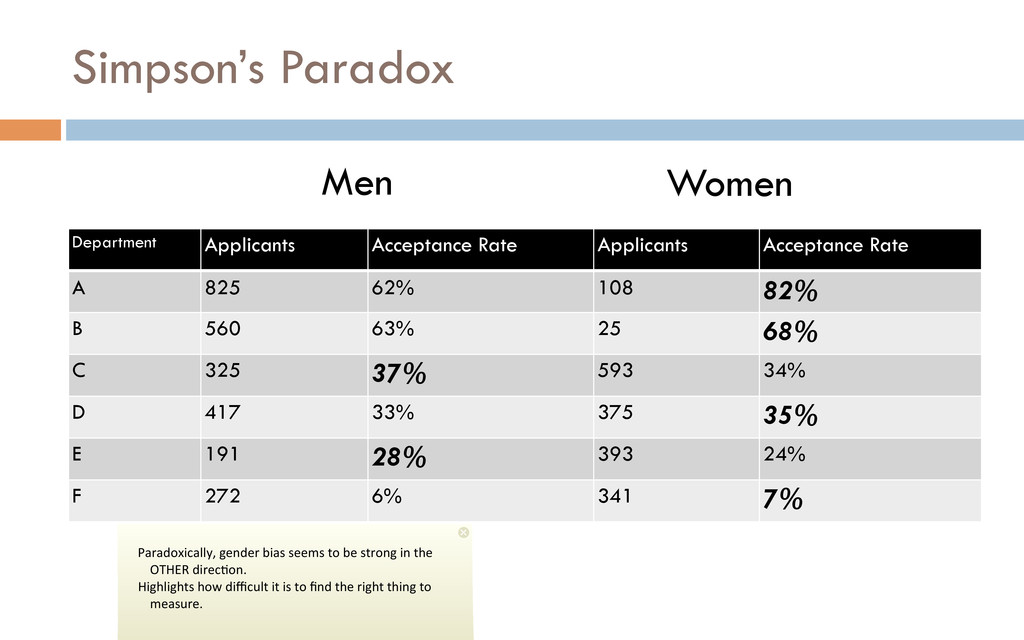
825 62% 108 82% B 560 63% 25 68% C 325 37% 593 34% D 417 33% 375 35% E 191 28% 393 24% F 272 6% 341 7% Men Women Paradoxically, gender bias seems to be strong in the OTHER direc%on. Highlights how difficult it is to find the right thing to measure.
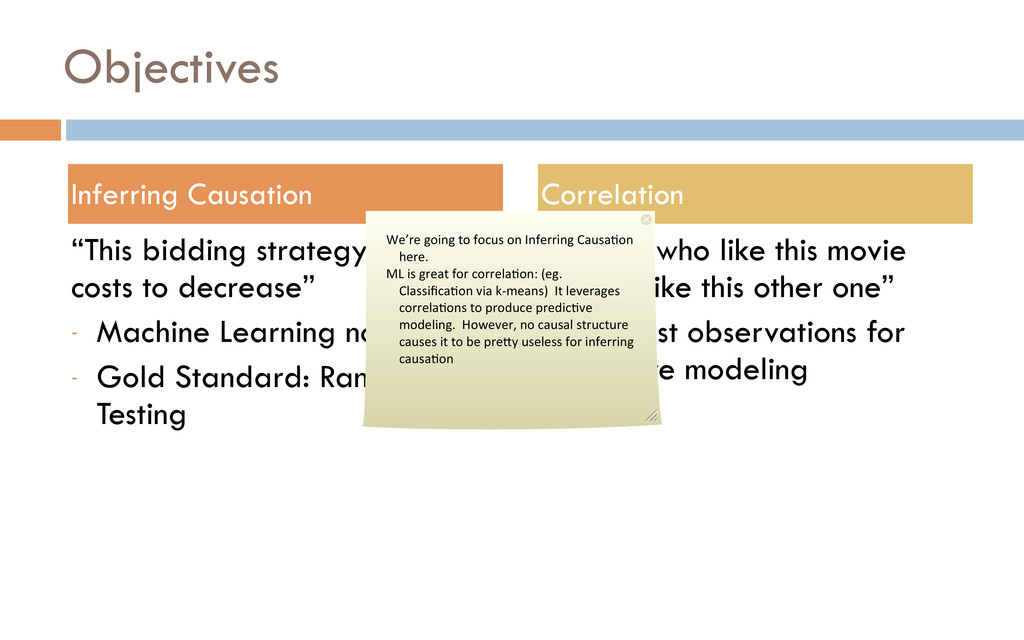
Learning not helpful - Gold Standard: Randomized Testing “People who like this movie tend to like this other one” - Use past observations for predictive modeling Inferring Causation Correlation We’re going to focus on Inferring Causa%on here. ML is great for correla%on: (eg. Classifica%on via k-‐means) It leverages correla%ons to produce predic%ve modeling. However, no causal structure causes it to be preUy useless for inferring causa%on
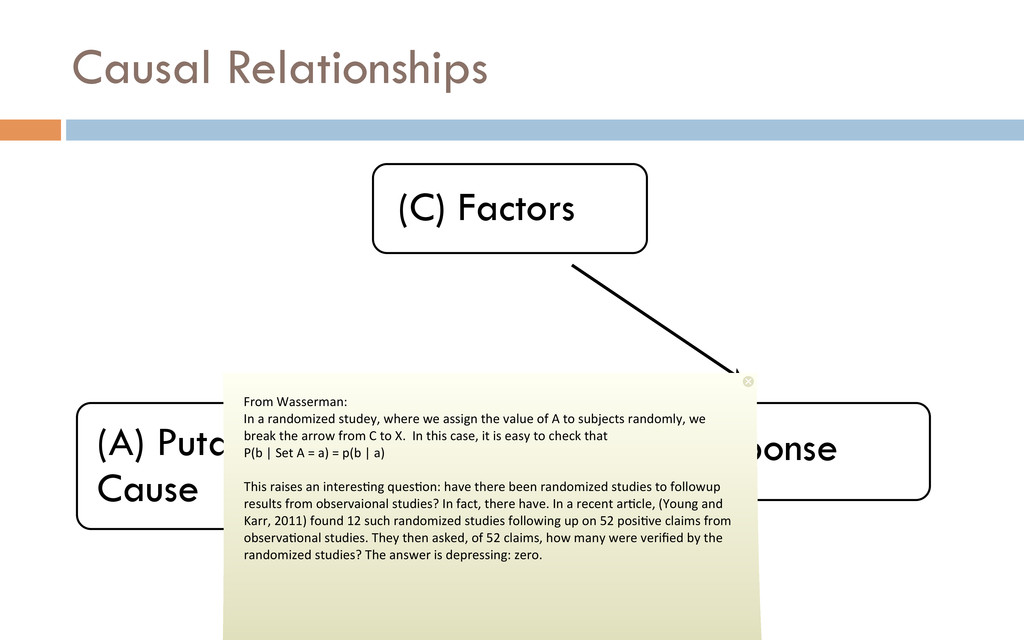
Wasserman: In a randomized studey, where we assign the value of A to subjects randomly, we break the arrow from C to X. In this case, it is easy to check that P(b | Set A = a) = p(b | a) This raises an interes%ng ques%on: have there been randomized studies to followup results from observaional studies? In fact, there have. In a recent ar%cle, (Young and Karr, 2011) found 12 such randomized studies following up on 52 posi%ve claims from observa%onal studies. They then asked, of 52 claims, how many were verified by the randomized studies? The answer is depressing: zero.
This is the main thing to peg your progress on. Especially in the early stages of a startup, you’re probably super excited about tackling some brand new problem few people know much about. It’s easy to get super carried away with modeling some sort of new behavior. The thing that grounds you though– is pegging the accuracy/success of what you’re working on against a new metric. This is key as you con%nue to develop the system you’ve created a prototype for.
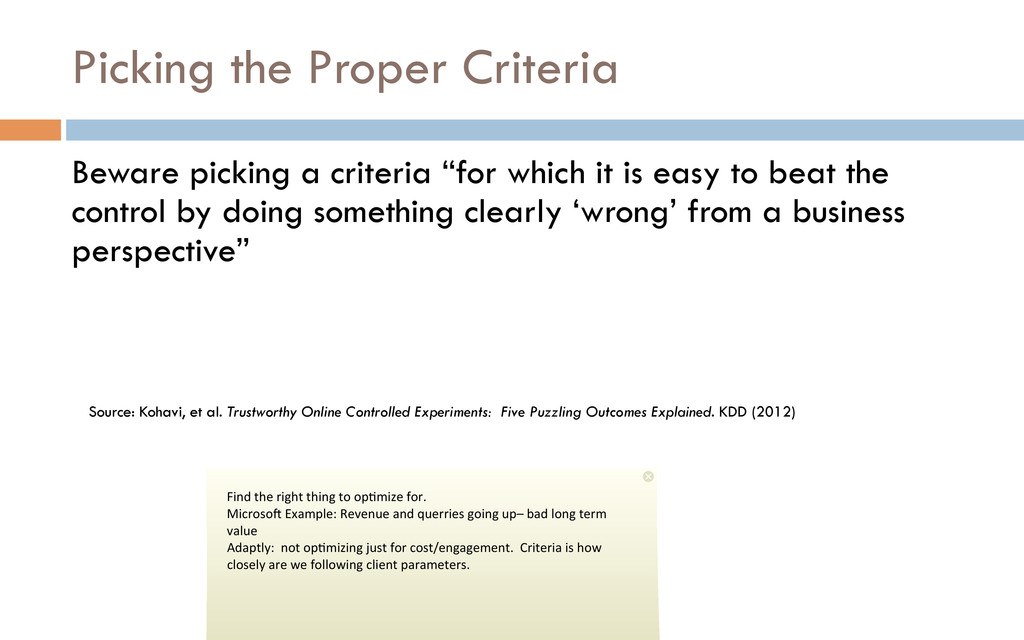
it is easy to beat the control by doing something clearly ‘wrong’ from a business perspective” Source: Kohavi, et al. Trustworthy Online Controlled Experiments: Five Puzzling Outcomes Explained. KDD (2012) Find the right thing to op%mize for. Microsof Example: Revenue and querries going up– bad long term value Adaptly: not op%mizing just for cost/engagement. Criteria is how closely are we following client parameters.
don’t know, because you s%ll Google things, [even afer the Bing challenge] Kohavi, et al.: Bing, Microsof’s search engine, had a bug in an experiment, which resulted in very poor
KEY KEY: do A/A tes%ng as well. : tests your methodology. Most of what you “measure” may very well just be noise. [Men%on?] Carryover effect… same users having nega%ve experience. Can be slightly mi%gated/tested for using A/A
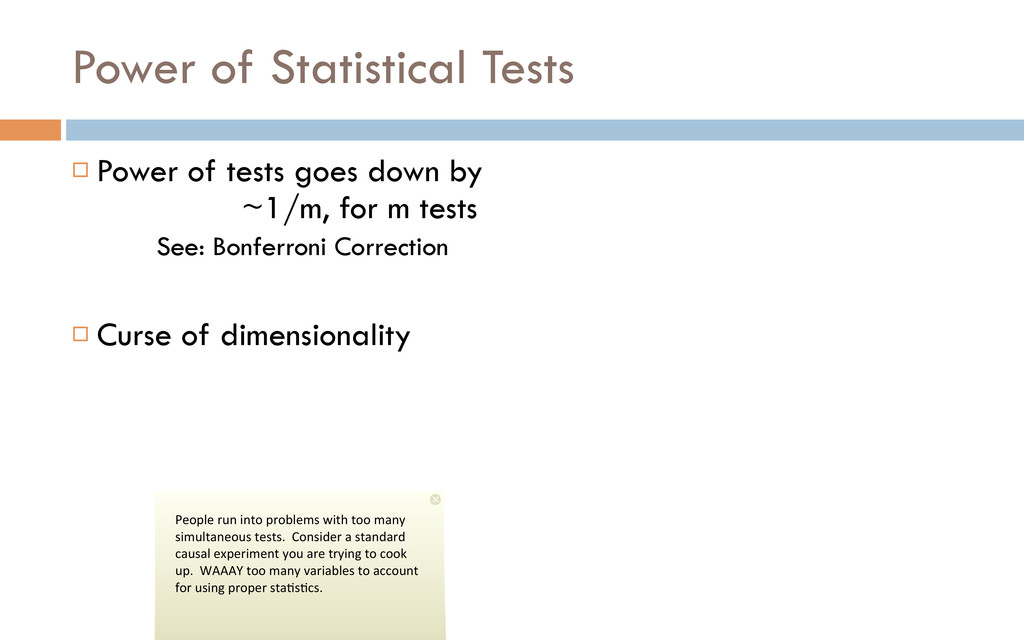
by ~1/m, for m tests See: Bonferroni Correction ¨ Curse of dimensionality People run into problems with too many simultaneous tests. Consider a standard causal experiment you are trying to cook up. WAAAY too many variables to account for using proper sta%s%cs.
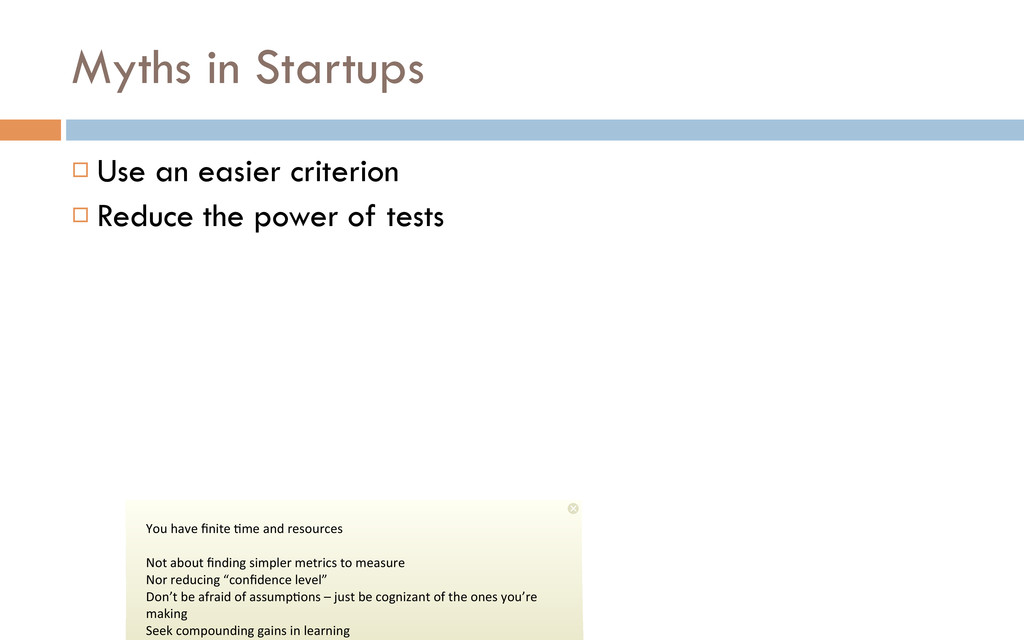
the power of tests You have finite %me and resources Not about finding simpler metrics to measure Nor reducing “confidence level” Don’t be afraid of assump%ons – just be cognizant of the ones you’re making Seek compounding gains in learning
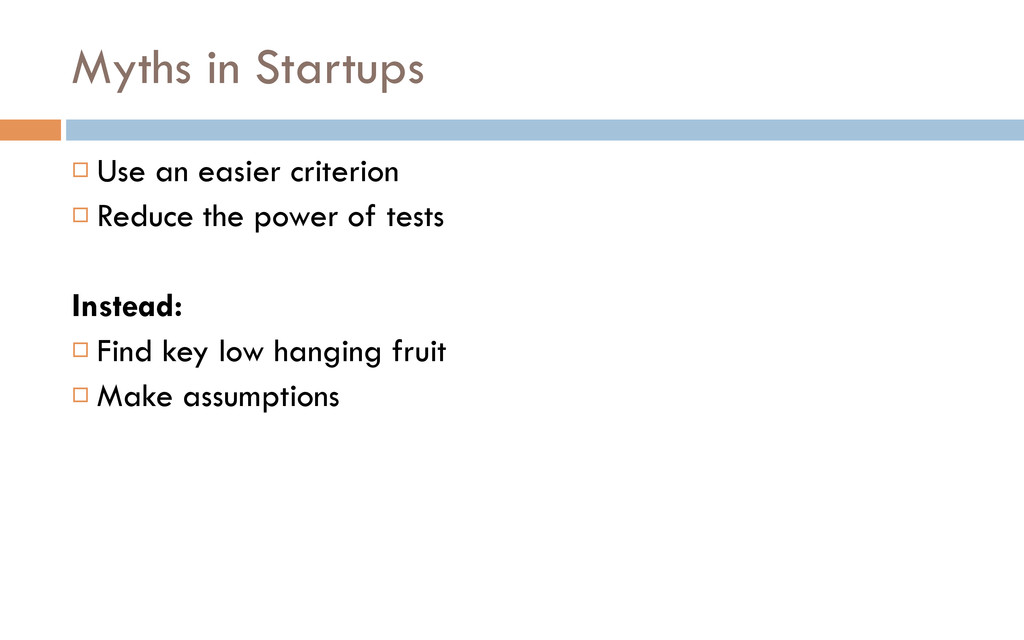
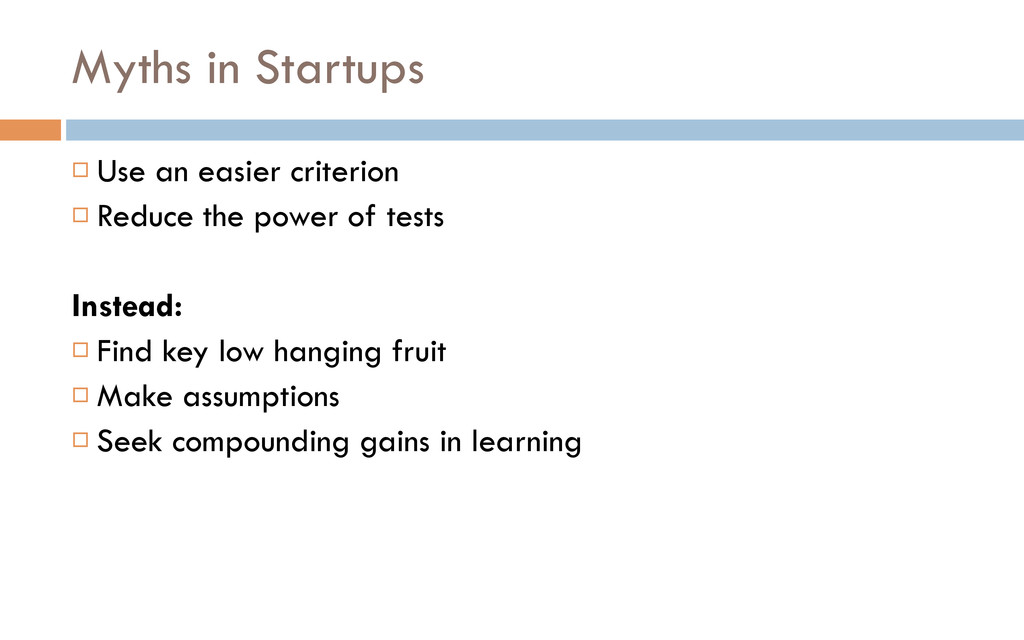
the power of tests Instead: ¨ Find key low hanging fruit ¨ Make assumptions ¨ Seek compounding gains in learning ¨ Avoid having to reinvent the wheel
based on your expertise! ¨ Tests should not be ignorant of state of organization. Do not be afraid to use heuris%cs based on your exper%se! Everyone (and their mother) knows what a linear regression is. Nate Silver, tweaking parameters Tests should not be ignorant of state of organiza%on. No reason to treat clients as uniform inputs of the same type. Even internally to your own organiza%on (eg. sales as a pipe of different types)