Upgrade to Pro — share decks privately, control downloads, hide ads and more …

Using Simulation to Manage Software Delivery Risk

Using Simulation to Manage Software Delivery Risk

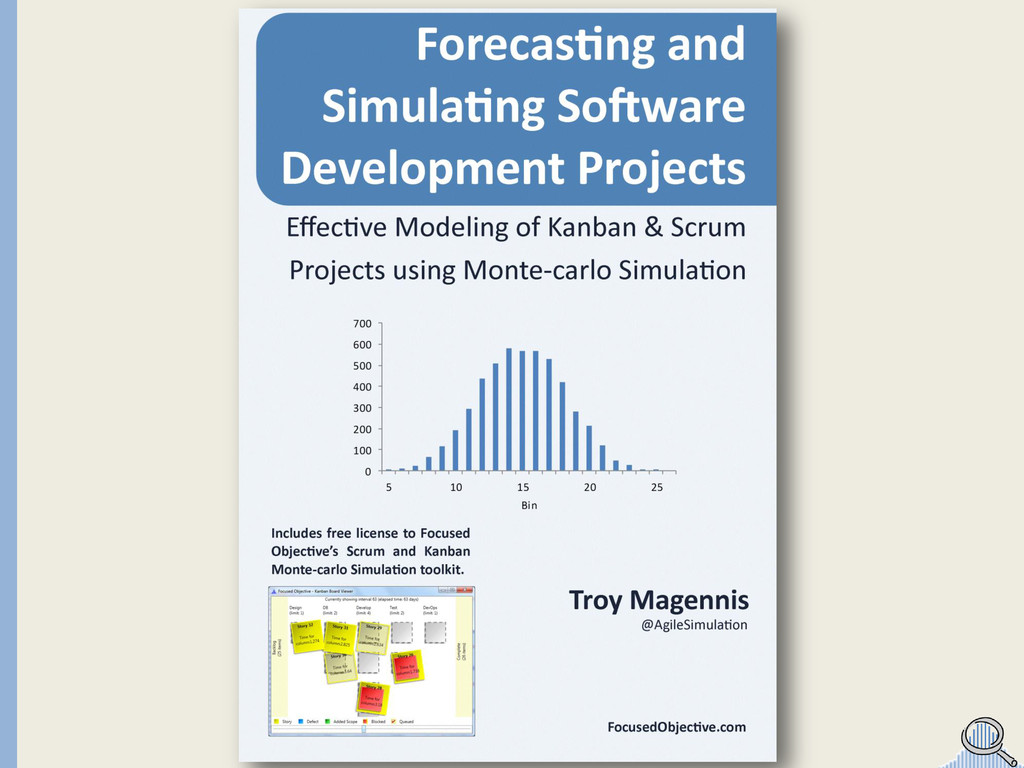
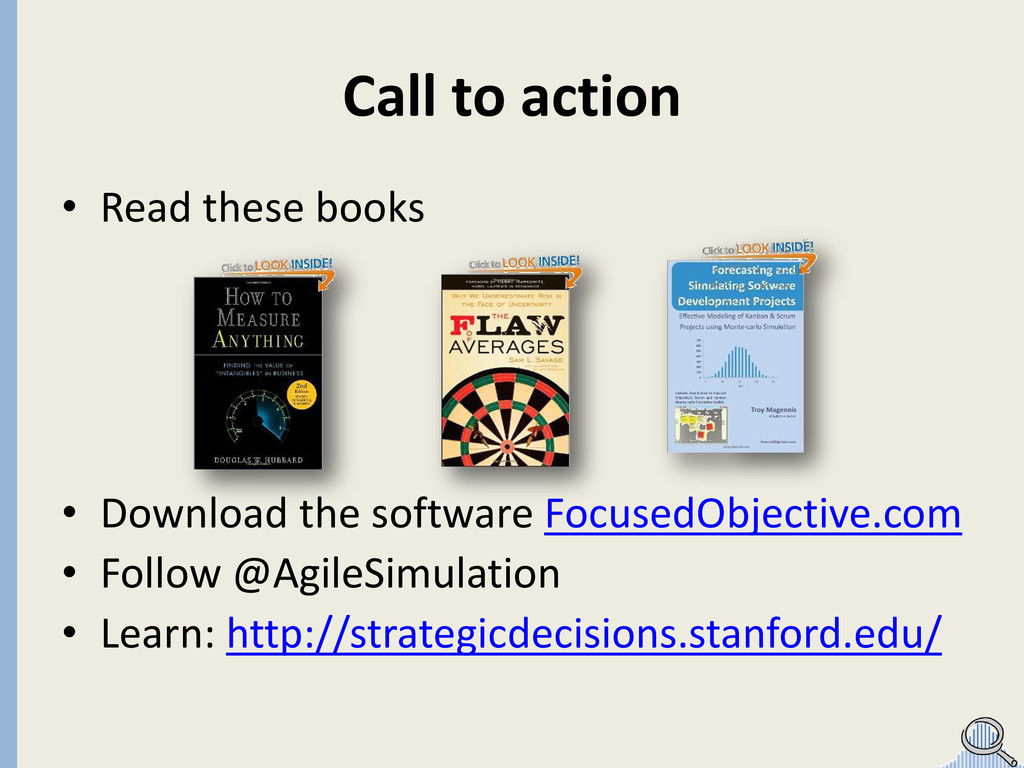
Effective Modeling and Simulating Kanban and Scrum Projects using Monte Carlo Techniques presented at the Lean Software and Systems Conference. For more information see FocusedObjective.com

focusedobjective

May 14, 2012
Tweet

Other Decks in Technology

Transcript

  1. Using Simulation to Manage Software Delivery Risk Effective Modeling and

    Simulating Kanban and Scrum Projects using Monte Carlo Techniques Troy Magennis [email protected] @AgileSimulation
  2. Arm my teams (and yours) with the tools and techniques

    to answer these questions My Mission And manage risk more effectively
  3. • Currently: Founder and CTO Focused Objective • Previously: Vice

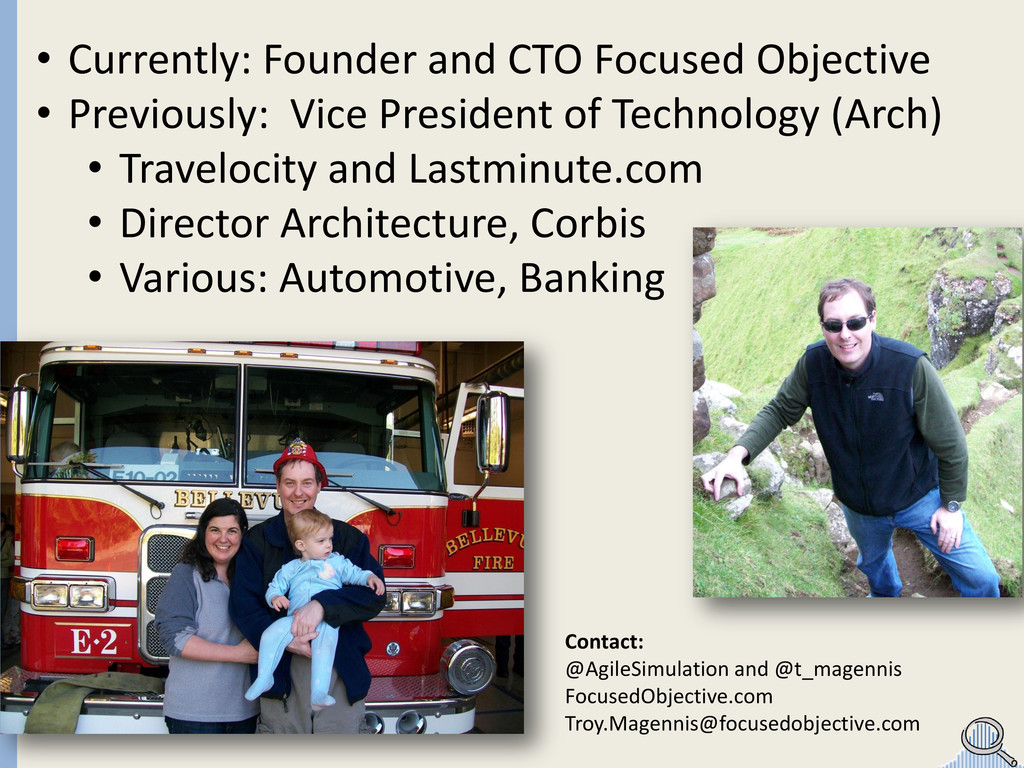
    President of Technology (Arch) • Travelocity and Lastminute.com • Director Architecture, Corbis • Various: Automotive, Banking Contact: @AgileSimulation and @t_magennis FocusedObjective.com [email protected]
  4. A model is a tool used to mimic a real

    world process A tool for low-cost experimentation Definition: Model
  5. A technique of using a model to determine a result

    given a set of input conditions Definition: Simulation
  6. Performing a simulation of a model multiple times using random

    input conditions and recording the frequency of each result occurrence Monte Carlo Simulation
  7. DEMO: VISUAL MODEL SIMULATION DEMO: MONTE-CARLO SIMULATION Simple to more

    complex model and simulation of a software project In case of demo disaster, press here…
  8. When there is no answer (knowable in advance) or when

    the time/effort taken to compute an answer is beyond realistic When to use Monte Carlo Simulation
  9. When a range of input conditions can MASSIVELY alter the

    final outcome When to use Monte Carlo Simulation
  10. High risk industries Natural resource exploration, insurance, finance, banking, pharmaceutical…

    Who Uses Monte Carlo Simulation Software Development == High Risk! Just look at our reputation, and on-time, on-budget success rate…
  11. Why? To Answer Tough Questions… Date and cost forecasts Impact

    of staff hire/loss Cost of defects Cost of blocking events … And my three 1:1 questions each week!
  12. But doesn’t it require estimates? Yes, but very few… MUST:

    Estimate major risks SHOULD: Column cycle-times and story counts
  13. We need to estimate risk events We spend all our

    time estimating here 1 2 3 **Major risk events have the predominate role in deciding where deliver actually occurs **
  14. Is it Accurate? 1. Gin still equals Gout 2. Doesn’t

    suffer from the “Flaw of Averages”
  15. Frequency of Result 1 5 10 15 20 25 Major

    issue: Race condition, third party component failure… The average release date!!! Major Risk Event Shifts Delivery Shape Right Developer Estimates
  16. We need to estimate risk events See model example… We

    spend all our time estimating here 1 2 3 **Major risk events have the predominate role in deciding where deliver actually occurs **
  17. DEMO: FORECASTING (DATES & COST) DEMO: SENSITIVITY (COST OF DEFECTS)

    DEMO: STAFF IMPACT (STAFF RISK) In case of demo disaster or no internet, press here…
  18. Best Practice 1 Start simple and add ONE input condition

    at a time. Visually / Monte-carlo test each input to verify it works
  19. Best Practice 2 Find the likelihood of major events and

    estimate delay E.g. vendor dependencies, performance/memory issues, third party component failures.
  20. Best Practice 3 Only obtain and add detailed estimates and

    opinion to a model if Sensitivity Analysis says that input is material
  21. Best Practice 4 Use a uniform random input distribution UNTIL

    sensitivity analysis says that input is influencing the output
  22. Best Practice 5 Educate your managers’ about risk. They will

    still want a “single” date for planning, but let them decide 75th or 95th confidence level (average is NEVER an option)
  23. Q1. Are we meeting our commitments? Q2. What are the

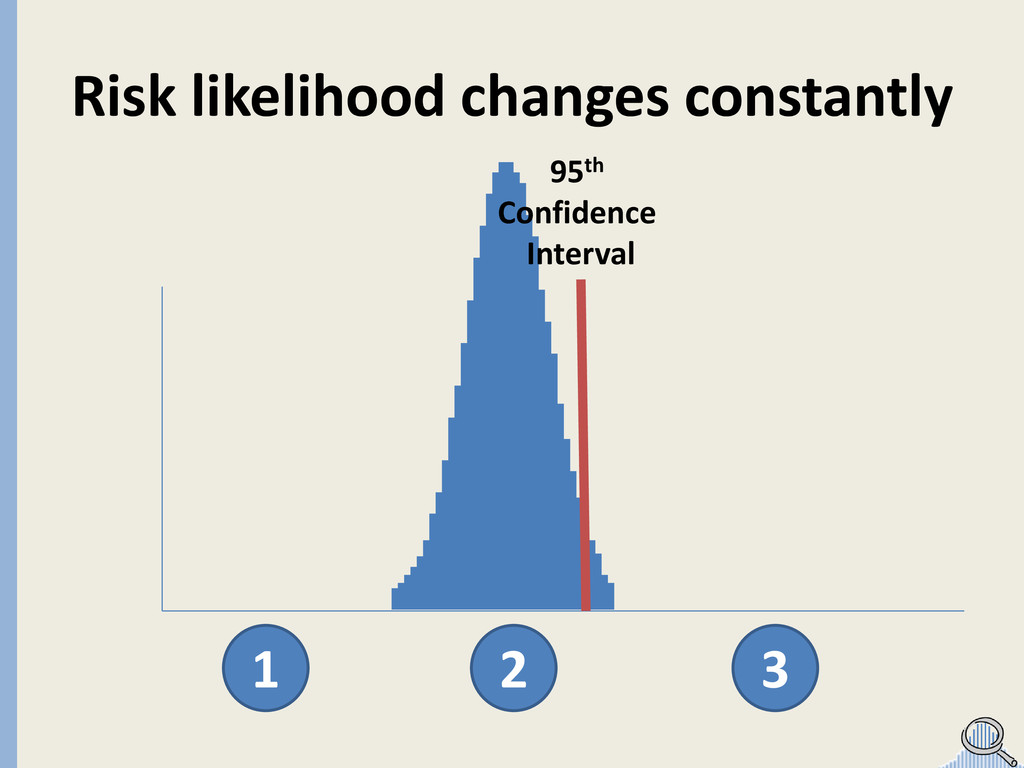
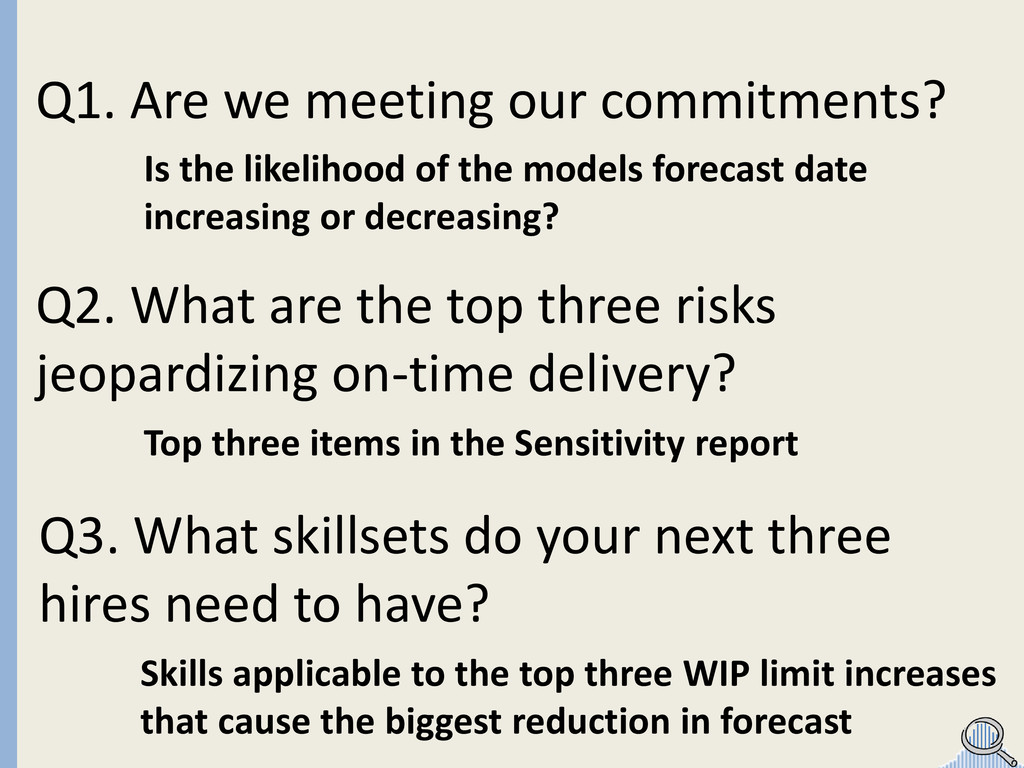
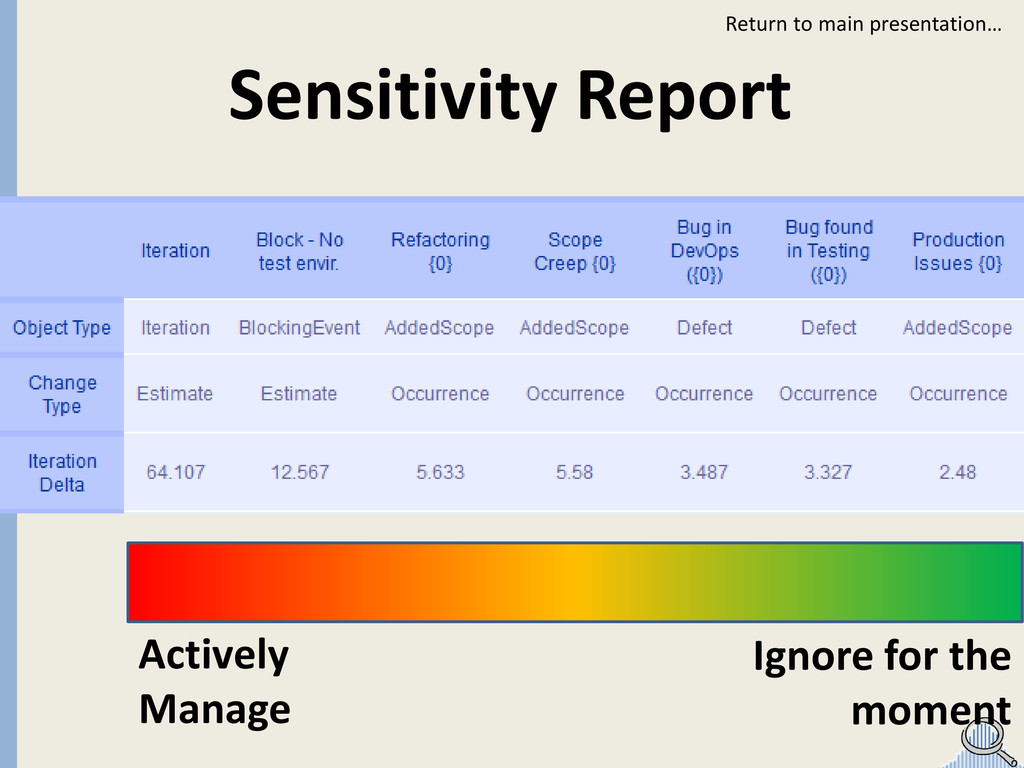
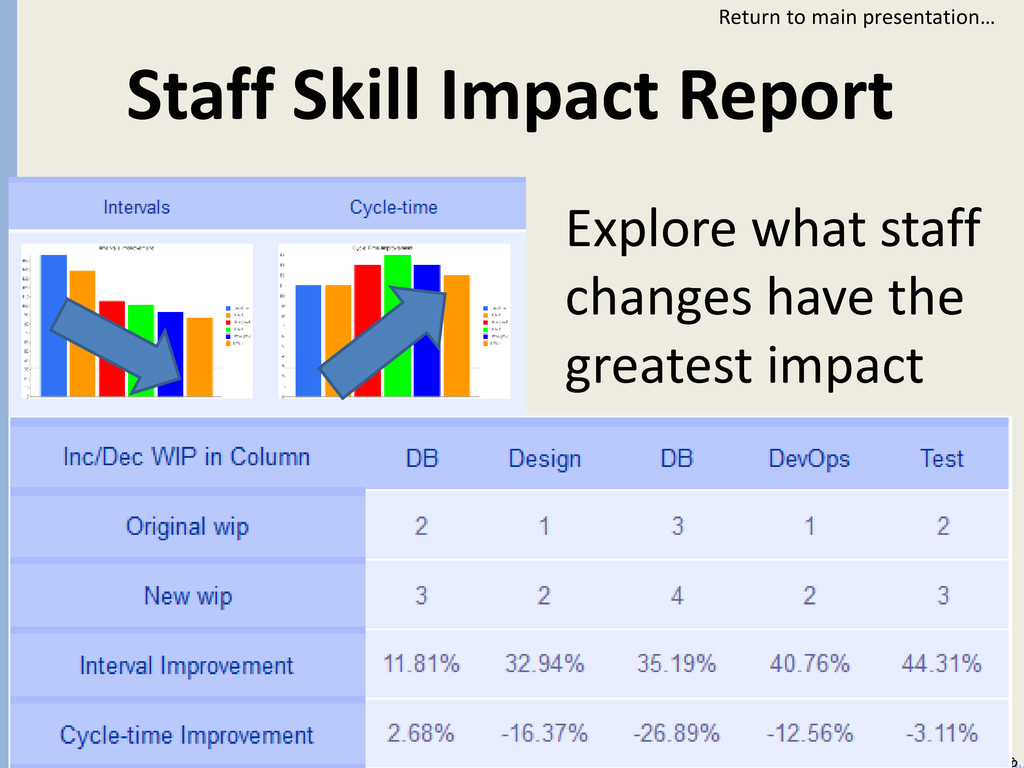
    top three risks jeopardizing on-time delivery? Q3. What skillsets do your next three hires need to have? Is the likelihood of the models forecast date increasing or decreasing? Top three items in the Sensitivity report Skills applicable to the top three WIP limit increases that cause the biggest reduction in forecast
  24. Call to action • Read these books • Download the

    software FocusedObjective.com • Follow @AgileSimulation • Learn: http://strategicdecisions.stanford.edu/
  25. Questions? My Contact Details and to get these slides, the

    software or the book used in this session - FocusedObjective.com Me: [email protected] Follow: @AgileSimulation and @t_magennis
  26. Manual Kanban Model & Simulation Backlog Design Develop Test Deployed

    2 1 – 2 days 1 – 2 days 1 – 2 days 1 2 3 4 PLUS: For this manual example, at least 1 defect, blocking event and scope-creep item. 5
  27. Day 1 Backlog Design Develop Test Deployed 2 1 –

    2 days 1 – 5 days 1 – 2 days 1 Day picked at random for this columns cycle- time range
  28. Day 2 Backlog Design Develop Test Deployed 2 1 day

    1 – 2 days 1 – 5 days 1 – 2 days
  29. Day 3 Backlog Design Develop Test Deployed 2 1 day

    1 – 2 days 1 – 5 days 1 – 2 days
  30. Day 4 Backlog Design Develop Test Deployed 2 1 day

    1 – 2 days 1 – 5 days 1 – 2 days Added Scope
  31. Day 5 Backlog Design Develop Test Deployed 2 1 day

    1 – 2 days 1 – 5 days 1 – 2 days Added Scope
  32. Day 6 Backlog Design Develop Test Deployed 2 1 day

    1 – 2 days 1 – 5 days 1 – 2 days Added Scope
  33. Day 7 Backlog Design Develop Test Deployed 2 1 day

    1 – 2 days 1 – 5 days 1 – 2 days Added Scope
  34. Day 8 Backlog Design Develop Test Deployed 2 1 day

    1 – 2 days 1 – 5 days 1 – 2 days Added Scope
  35. Day 9 Backlog Design Develop Test Deployed 2 1 –

    2 days 1 – 5 days 1 – 2 days Added Scope
  36. Day 10 Backlog Design Develop Test Deployed 2 1 –

    2 days 1 – 5 days 1 – 2 days Added Scope
  37. Day 11 Backlog Design Develop Test Deployed 2 1 –

    2 days 1 – 5 days 1 – 2 days Added Scope
  38. Result versus Frequency (50 runs) More Often Less Often Result

    Values – For example, Days 15 10 20 Frequency of Result 1 5 10 15 20 25
  39. Result versus Frequency (250 runs) More Often Less Often Result

    Values – For example, Days 15 10 20 Frequency of Result 1 5 10 15 20 25
  40. Result versus Frequency (1000+ runs) More Often Less Often Result

    Values – For example, Days 15 10 60 Frequency of Result 1 5 10 15 20 25
  41. Software Development Model Model Columns & WIP Work Defects Blocking

    Events Added Work Staff Vacations … 1 2 3 4 5 6 7 Return to main presentation…
  42. Staff Skill Impact Report Explore what staff changes have the

    greatest impact Return to main presentation…
  43. <setup> <backlog type="custom" > <deliverable name=“work"> <custom count="10">Build website</custom> </deliverable>

    <deliverable name="performance issues, add caching" skipPercentage="50"> <custom count="10" >Rework: Performance Issues</custom> </deliverable> </backlog> <columns> <column id="1" estimateLowBound="1" estimateHighBound="5" wipLimit="1">Develop</column> <column id="2" estimateLowBound="1" estimateHighBound="5" wipLimit="1">Test</column> </columns> </setup> Return to main presentation…