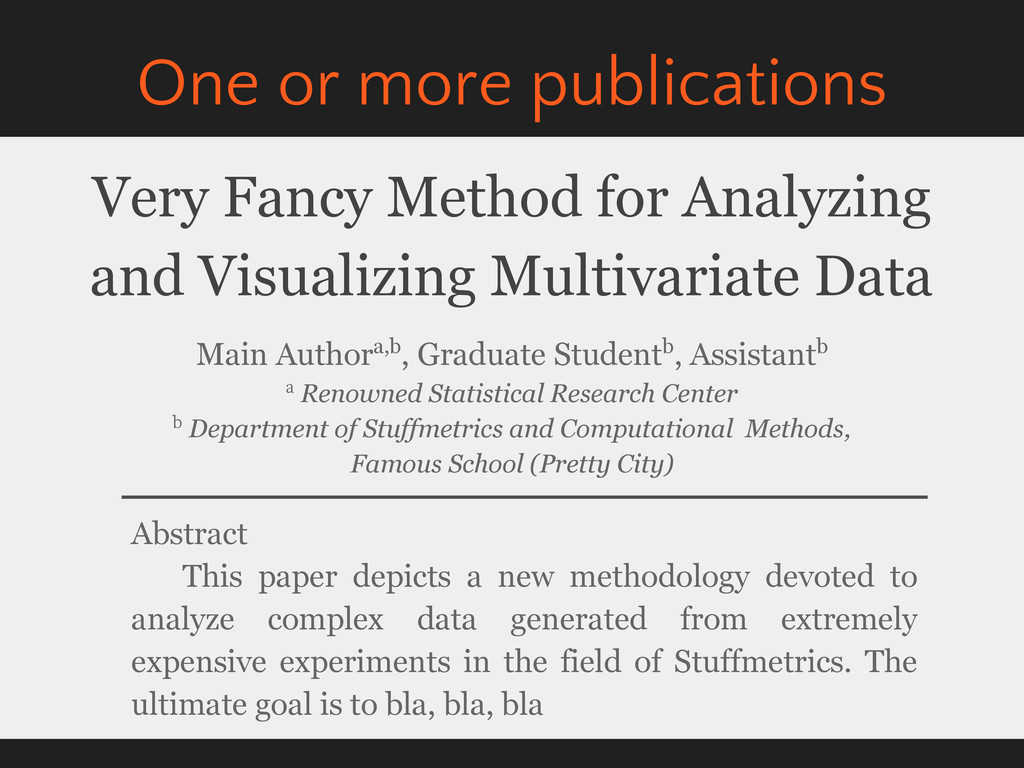
Authora,b, Graduate Studentb, Assistantb a Renowned Statistical Research Center b Department of Stuffmetrics and Computational Methods, Famous School (Pretty City) Abstract This paper depicts a new methodology devoted to analyze complex data generated from extremely expensive experiments in the field of Stuffmetrics. The ultimate goal is to bla, bla, bla One or more publications