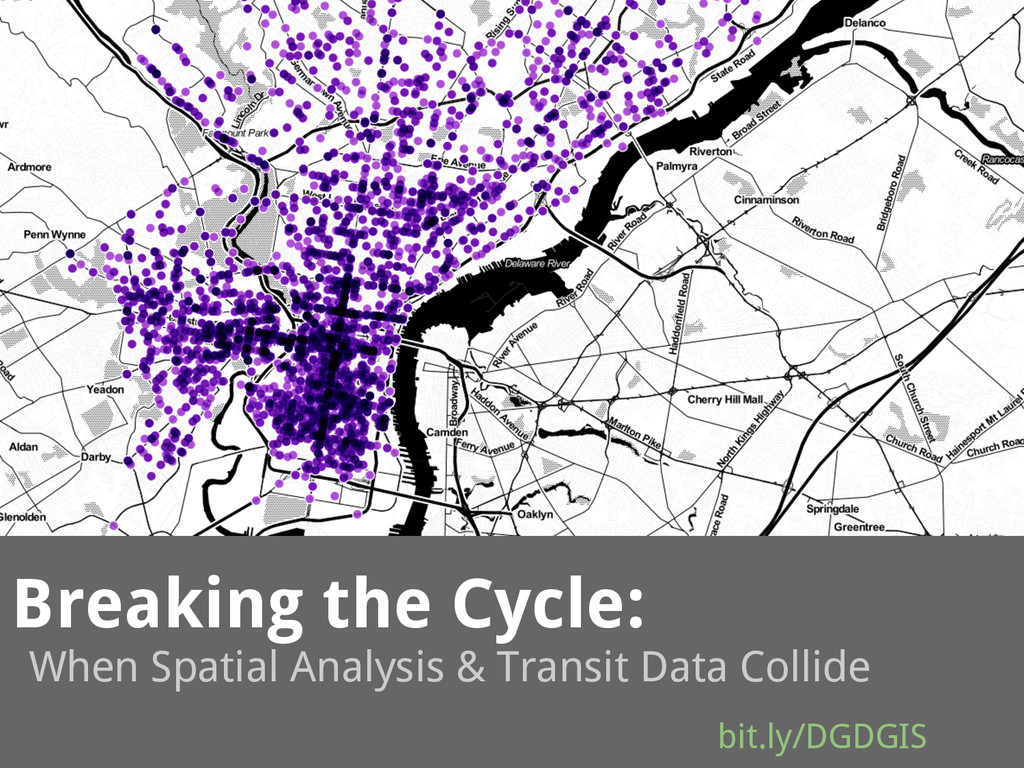
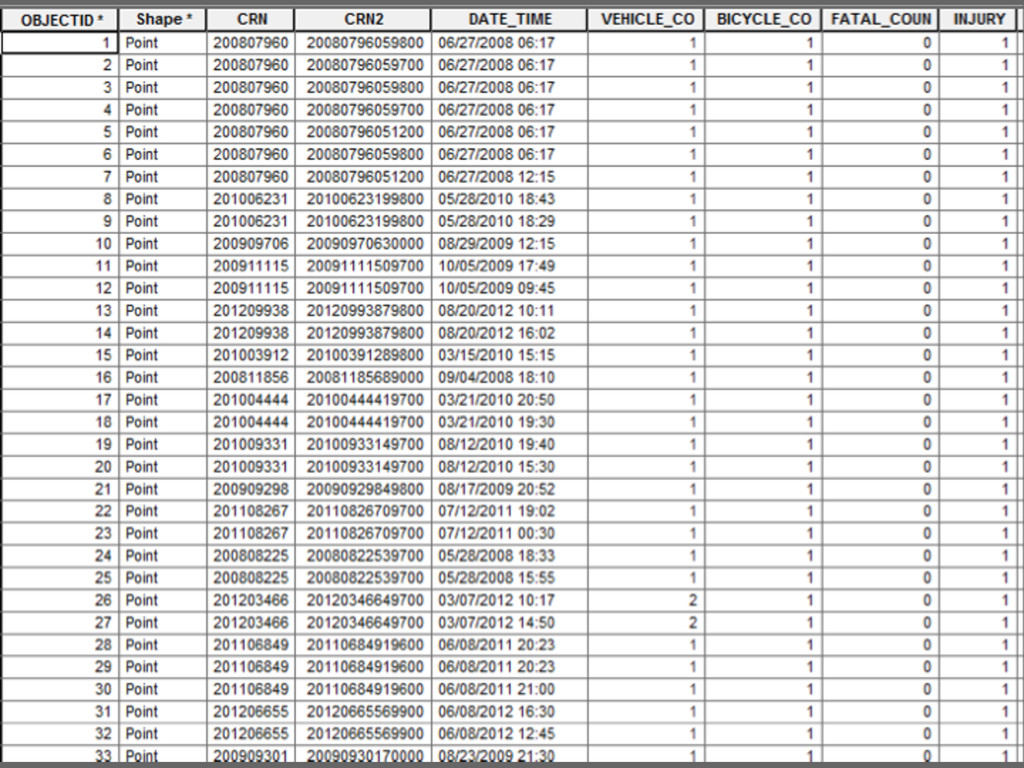
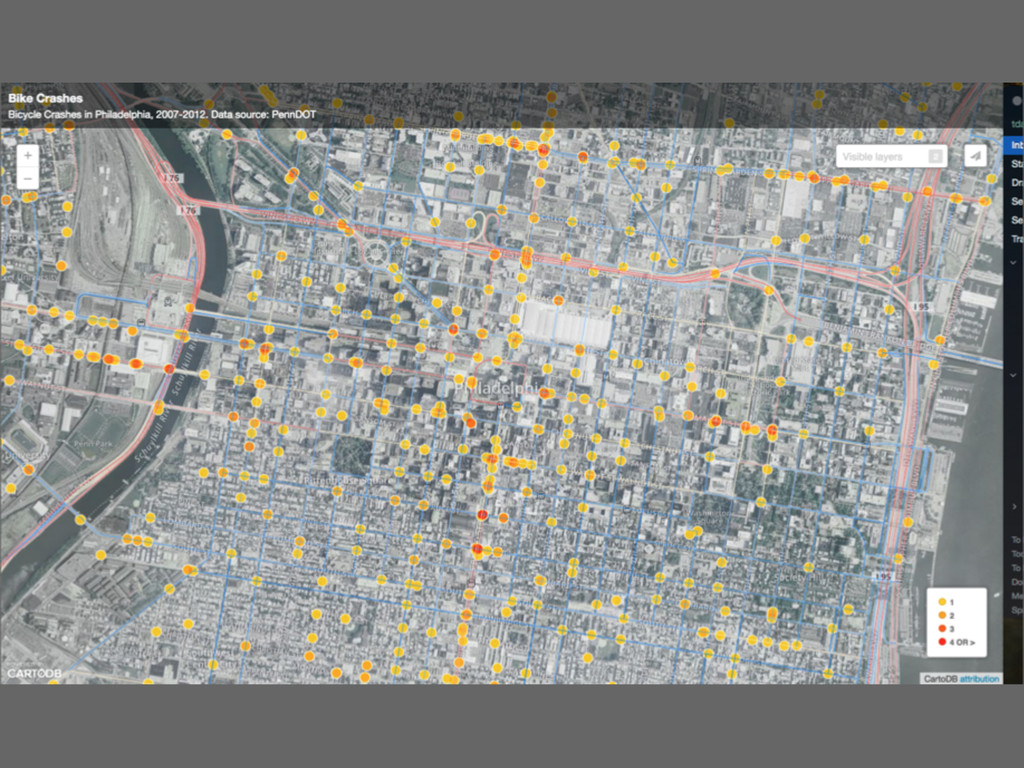
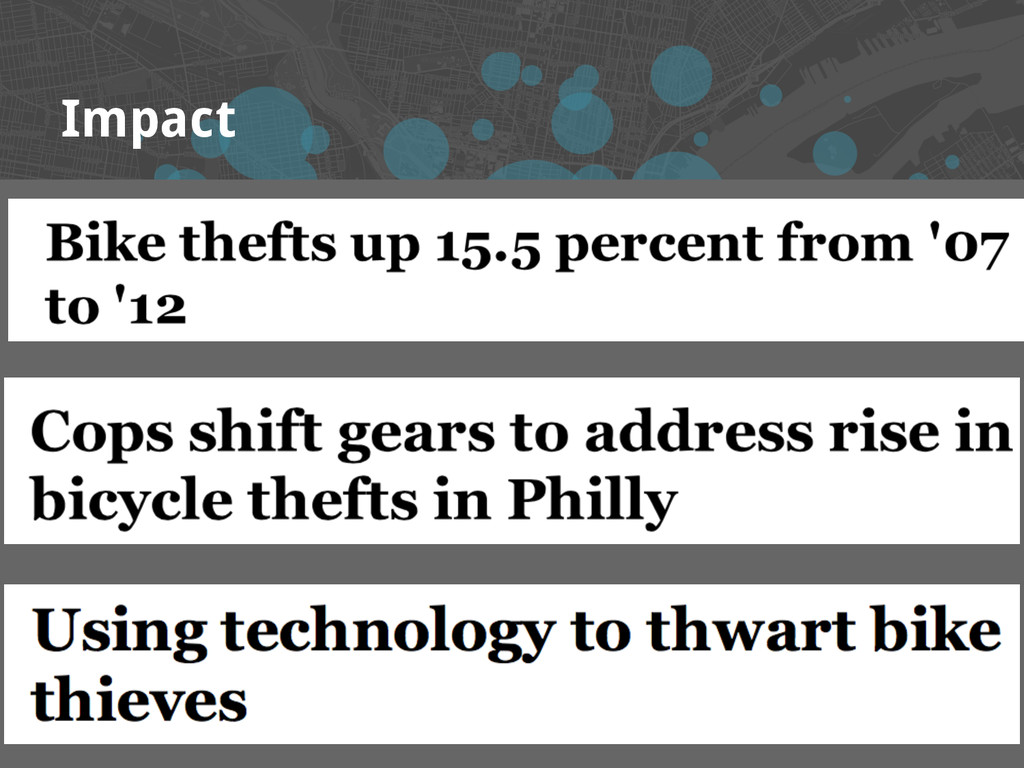
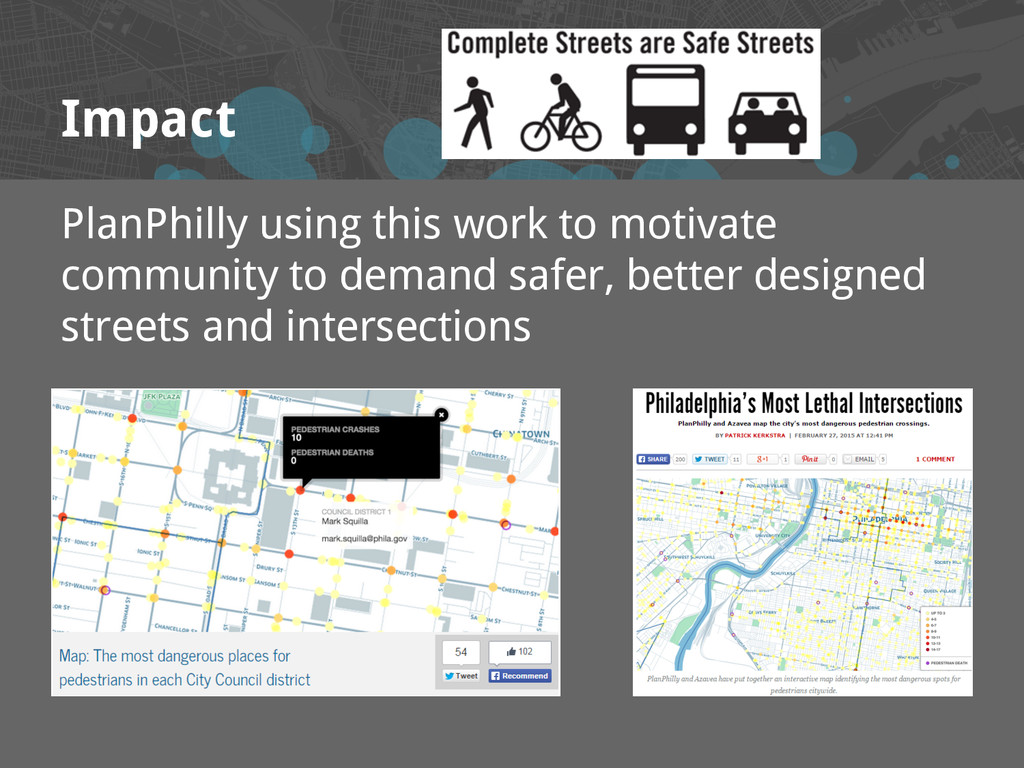
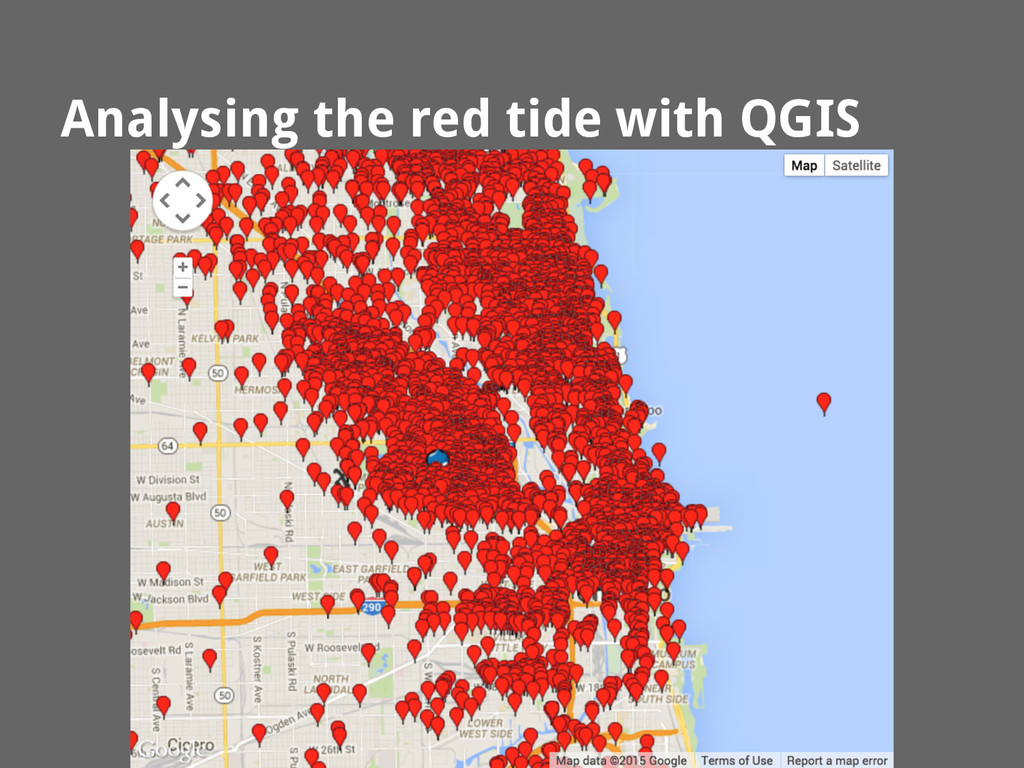
A presentation at Do Good Data 2015 by Tyler Dahlberg and Daniel McGlone on behalf of Azavea. About bicyle theft, pedestrian-auto crashes, case studies, and GIS analysis and webmapping.
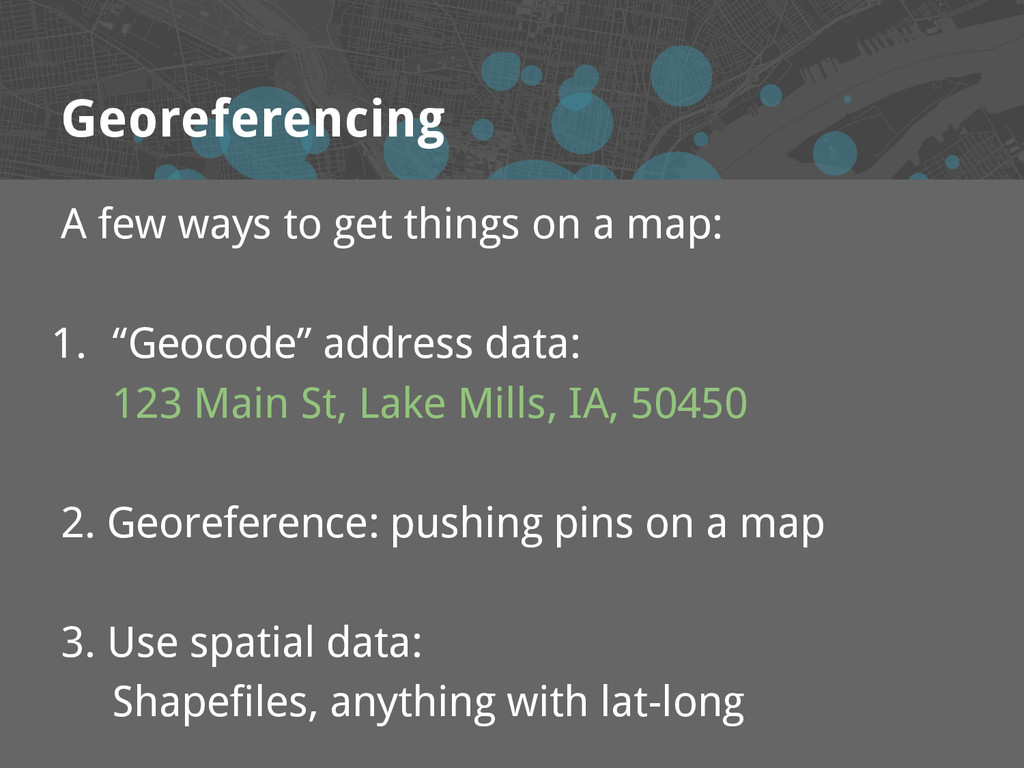
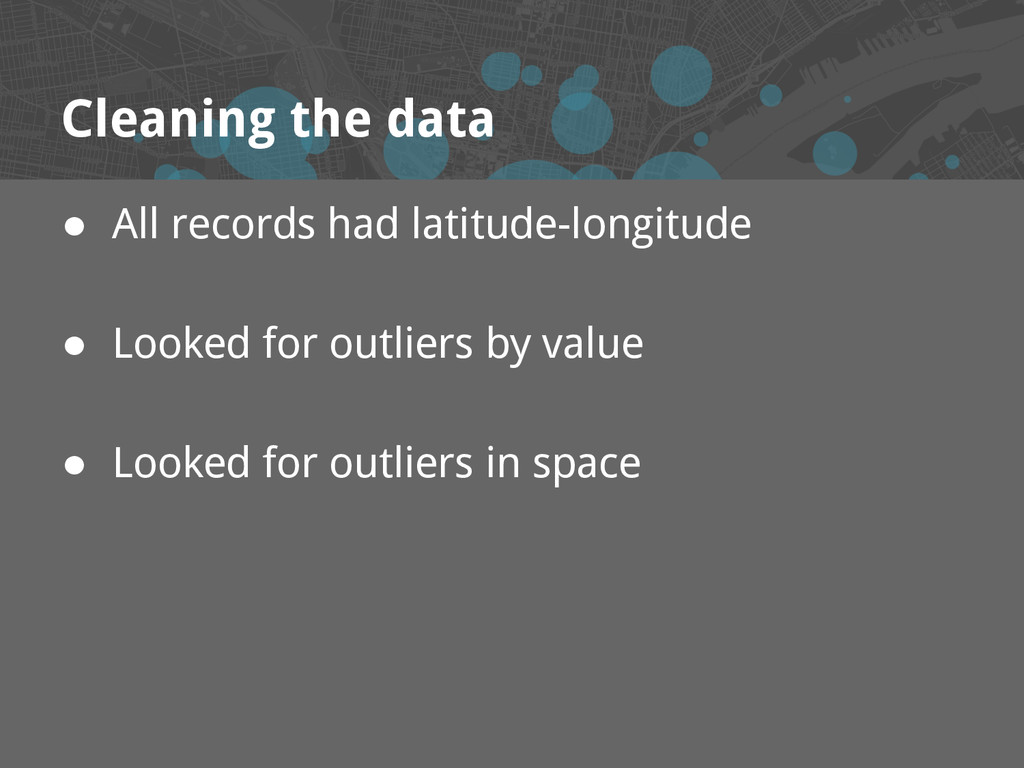
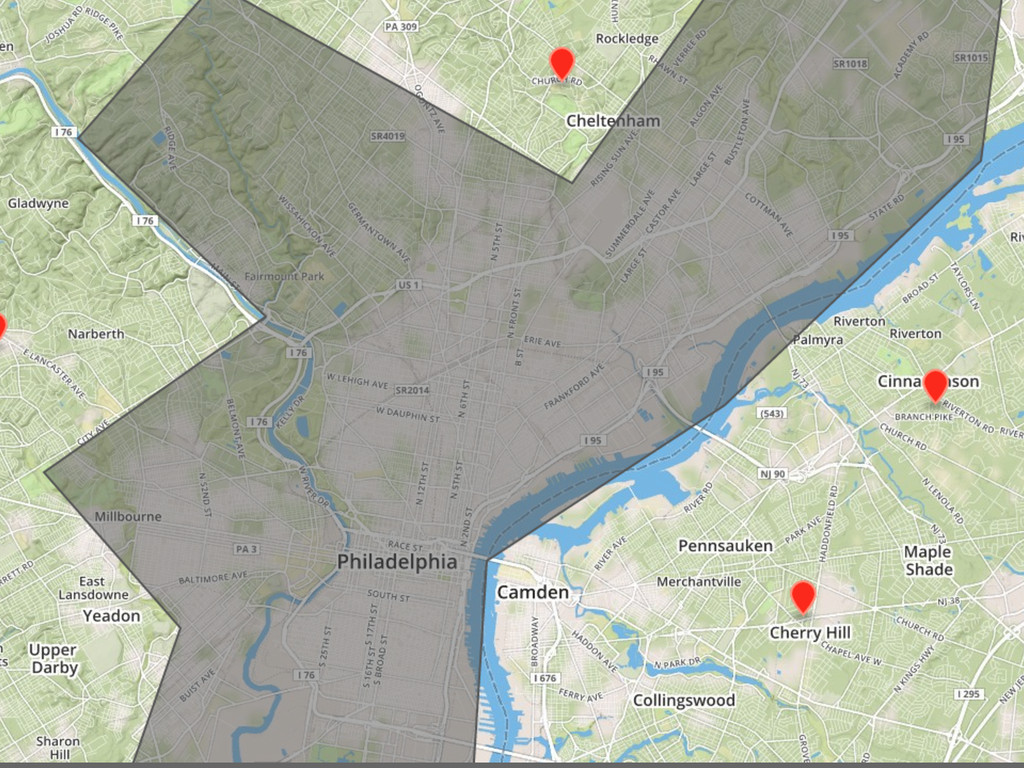
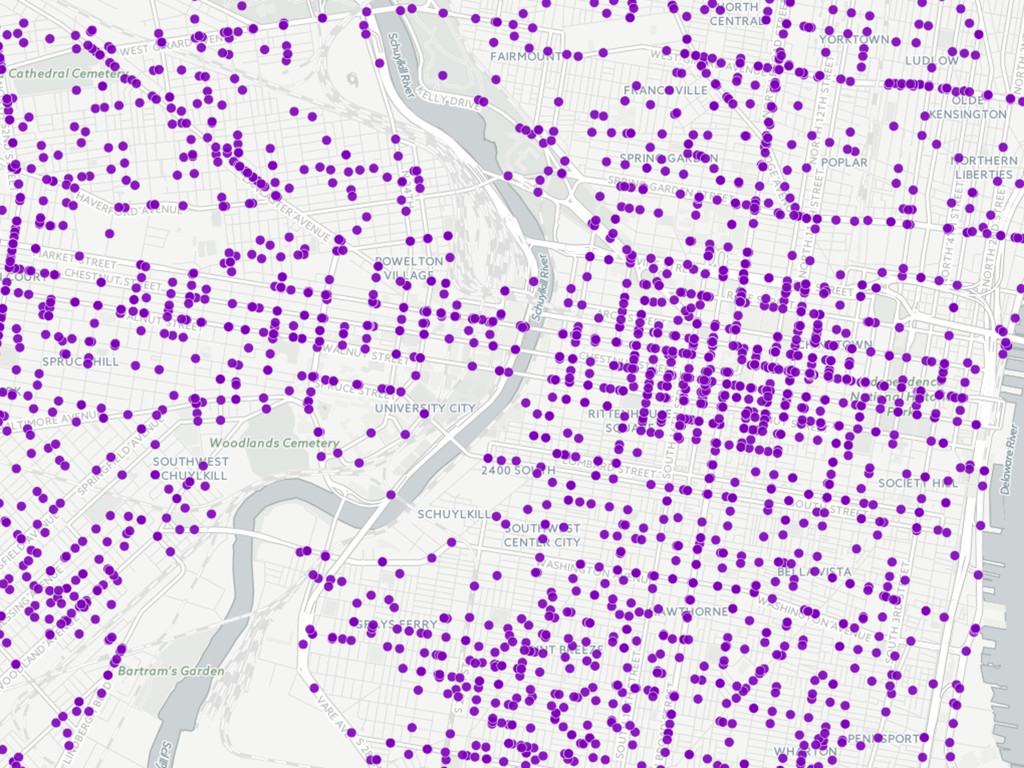
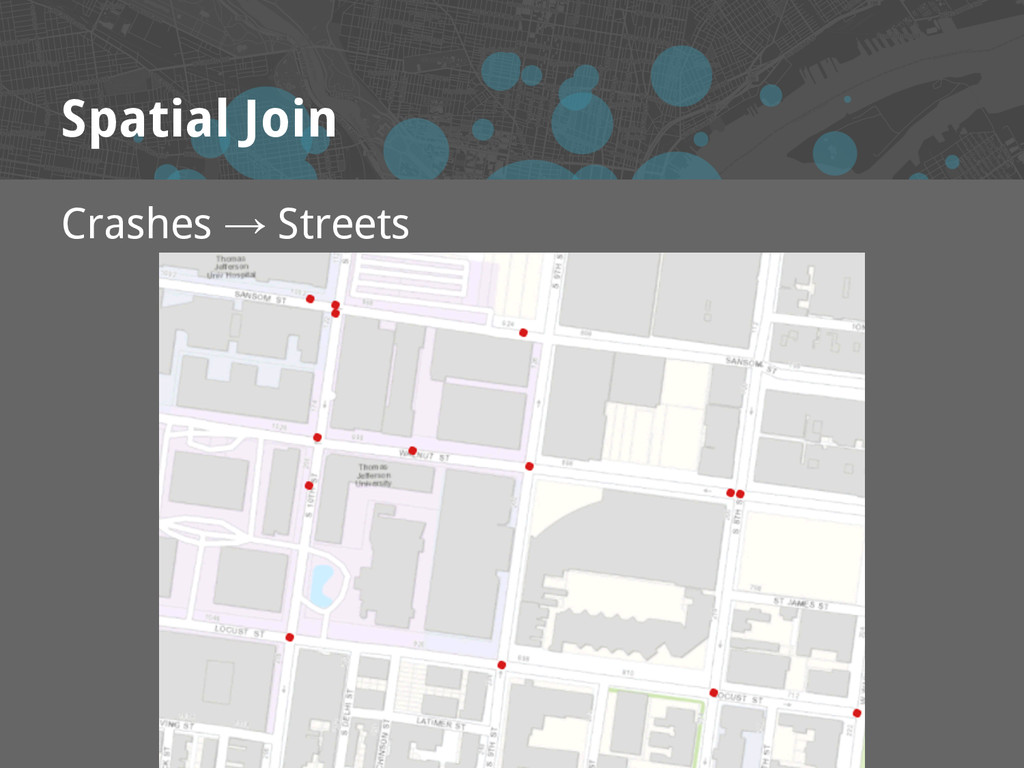
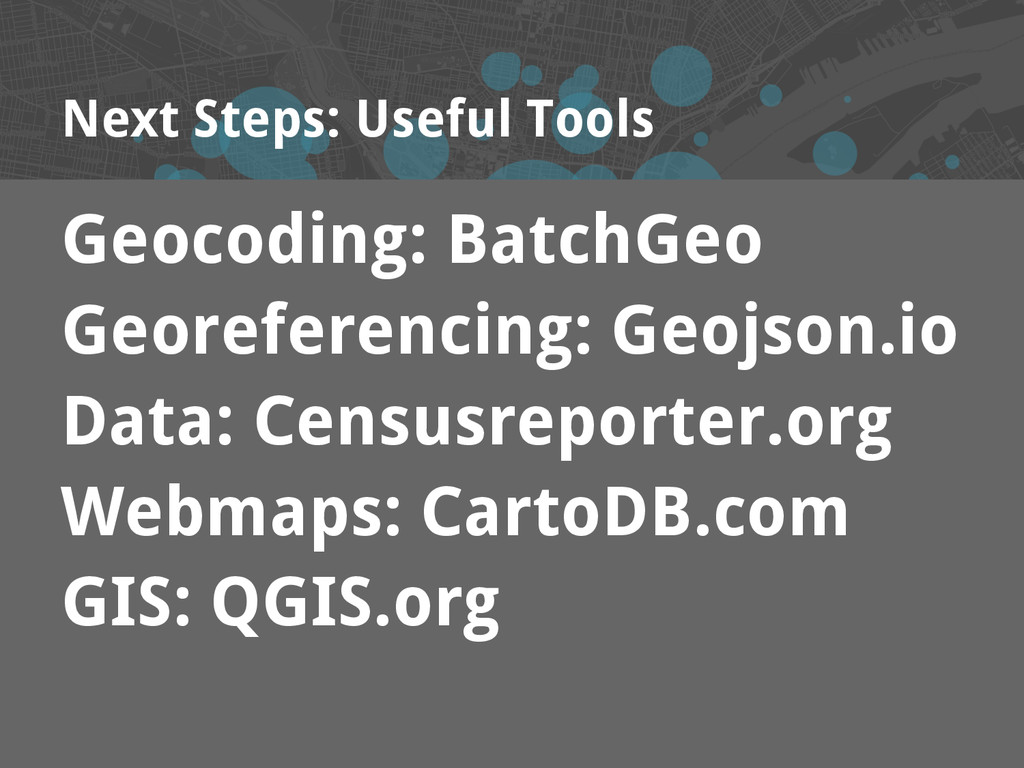
1. “Geocode” address data: 123 Main St, Lake Mills, IA, 50450 2. Georeference: pushing pins on a map 3. Use spatial data: Shapefiles, anything with lat-long
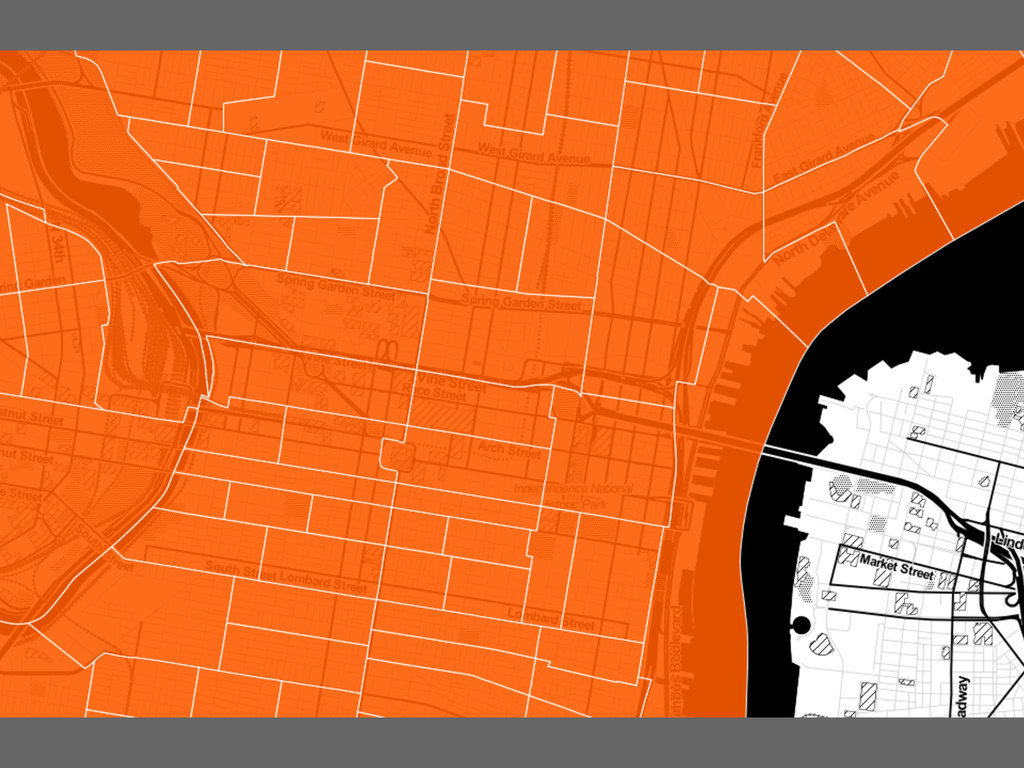
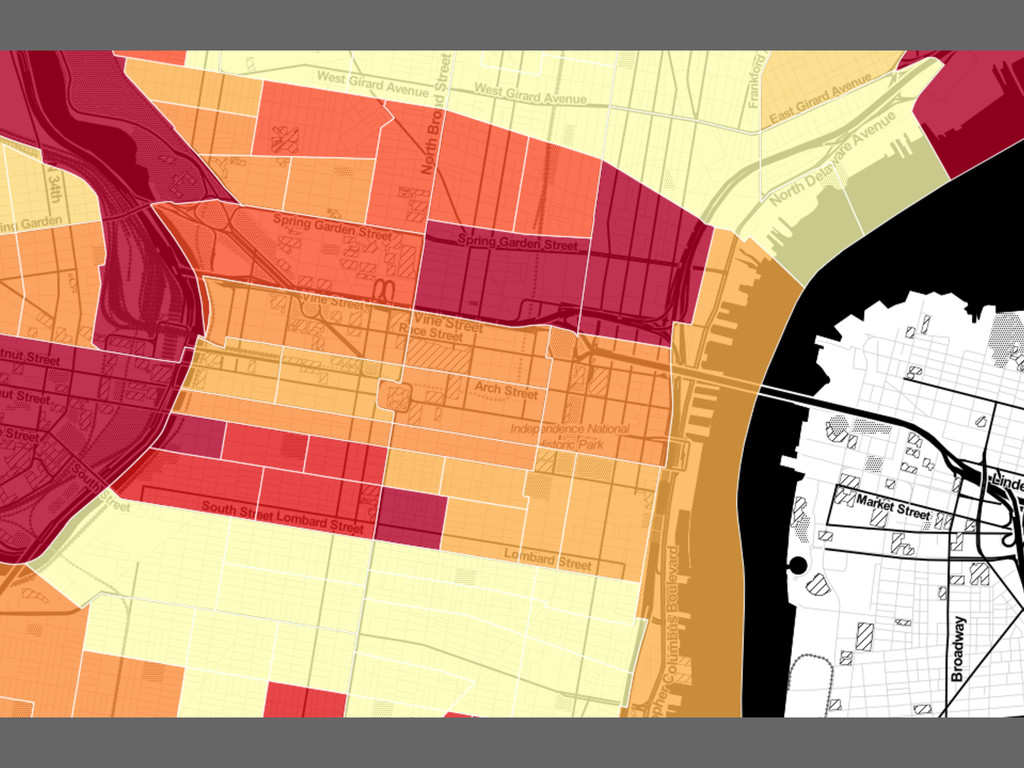
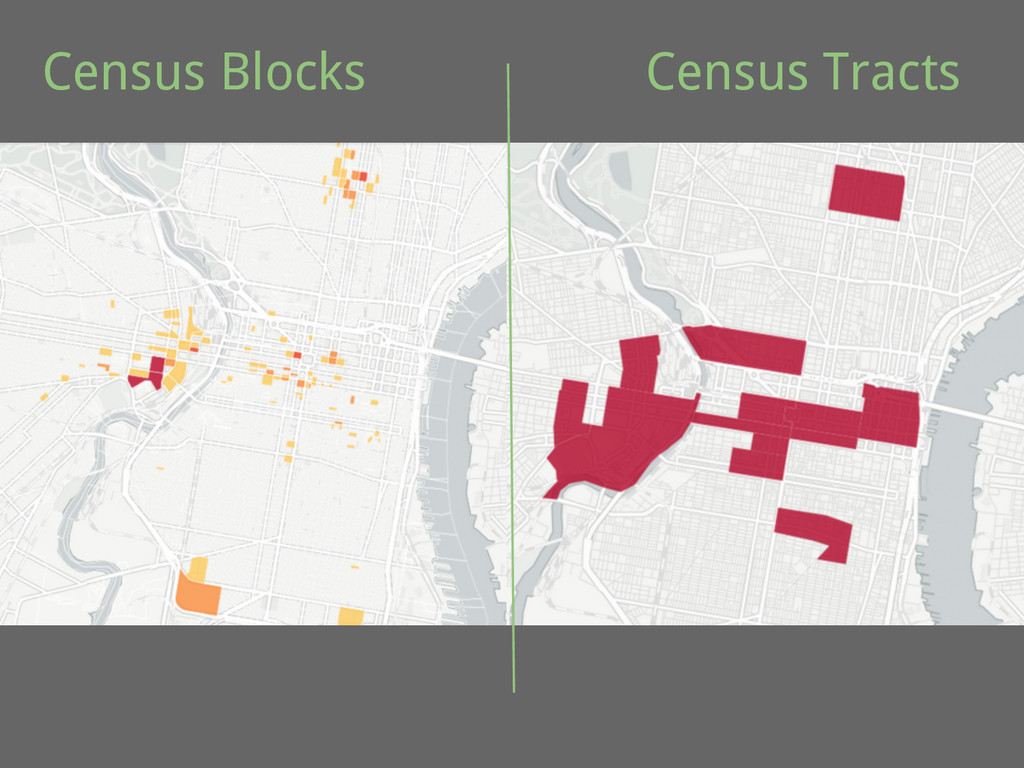
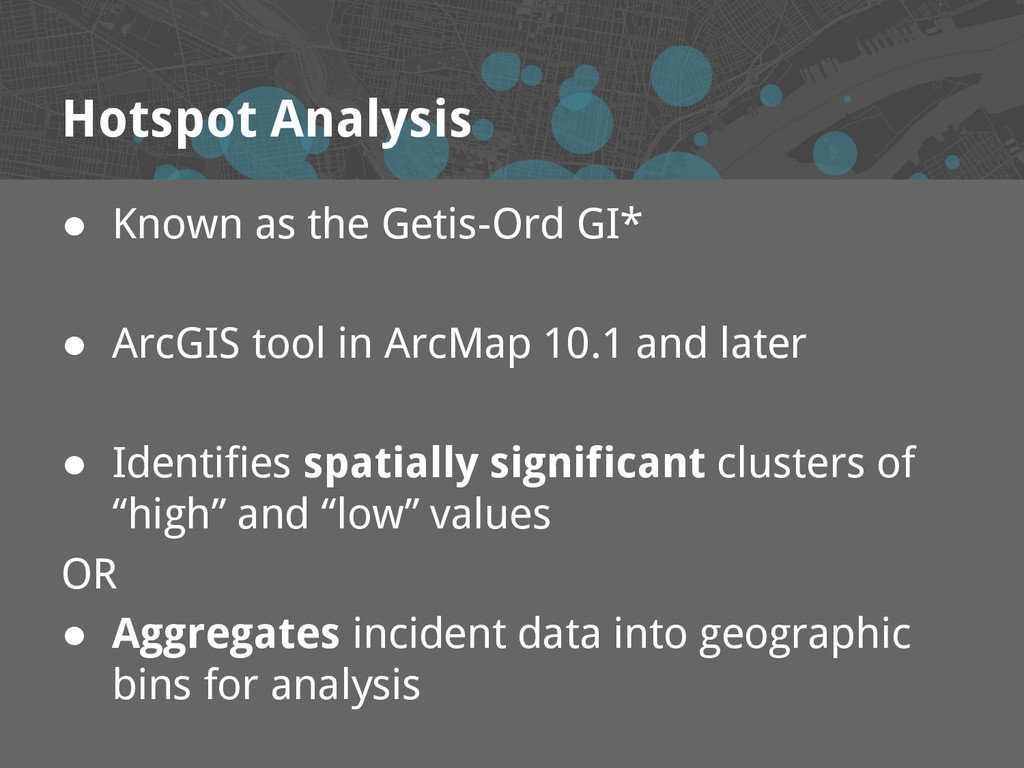
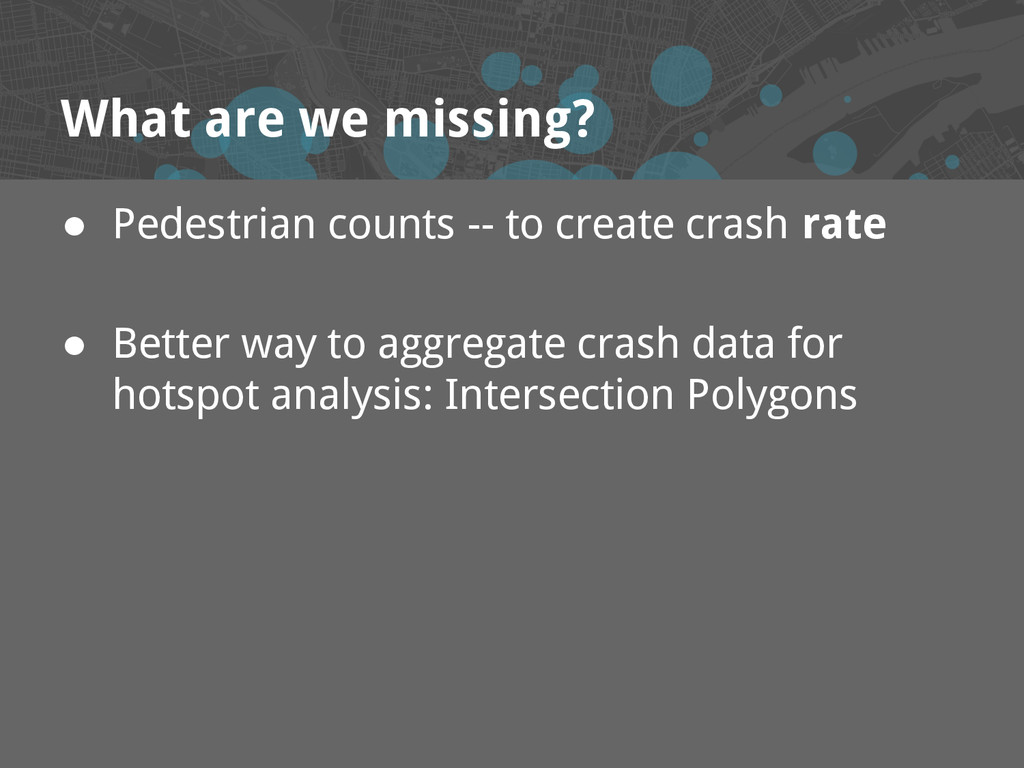
tool in ArcMap 10.1 and later • Identifies spatially significant clusters of “high” and “low” values OR • Aggregates incident data into geographic bins for analysis
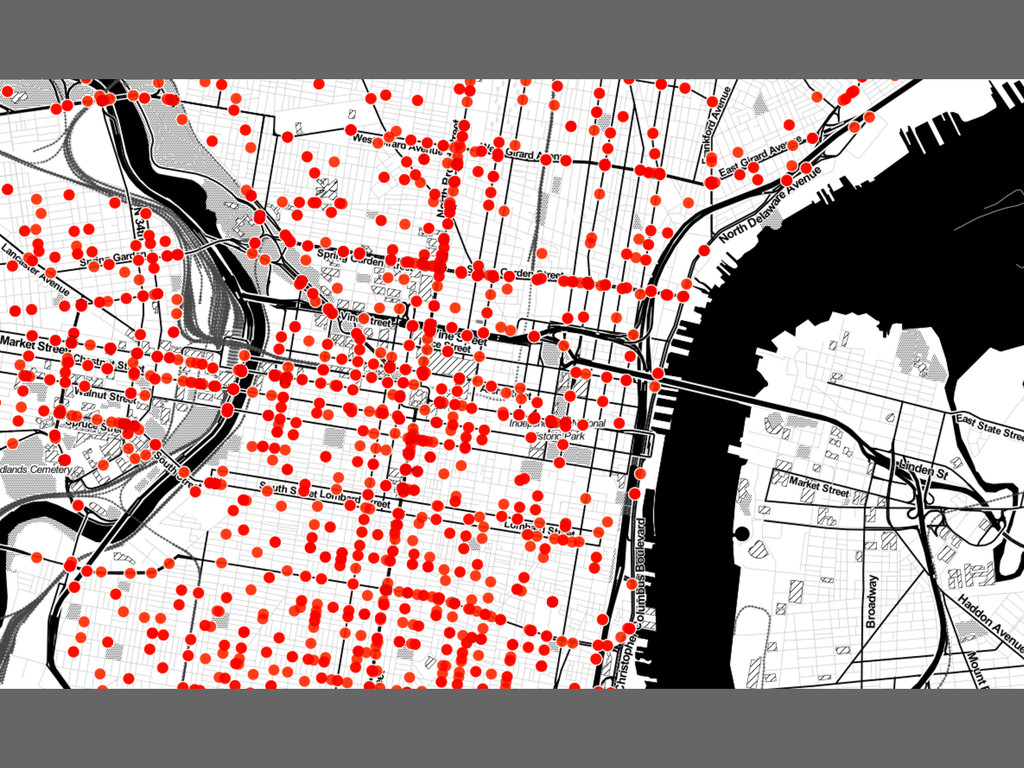
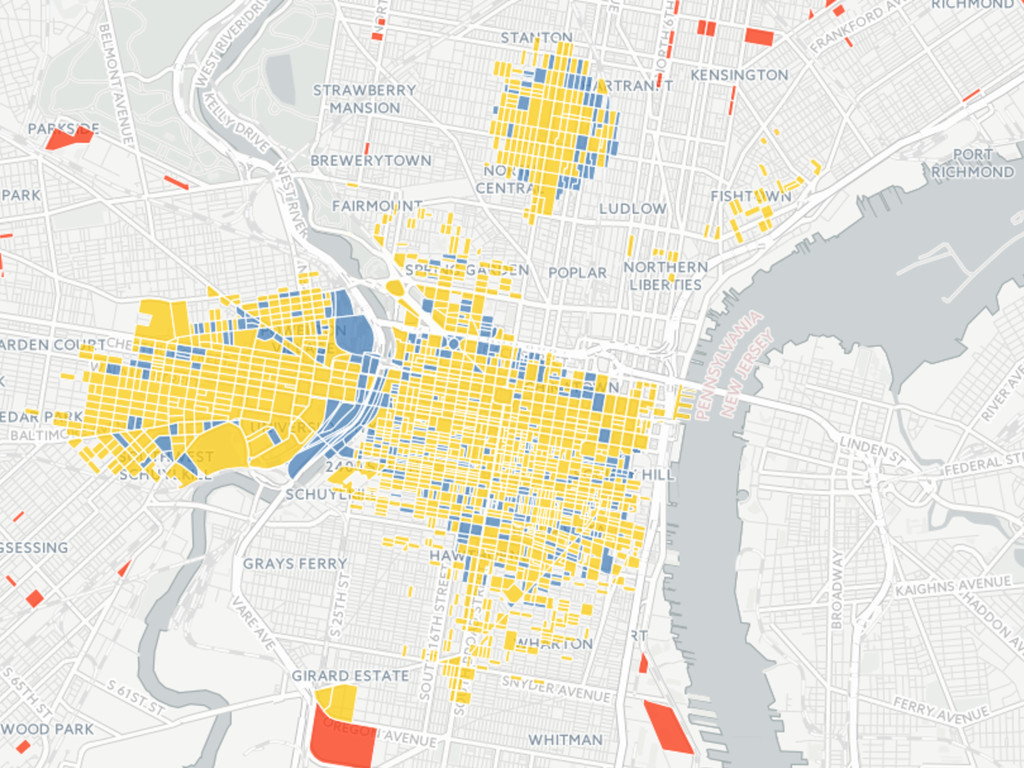
![[phila street grid]](https://files.speakerdeck.com/presentations/a278338978eb4ab1be8a4d3c3a40fe21/slide_42.jpg)