Upgrade to Pro
— share decks privately, control downloads, hide ads and more …
Speaker Deck
Features
Speaker Deck
PRO
Sign in
Sign up for free
Search
Search
Drexel GIS User Group Presentation
Search
Sponsored
·
Your Podcast. Everywhere. Effortlessly.
Share. Educate. Inspire. Entertain. You do you. We'll handle the rest.
→
Tyler Dahlberg
February 26, 2016
Education
46
1
Share
Drexel GIS User Group Presentation
Presentation with Links! LINKS!
Tyler Dahlberg
February 26, 2016
More Decks by Tyler Dahlberg
See All by Tyler Dahlberg
Azavea - Do Good Data 2015
geotyler
0
120
Azavea KDMC Charlotte: Mapping Insights You Never Even Knew You Had
geotyler
1
89
Other Decks in Education
See All in Education
「機械学習と因果推論」入門 ③ 漸近効率な推定量と二重機械学習
masakat0
0
650
0526
cbtlibrary
0
140
We部コミュニティスライド2026-04-24
junhat6
0
170
Measuring what matters
jonoalderson
0
380
AI進化史:LLMからAIエージェントへ
mickey_kubo
0
180
The Lotus and the Frog
vyadav
0
100
2026年度春学期 統計学 第4回 データを「分布」で見る (2026. 4. 30)
akiraasano
PRO
0
130
プロポーザルを書く技術とアンチパターン/proposal-writing-and-antipatterns
moriyuya
13
3.3k
【セーフィー】テクニカルライティング&コミュニケーション実践講座(26新卒エンジニア向け研修資料)
ymzaki_m4
0
190
Populism, Post-Liberalism & Climate Change
vyadav
0
170
SARA Annual Report 2025-26
sara2023
1
350
生成AIを授業の相棒にするデータサイエンス入門(「デジタル✕探究」イノベーターズフォーラム テクニカルセッション講演資料)
datascientistsociety
PRO
0
270
Featured
See All Featured
SEO in 2025: How to Prepare for the Future of Search
ipullrank
3
3.5k
svc-hook: hooking system calls on ARM64 by binary rewriting
retrage
2
280
Templates, Plugins, & Blocks: Oh My! Creating the theme that thinks of everything
marktimemedia
31
2.8k
Leveraging LLMs for student feedback in introductory data science courses - posit::conf(2025)
minecr
1
270
Paper Plane (Part 1)
katiecoart
PRO
0
8.4k
End of SEO as We Know It (SMX Advanced Version)
ipullrank
3
4.2k
Building a Scalable Design System with Sketch
lauravandoore
463
34k
Exploring anti-patterns in Rails
aemeredith
3
390
Distributed Sagas: A Protocol for Coordinating Microservices
caitiem20
333
22k
Unlocking the hidden potential of vector embeddings in international SEO
frankvandijk
0
830
ピンチをチャンスに:未来をつくるプロダクトロードマップ #pmconf2020
aki_iinuma
128
55k
職位にかかわらず全員がリーダーシップを発揮するチーム作り / Building a team where everyone can demonstrate leadership regardless of position
madoxten
62
54k
Transcript
Maps in a Snap: hyperlink
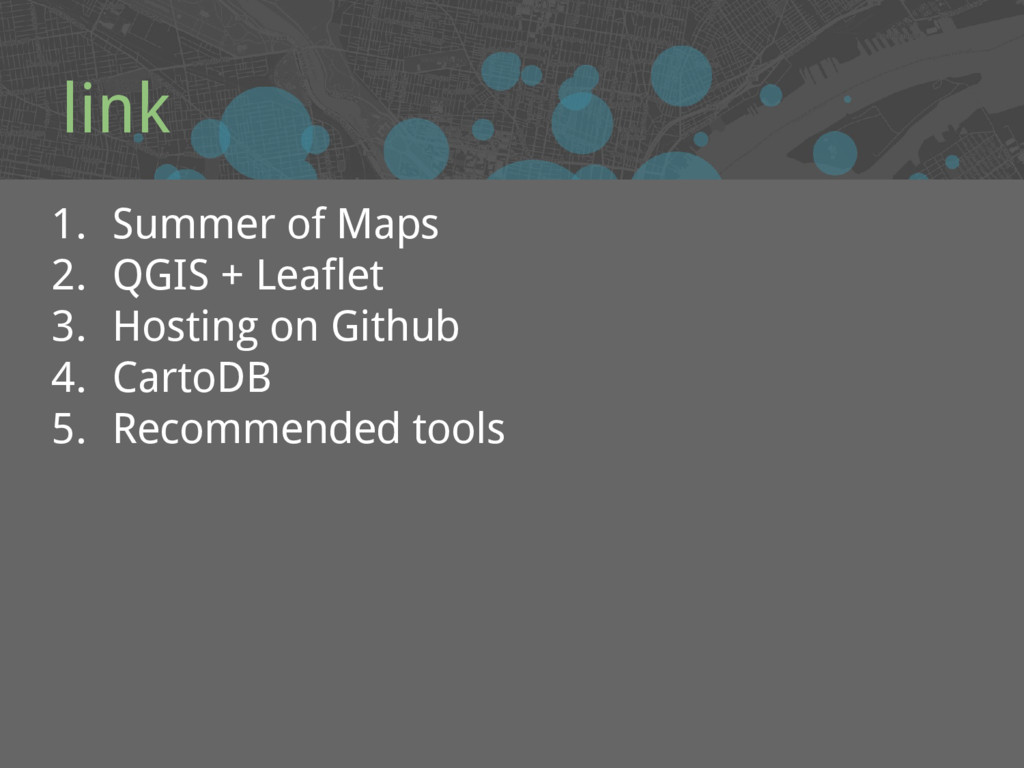
link 1. Summer of Maps 2. QGIS + Leaflet 3.
Hosting on Github 4. CartoDB 5. Recommended tools
Civic Software, Data Analytics & Research
B Corporation • Civic / Social Apps • Pro Bono
Program • Donate share of profits Research-Driven • 10% Academic Research Program • Academic Collaborators • Open Source • Open Data
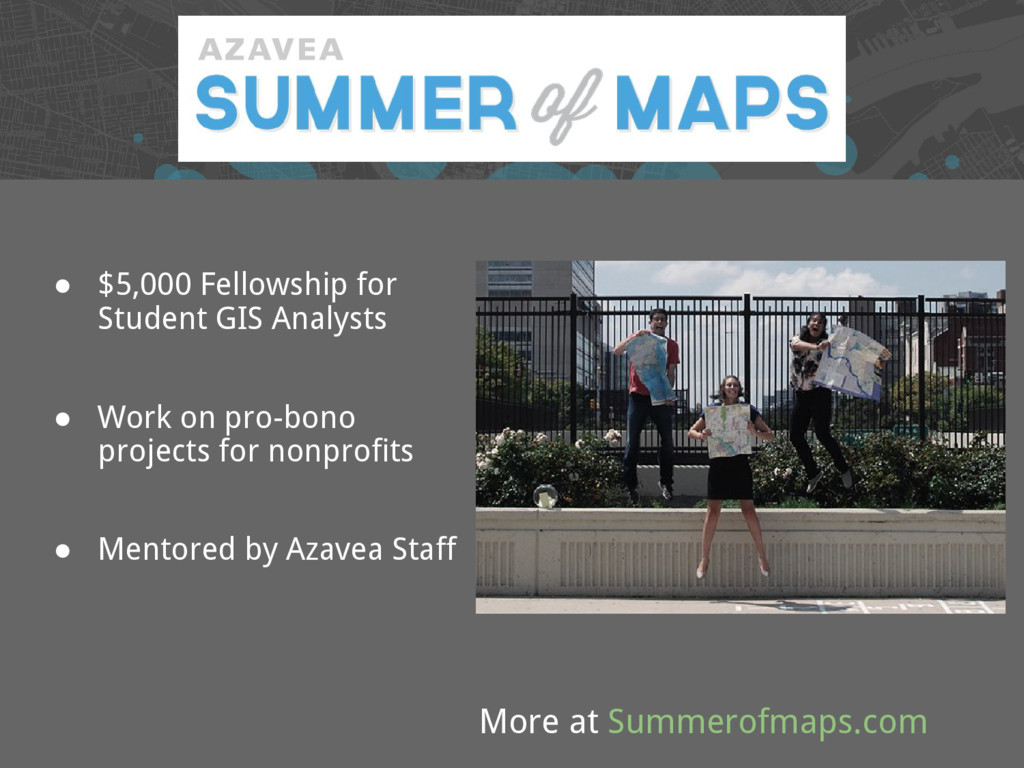
More at Summerofmaps.com • $5,000 Fellowship for Student GIS Analysts
• Work on pro-bono projects for nonprofits • Mentored by Azavea Staff
QGIS • Open source desktop GIS • Faster than ArcGIS
for basics • Not as easy to make nice maps • Plugins = A ++ super handy • Demo & Presentation Link
Getting Data • Maybe start with OpenDataPhilly.org • Scrape with
import.io ◦ Example Page: http://www.averageheight. co/average-male-height-by-country • Avoid Fact Finder with CensusReporter
CartoDB • Built on open-source tech • Very generous free
accounts • Uses PostGIS + CartoCSS (so you can analyze & customize) • Powerful sharing features
Next Steps http://www.maptime.io/
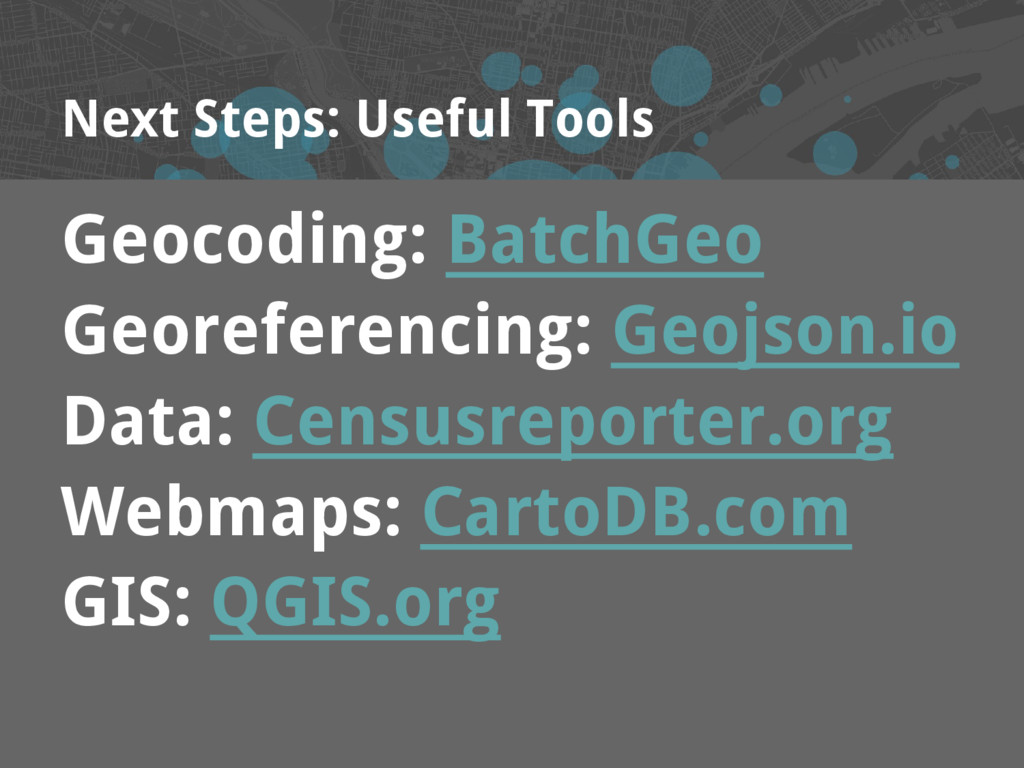
Next Steps: Useful Tools Geocoding: BatchGeo Georeferencing: Geojson.io Data: Censusreporter.org
Webmaps: CartoDB.com GIS: QGIS.org
Thanks for listening! @geotyler @azavea link analytics.azavea.com