Upgrade to Pro — share decks privately, control downloads, hide ads and more …

OpenTelemetry on Android: From black box to X‑Ray

OpenTelemetry on Android: From black box to X‑Ray

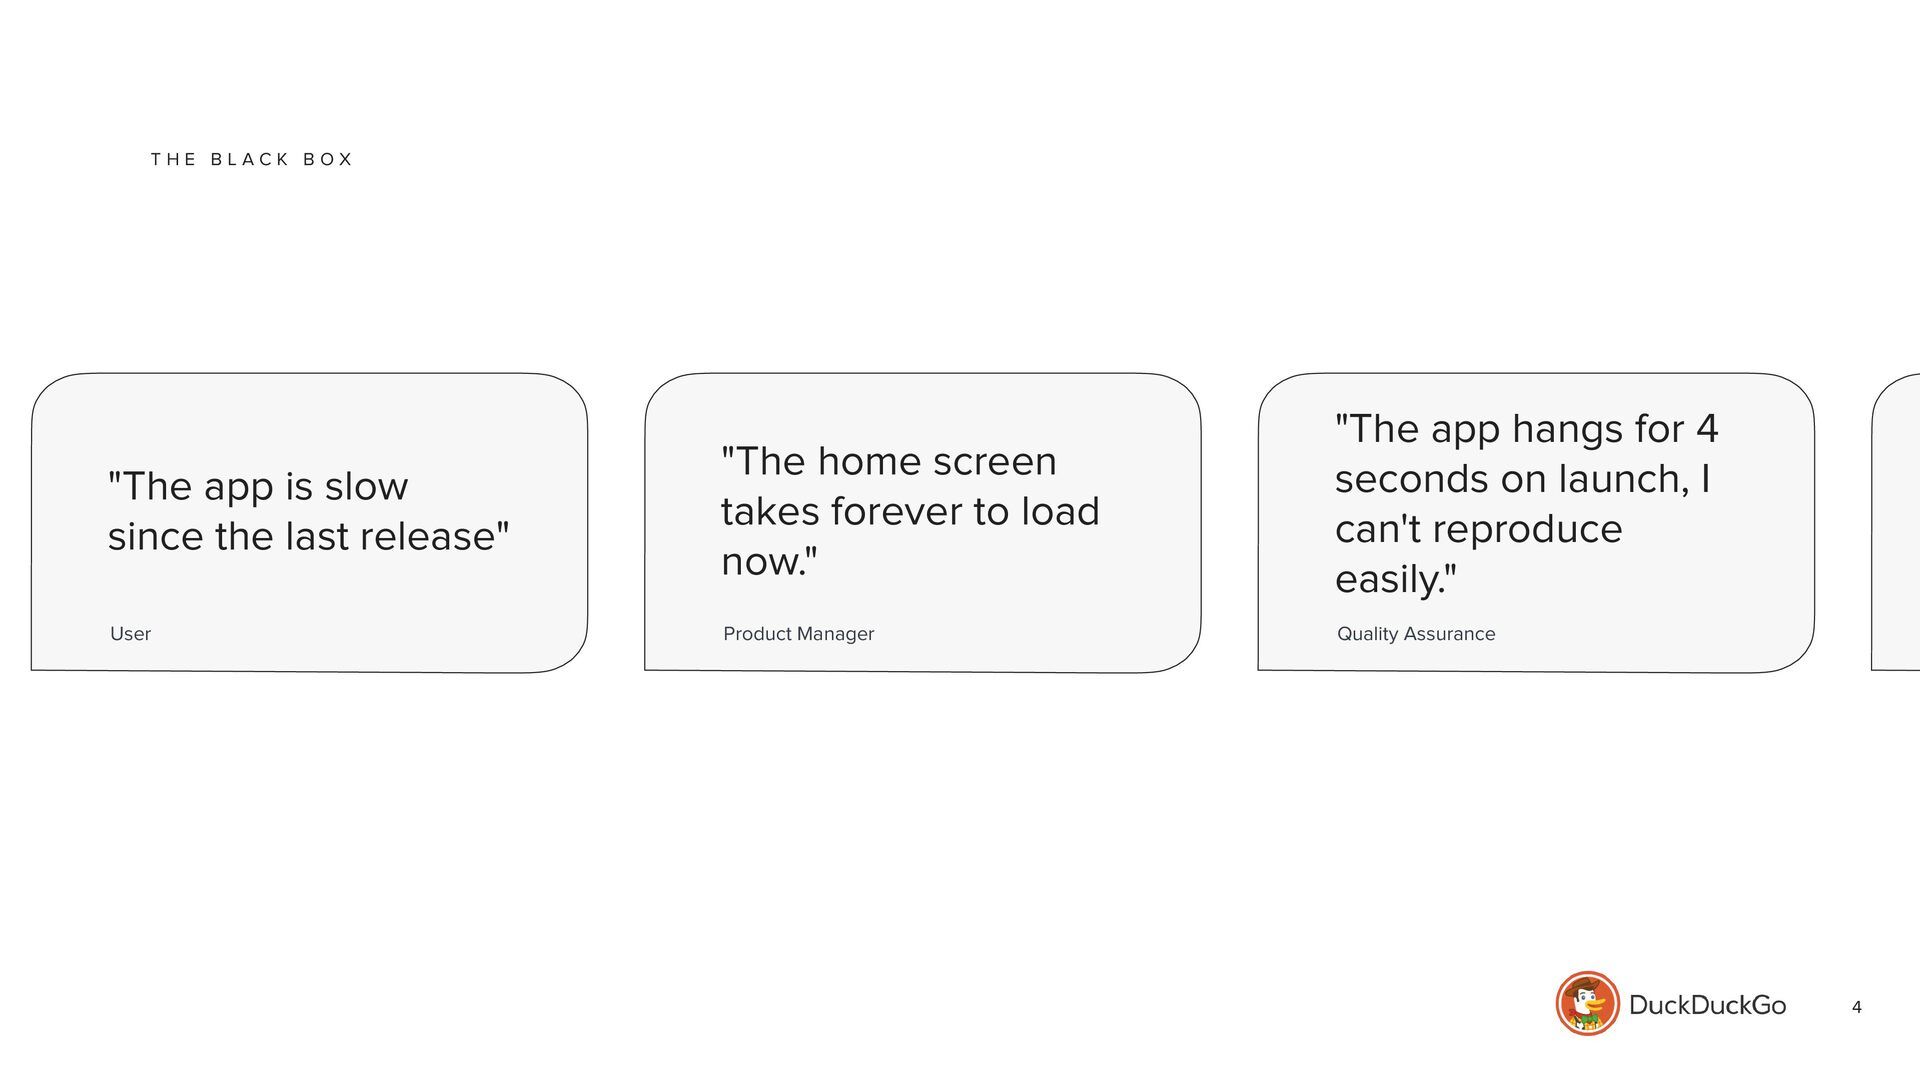
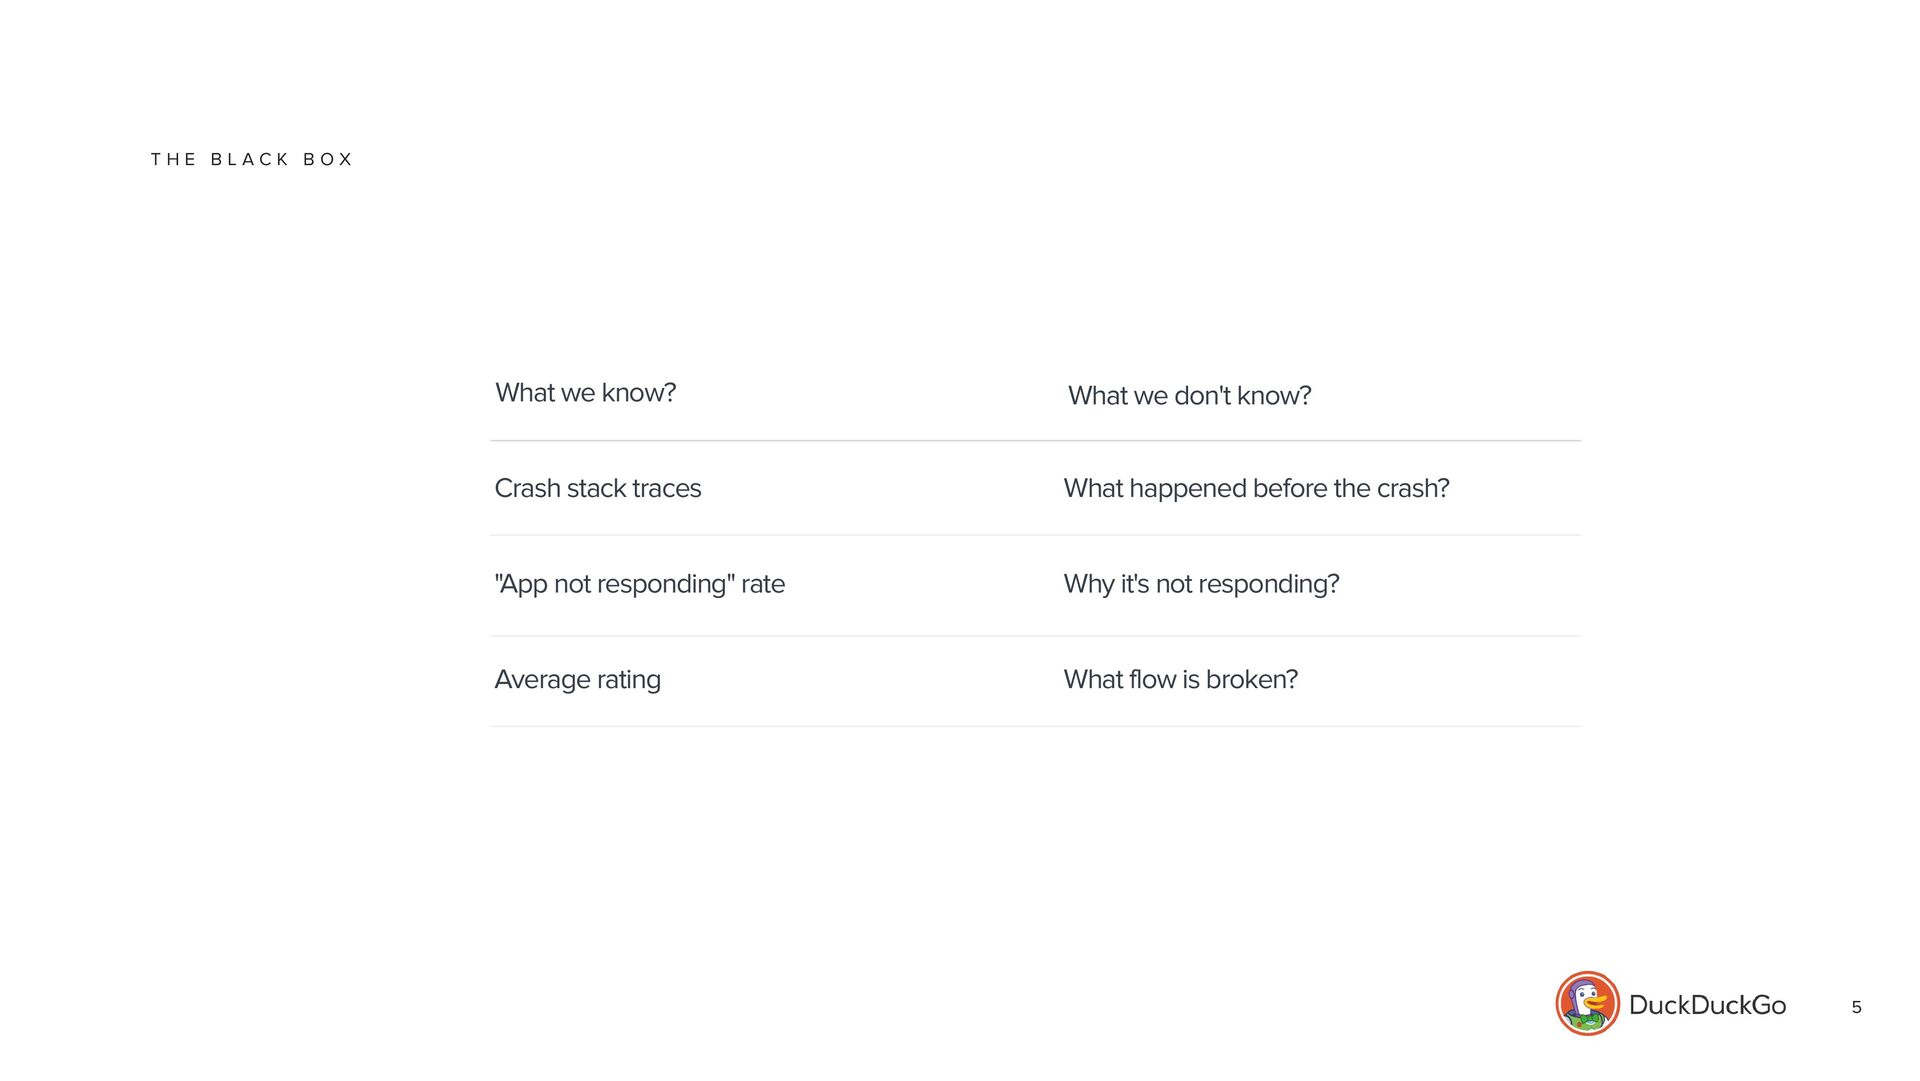
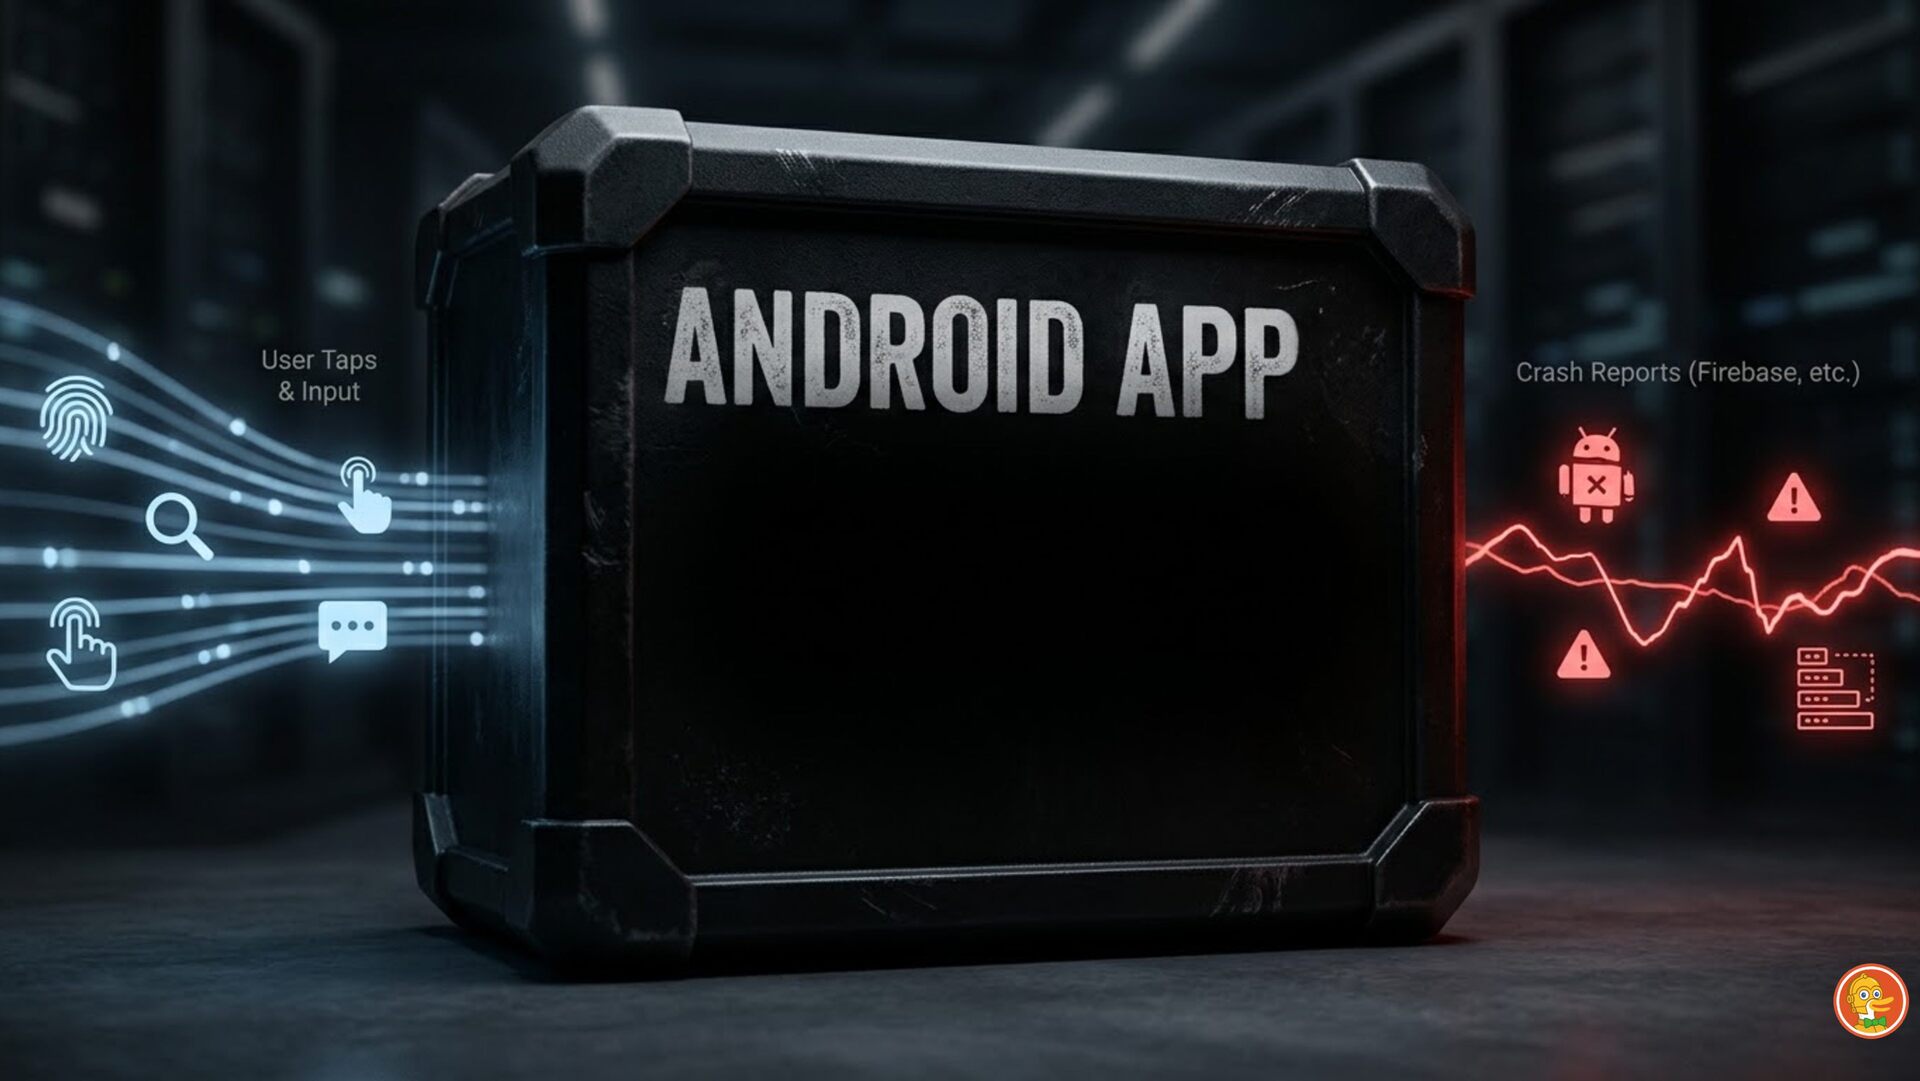
On the backend, OpenTelemetry is quickly becoming the default for observability but on Android, it’s still uncommon to see something else than Firebase or any vendor-locked solution. Many teams don’t know where to start or whether it’s “ready” for mobile use. The result: a production app that behaves like a black box, with only crash reports and a few logs to rely on when things go wrong.

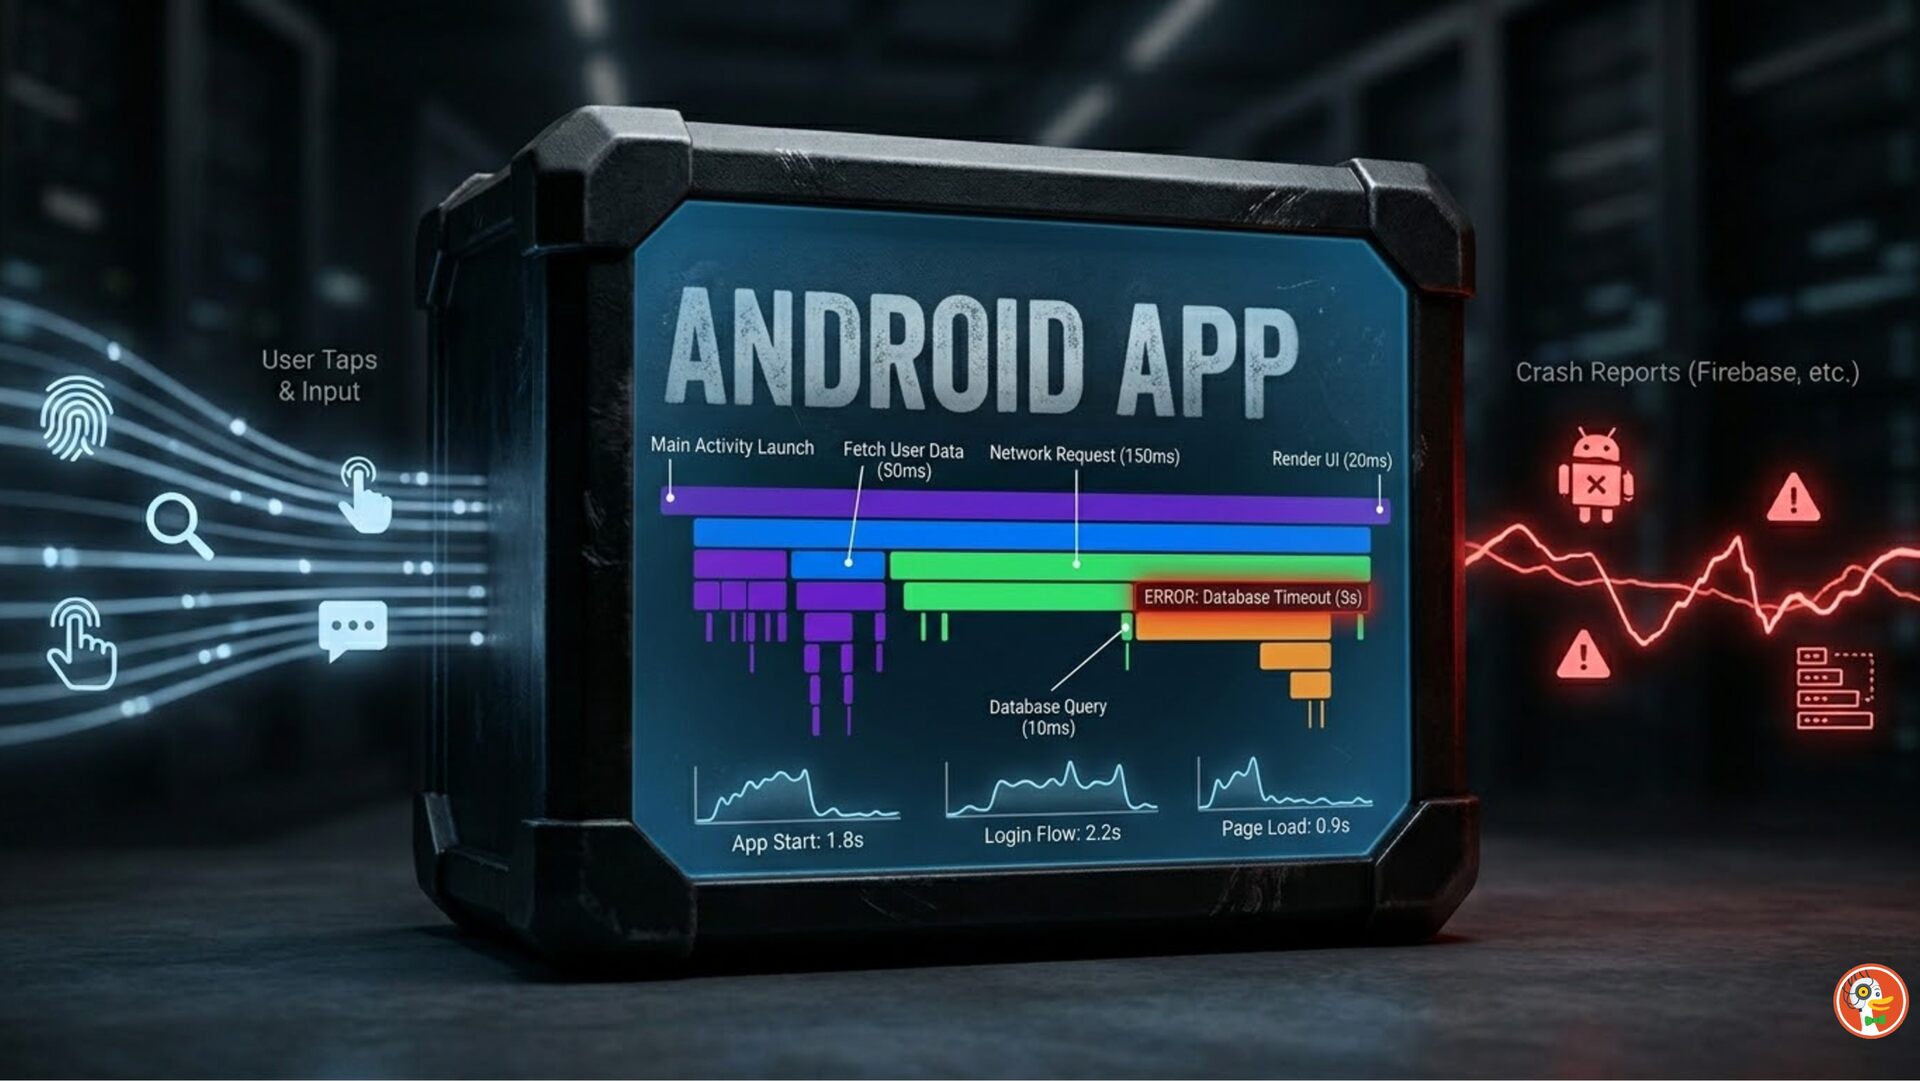
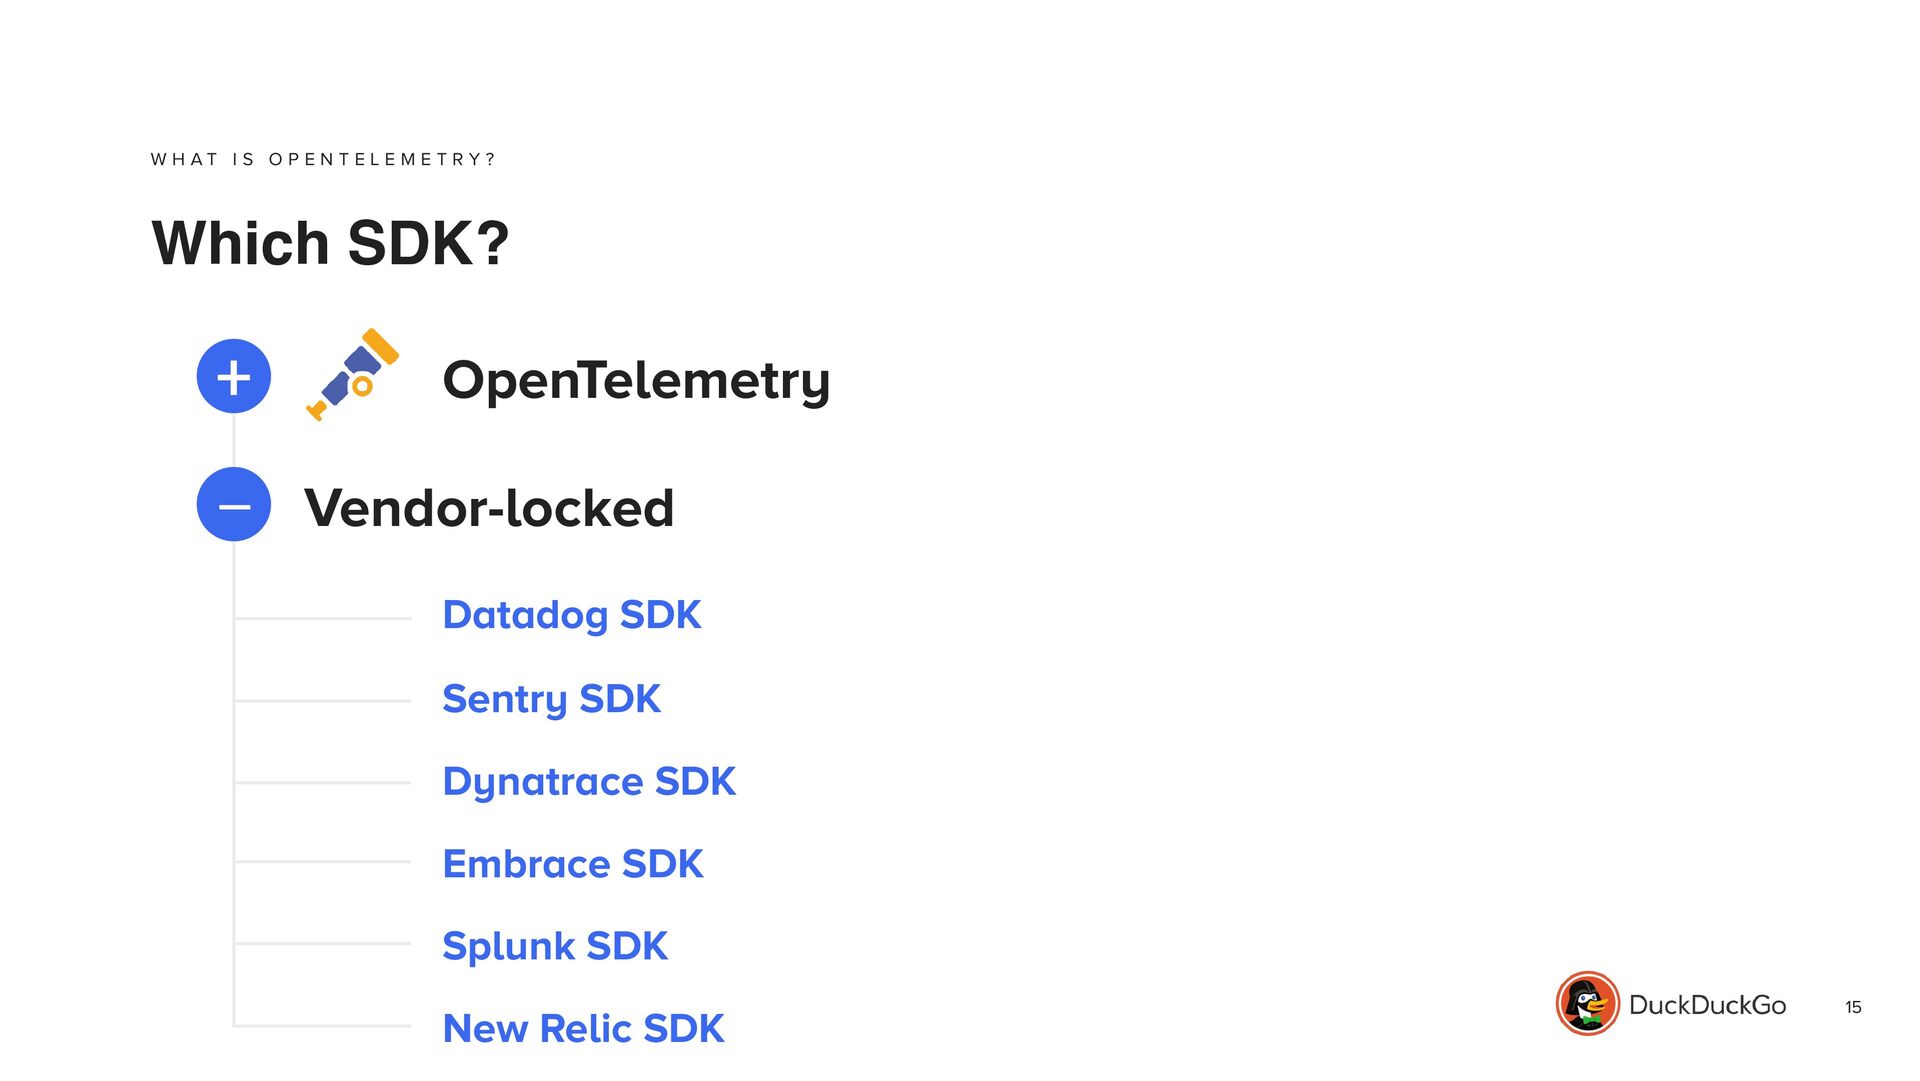
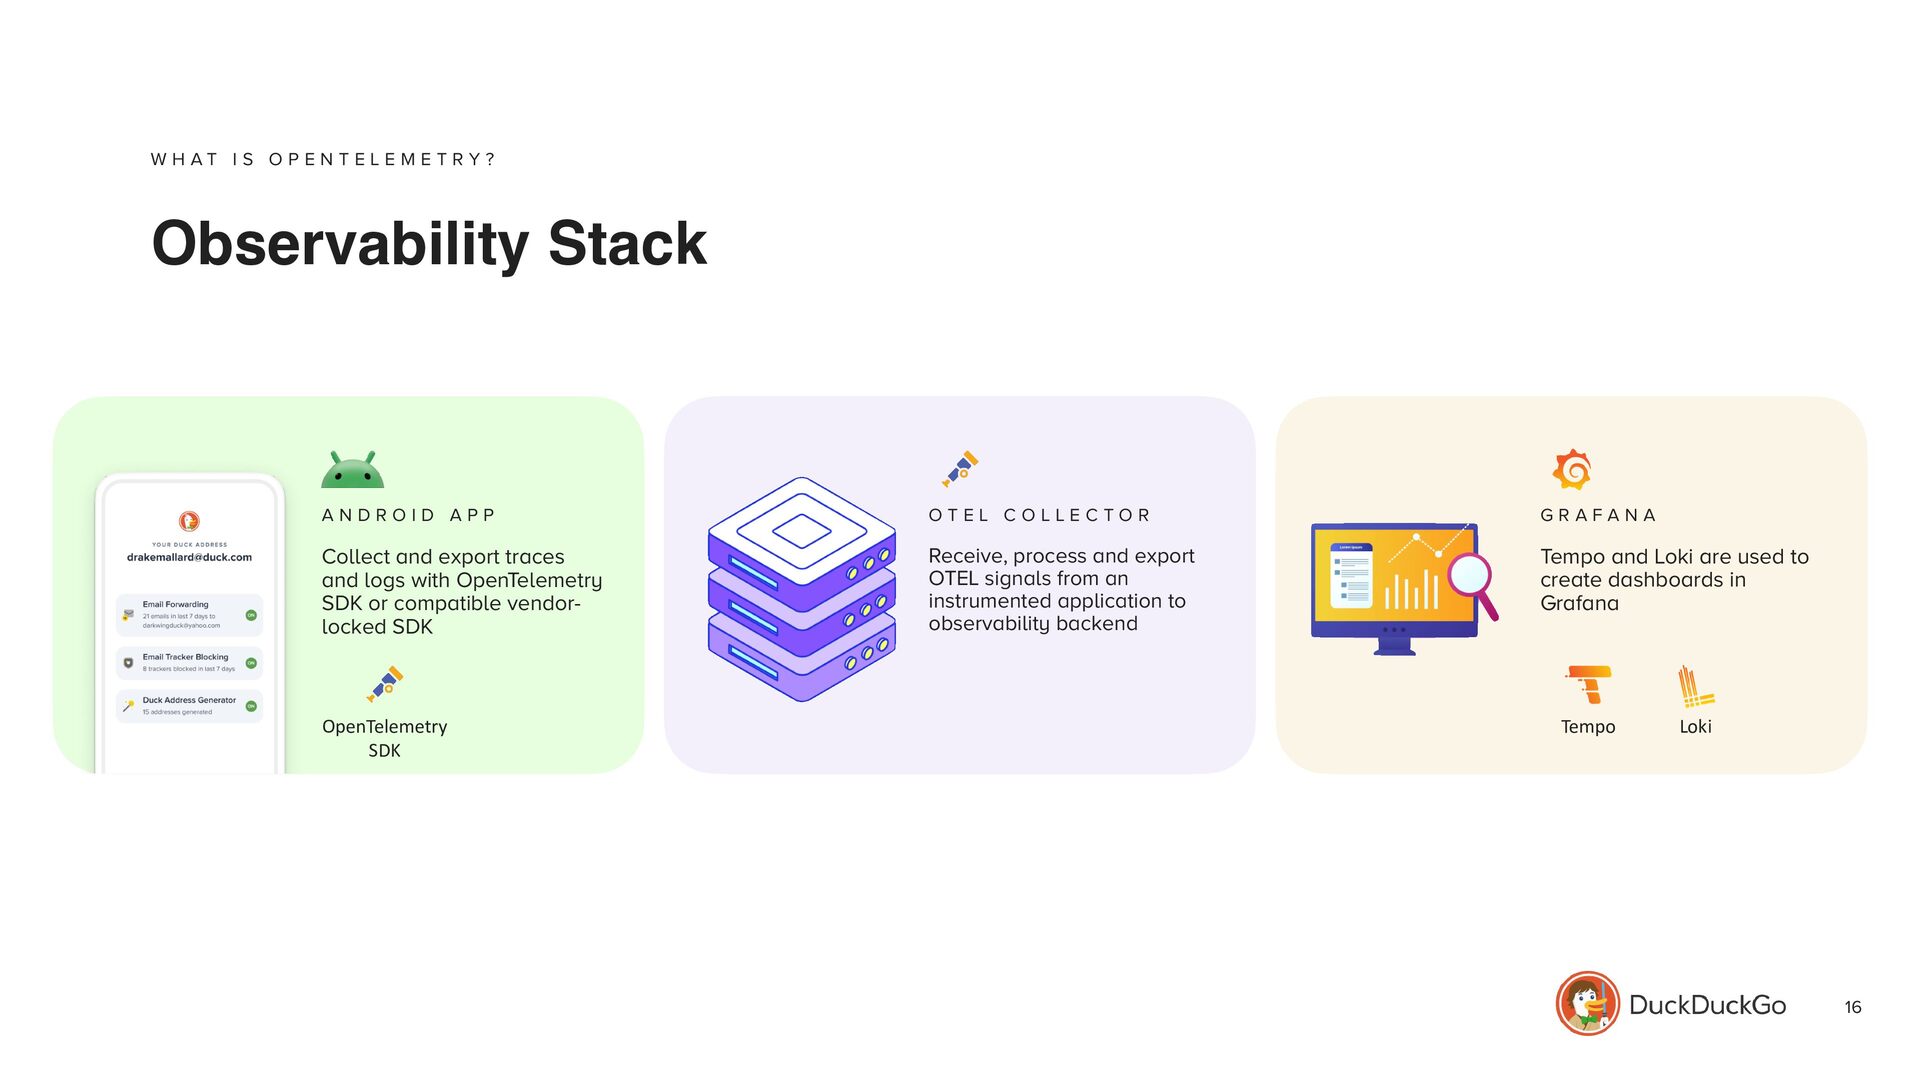
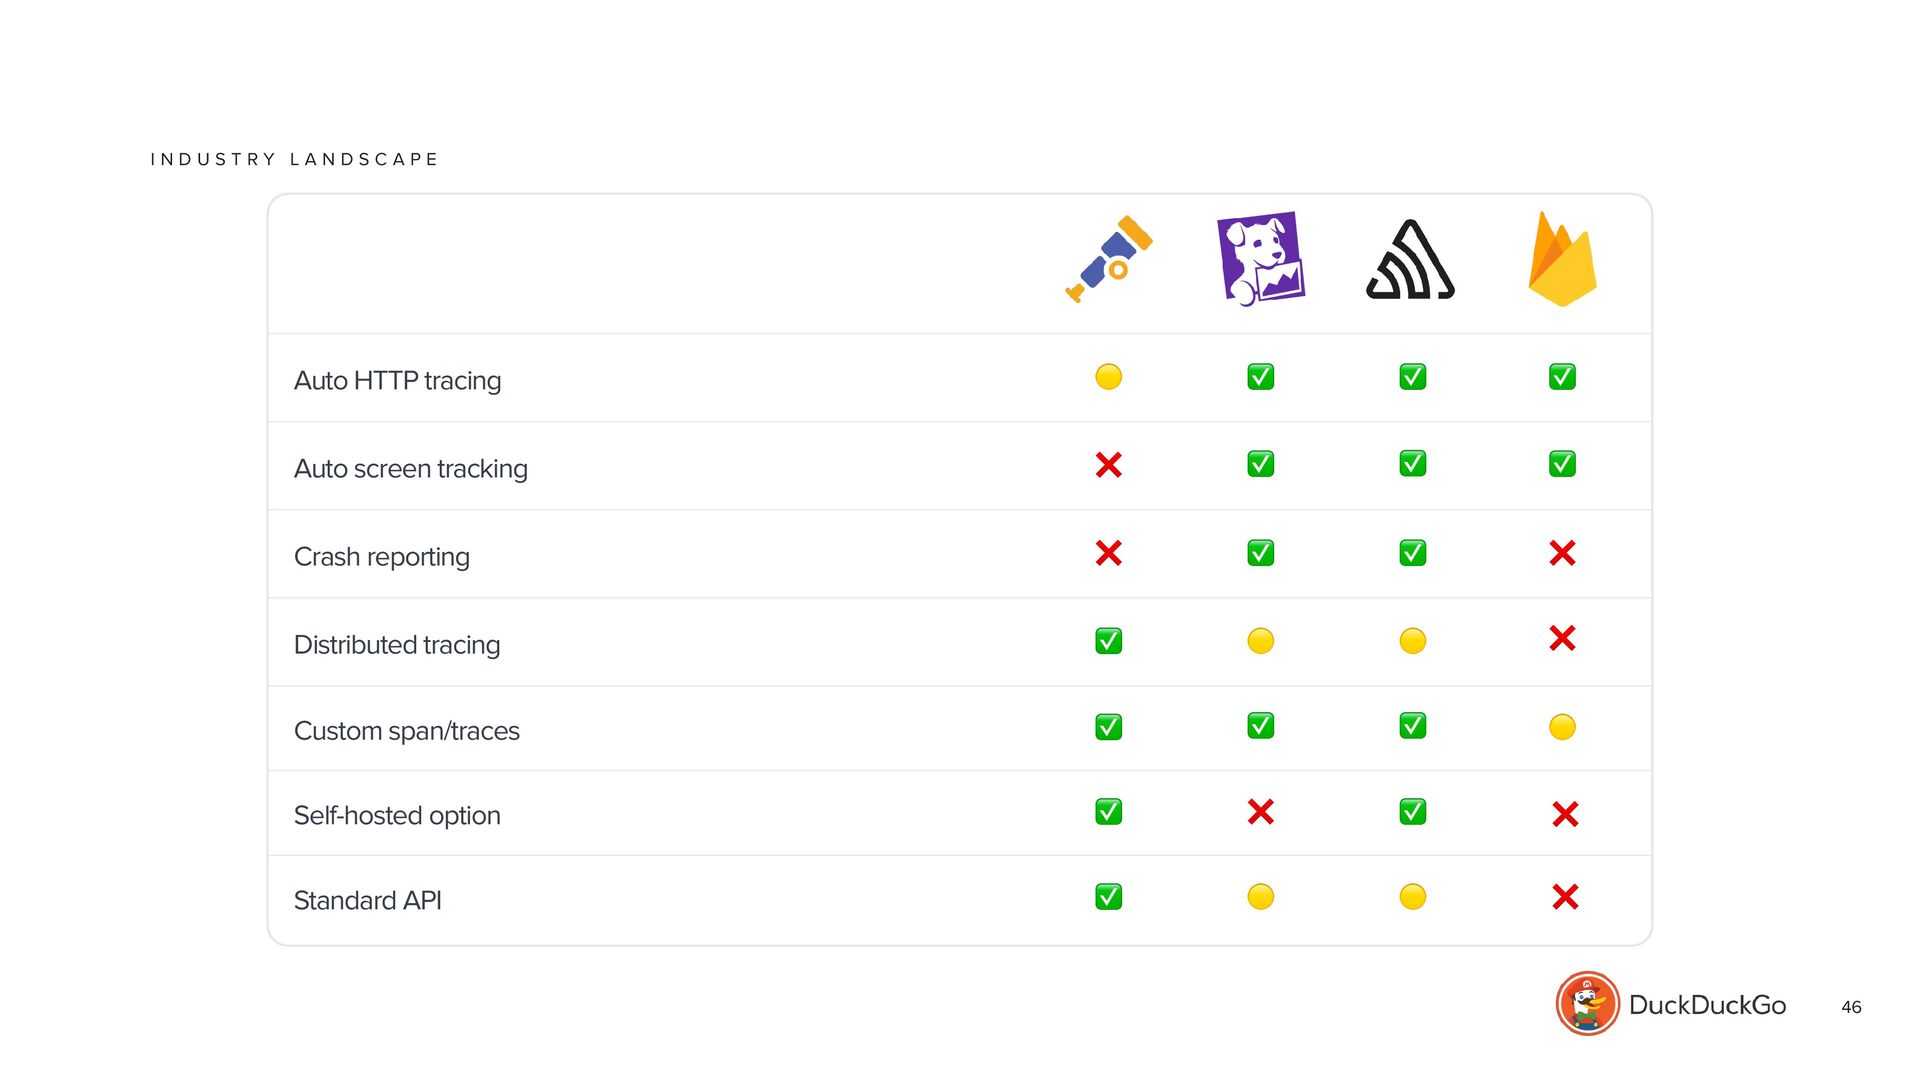
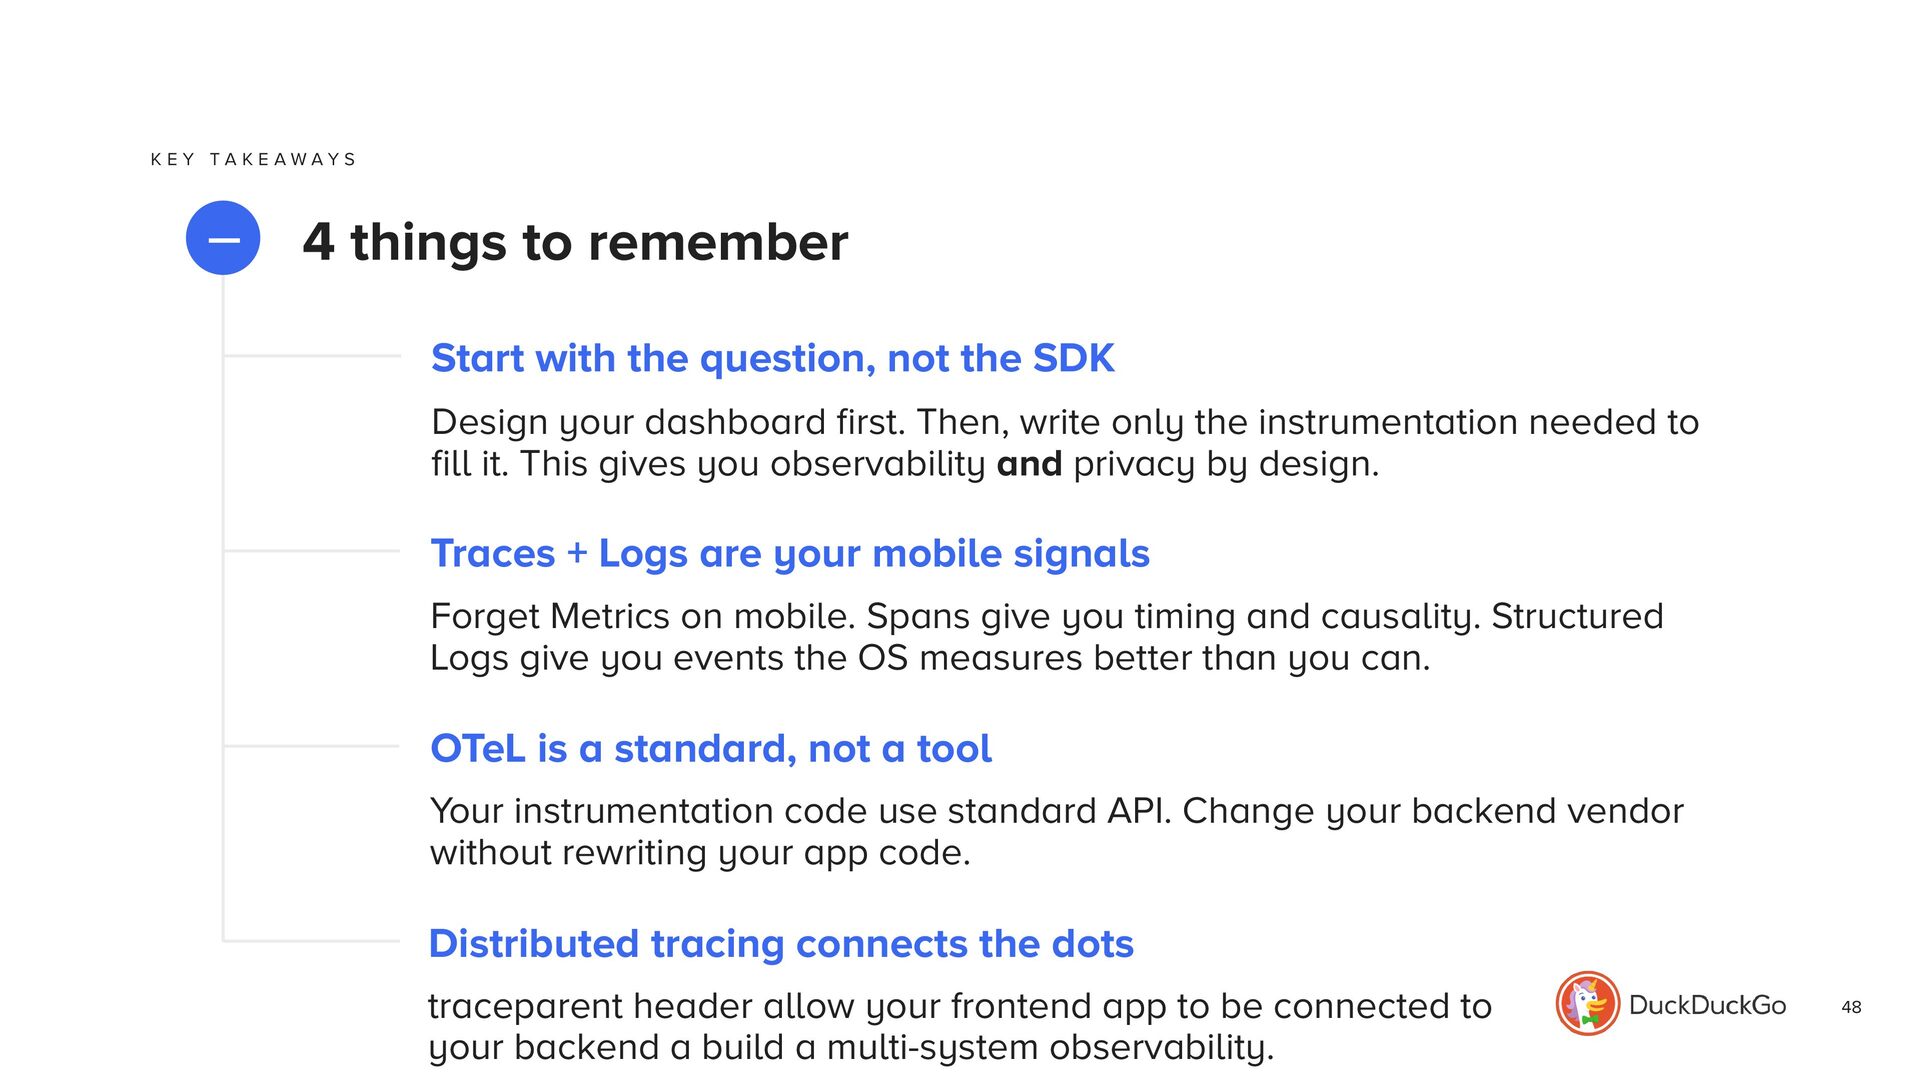
In this talk, we’ll turn a typical Android app into an “X‑ray friendly” client using OpenTelemetry. We’ll explore the available OpenTelemetry SDKs, wire them into a simple observability stack, and instrument a realistic user flow end‑to‑end. Along the way, we’ll discuss maturity of the tooling, and how it compares to popular mobile APM solutions. Attendees will learn concrete patterns and pitfalls so they can evaluate and adopt OpenTelemetry on Android with confidence.

Avatar for Gerard

Gerard

April 09, 2026

More Decks by Gerard

Other Decks in Technology

Transcript

  1. Agenda 2 1. The Black Box 2. What is OpenTelemetry?

    3. Dashboard-Driven 4. Instrumentations 5. Industry Landscape 6. Key Takeaways
  2. Agenda 3 1. The Black Box 2. What is OpenTelemetry?

    3. Dashboard-Driven 4. Instrumentations 5. Industry Landscape 6. Key Takeaways
  3. 4 T H E B L A C K B

    O X "The app is slow since the last release" User "The home screen takes forever to load now." Product Manager "The app hangs for 4 seconds on launch, I can't reproduce easily." Quality Assurance
  4. 5 Average rating "App not responding" rate Crash stack traces

    What we don't know? What we know? What flow is broken? Why it's not responding? What happened before the crash? T H E B L A C K B O X
  5. Agenda 8 1. The Black Box 2. What is OpenTelemetry?

    3. Dashboard-Driven 4. Instrumentations 5. Industry Landscape 6. Key Takeaways
  6. 9 W H A T I S O P E

    N T E L E M E T R Y ? O P E N T E L E M E T R Y OpenTelemetry is an open standard for collecting, processing, and exporting telemetry data. It's governed by the CNCF and use the W3C Trace Context for propagation. Cloud Native Computing Foundation Trace Context Propagation
  7. 10 W H A T I S O P E

    N T E L E M E T R Y ? Signals Structured events to know what happened Measure of a component in your system to provide more context but not recommended in mobile Metrics Distributed timing data to know how long and where is happening Traces Logs
  8. 11 W H A T I S O P E

    N T E L E M E T R Y ? Structured events to know what happened Measure of a component in your system to provide more context but not recommended in mobile Metrics Distributed timing data to know how long and where is happening Traces Logs Signals
  9. 12 W H A T I S O P E

    N T E L E M E T R Y ? Structured events to know what happened Measure of a component in your system to provide more context but not recommended in mobile Metrics Distributed timing data to know how long and where is happening Traces Logs Signals
  10. 13 W H A T I S O P E

    N T E L E M E T R Y ? Structured events to know what happened Distributed timing data to know how long and where is happening Traces Logs Measure of a component in your system to provide more context but not recommended in mobile Metrics Signals
  11. 14 W H A T I S O P E

    N T E L E M E T R Y ? OpenTelemetry — OpenTelemetry Java SDK One of the most historical SDK in OpenTelemetry, stable on all signals, can be used in Android applications OpenTelemetry Android SDK Created few years ago after a donation by splunk, this SDK is build in top of OpenTelemetry Java SDK but is very opinionated and is still in active development OpenTelemetry Kotlin SDK More recent SDK after a donation by embrace, this SDK provides a Kotlin Multiplatform solution to instrument your application but is still in a very alpha stage Which SDK?
  12. 15 W H A T I S O P E

    N T E L E M E T R Y ? OpenTelemetry + Vendor-locked — Datadog SDK Sentry SDK Dynatrace SDK Embrace SDK Splunk SDK New Relic SDK Which SDK?
  13. 16 W H A T I S O P E

    N T E L E M E T R Y ? Observability Stack A N D R O I D A P P OpenTelemetry SDK Collect and export traces and logs with OpenTelemetry SDK or compatible vendor- locked SDK O T E L C O L L E C T O R Receive, process and export OTEL signals from an instrumented application to observability backend G R A F A N A Tempo and Loki are used to create dashboards in Grafana Tempo Loki
  14. Agenda Internal Confidential 18 1. The Black Box 2. What

    is OpenTelemetry? 3. Dashboard-Driven 4. Instrumentations 5. Industry Landscape 6. Key Takeaways
  15. 20 D A S H B O A R D

    - D R I V E N 1 Is my cold start time degrading? Question 2 SLO panel: 95% of cold starts < 1500ms Dashboard 3 Only attributes needed: start_type, duration, app_version Instrumentation The Right Question
  16. 21 D A S H B O A R D

    - D R I V E N Are WebView page loads within acceptable SLOs? Is my app startup time healthy across versions and devices? How long do my critical business operations take? Is the UI janky? On which screens? Traces Logs Traces Signal Question Traces Are HTTP calls fast? Can I trace them to the backend? Traces
  17. Agenda Internal Confidential 22 1. The Black Box 2. What

    is OpenTelemetry? 3. Dashboard-Driven 4. Instrumentations 5. Industry Landscape 6. Key Takeaways
  18. 23 I N S T R U M E N

    T A T I O N S How long do my critical business operations take? Which ones are slow? " The screen is slow " - You investigate in your codebase, add logs but you're still guessing Pain A waterfall trace with child spans revealing bottleneck - visible in one click Dashboard Question Custom spans
  19. 24 I N S T R U M E N

    T A T I O N S How long do my critical business operations take? Which ones are slow? " The screen is slow " - You investigate in your codebase, add logs but you're still guessing Pain A waterfall trace with child spans revealing bottleneck - visible in one click Dashboard Question Custom spans
  20. 25 I N S T R U M E N

    T A T I O N S How long do my critical business operations take? Which ones are slow? " The screen is slow " - You investigate in your codebase, add logs but you're still guessing Pain A waterfall trace with child spans revealing bottleneck - visible in one click Dashboard Question Custom spans
  21. 27 I N S T R U M E N

    T A T I O N S A single trace shows the full execution tree with timing and it works in production, not just on your dev device Hierarchical view of spans and OpenTelemetry registry libraries Learnings Add span events for intermediate milestones and status codes to filter failed operations in dashboards Going further Why it matters Custom spans
  22. 28 I N S T R U M E N

    T A T I O N S A single trace shows the full execution tree with timing and it works in production, not just on your dev device Hierarchical view of spans and OpenTelemetry registry libraries Learnings Add span events for intermediate milestones and status codes to filter failed operations in dashboards Going further Why it matters Custom spans
  23. 29 I N S T R U M E N

    T A T I O N S A single trace shows the full execution tree with timing and it works in production, not just on your dev device Hierarchical view of spans and OpenTelemetry registry libraries Learnings Add span events for intermediate milestones and status codes to filter failed operations in dashboards Going further Why it matters Custom spans
  24. 30 I N S T R U M E N

    T A T I O N S Is my app startup time healthy? Does a new version cause regressions? 1-star reviews appear: "App takes forever to open" but everything is fine on your phone Pain SLO gauges and time series of startup duration segmented by app version Dashboard Question App startup time
  25. 31 I N S T R U M E N

    T A T I O N S Is my app startup time healthy? Does a new version cause regressions? 1-star reviews appear: "App takes forever to open" but everything is fine on your phone Pain SLO gauges and time series of startup duration segmented by app version Dashboard Question App startup time
  26. 32 I N S T R U M E N

    T A T I O N S Is my app startup time healthy? Does a new version cause regressions? 1-star reviews appear: "App takes forever to open" but everything is fine on your phone Pain SLO gauges and time series of startup duration segmented by app version Dashboard Question App startup time
  27. 34 I N S T R U M E N

    T A T I O N S Startup is the first impression. With this dashboard, you can catch cold start regression before 1-star reviews App startup time is measured by the OS, trace isn't relevant. Choose the right signal for the right data. Learnings Add TTFD support or an anonymized bucket device model (e.g. low-end, mid, high-end), etc. Going further Why it matters App startup time
  28. 35 I N S T R U M E N

    T A T I O N S Startup is the first impression. With this dashboard, you can catch cold start regression before 1-star reviews App startup time is measured by the OS, trace isn't relevant. Choose the right signal for the right data. Learnings Add TTFD support or an anonymized bucket device model (e.g. low-end, mid, high-end), etc. Going further Why it matters App startup time
  29. 36 I N S T R U M E N

    T A T I O N S Startup is the first impression. With this dashboard, you can catch cold start regression before 1-star reviews App startup time is measured by the OS, trace isn't relevant. Choose the right signal for the right data. Learnings Add TTFD support or an anonymized bucket device model (e.g. low-end, mid, high-end), etc. Going further Why it matters App startup time
  30. 37 I N S T R U M E N

    T A T I O N S Are HTTP calls fast? If a response is slow, is it the network, the app, or the backend? The API takes 5 seconds to load but the backend team says "our p95 is 200ms, it's not us", who trust?! Pain SLO counters (<500ms; > 500ms; / 5xx errors), HTTP calls by endpoint/method and a distributed trace! Dashboard Question Http calls
  31. 38 I N S T R U M E N

    T A T I O N S Are HTTP calls fast? If a response is slow, is it the network, the app, or the backend? The API takes 5 seconds to load but the backend team says "our p95 is 200ms, it's not us", who trust?! Pain SLO counters (<500ms; > 500ms; / 5xx errors), HTTP calls by endpoint/method and a distributed trace! Dashboard Question Http calls
  32. 39 I N S T R U M E N

    T A T I O N S Are HTTP calls fast? If a response is slow, is it the network, the app, or the backend? The API takes 5 seconds to load but the backend team says "our p95 is 200ms, it's not us", who trust?! Pain SLO counters (<500ms; > 500ms; / 5xx errors), HTTP calls by endpoint/method and a distributed trace! Dashboard Question Http calls
  33. 41 I N S T R U M E N

    T A T I O N S This is the end of the blame game. "Is it the app or the backend?" Is no more a question, it's a dashboard query Auto-instrumentation changes the economics of observability, one plugin install give you HTTP tracing with zero manual spans Learnings Use OteL Http client attribute extractor to redact or truncate calls containing tokens Going further Why it matters Http calls
  34. 42 I N S T R U M E N

    T A T I O N S This is the end of the blame game. "Is it the app or the backend?" Is no more a question, it's a dashboard query Auto-instrumentation changes the economics of observability, one plugin install give you HTTP tracing with zero manual spans Learnings Use OteL Http client attribute extractor to redact or truncate calls containing tokens Going further Why it matters Http calls
  35. 43 I N S T R U M E N

    T A T I O N S This is the end of the blame game. "Is it the app or the backend?" Is no more a question, it's a dashboard query Auto-instrumentation changes the economics of observability, one plugin install give you HTTP tracing with zero manual spans Learnings Use OteL Http client attribute extractor to redact or truncate calls containing tokens Going further Why it matters Http calls
  36. Agenda Internal Confidential 44 1. The Black Box 2. What

    is OpenTelemetry? 3. Dashboard-Driven 4. Instrumentations 5. Industry Landscape 6. Key Takeaways
  37. 45 I N D U S T R Y L

    A N D S C A P E Grafana Cloud Datadog Dynatrace Sentry Splunk Elastic / Kibana New Relic 🟡 ✅ ✅ ✅ ✅ OTLP Native Notes Vendor ✅ ✅ Full OTLP support OTLP intake endpoint, maps to Datadog traces/logs OTLP intake, integrates with OneAgent OTel SDK support in progress Acquired SignalFx, full OTLP APM server accepts OTLP OTLP endpoint, first-class support
  38. 46 I N D U S T R Y L

    A N D S C A P E Auto HTTP tracing Auto screen tracking Crash reporting Distributed tracing Custom span/traces Self-hosted option Standard API ✅ ❌ 🟡 ✅ ✅ ✅ ✅ ✅ ❌ ✅ ✅ ❌ ✅ 🟡 ❌ 🟡 ✅ ✅ ✅ ✅ ✅ 🟡 ❌ ✅ 🟡 ❌ ❌ 🟡
  39. Agenda Internal Confidential 47 1. The Black Box 2. What

    is OpenTelemetry? 3. Dashboard-Driven 4. Instrumentations 5. Industry Landscape 6. Key Takeaways
  40. 48 K E Y T A K E A W

    A Y S 4 things to remember — Start with the question, not the SDK Design your dashboard first. Then, write only the instrumentation needed to fill it. This gives you observability and privacy by design. Traces + Logs are your mobile signals Forget Metrics on mobile. Spans give you timing and causality. Structured Logs give you events the OS measures better than you can. OTeL is a standard, not a tool Your instrumentation code use standard API. Change your backend vendor without rewriting your app code. Distributed tracing connects the dots traceparent header allow your frontend app to be connected to your backend a build a multi-system observability.