Test Case Prioritization International Conference on Software Testing, Verification and Validation Xi'an, China April 22-27 2019 DAVID PATERSON, U N I VE RSI TY O F S HE FFI ELD JOSE CAMPOS, U N I VE R SI TY OF WASHI N G TON RUI ABREU, U N I VE R SI TY OF LI SB ON GREGORY M. KAPFHAMMER, AL L EGHENY CO L L EGE GORDON FRASER, UNIV ERS ITY O F PAS S AU PHIL MCMINN, UNIV ERS ITY O F S HEF F IEL D [email protected]
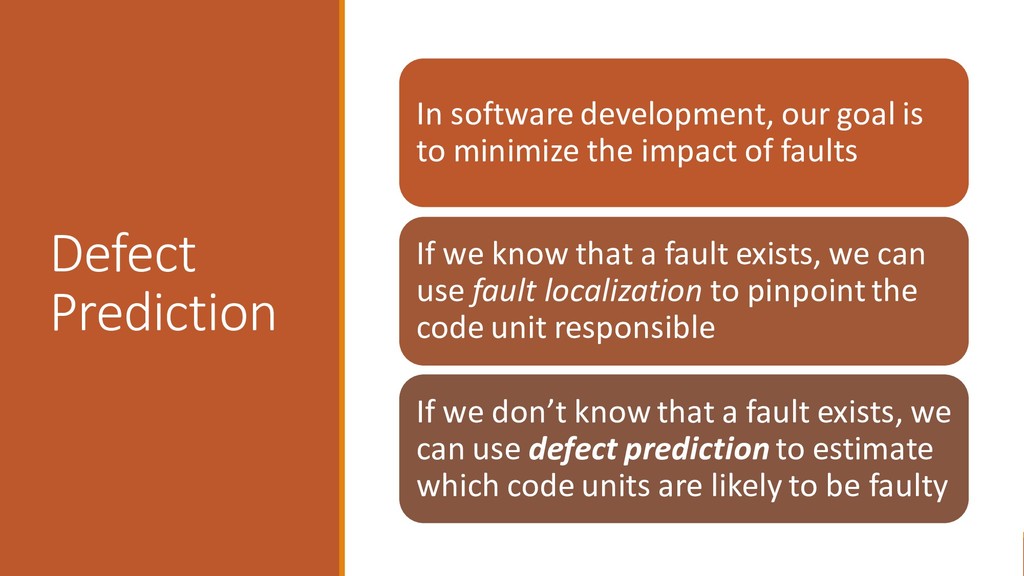
the impact of faults If we know that a fault exists, we can use fault localization to pinpoint the code unit responsible If we don’t know that a fault exists, we can use defect prediction to estimate which code units are likely to be faulty [email protected]
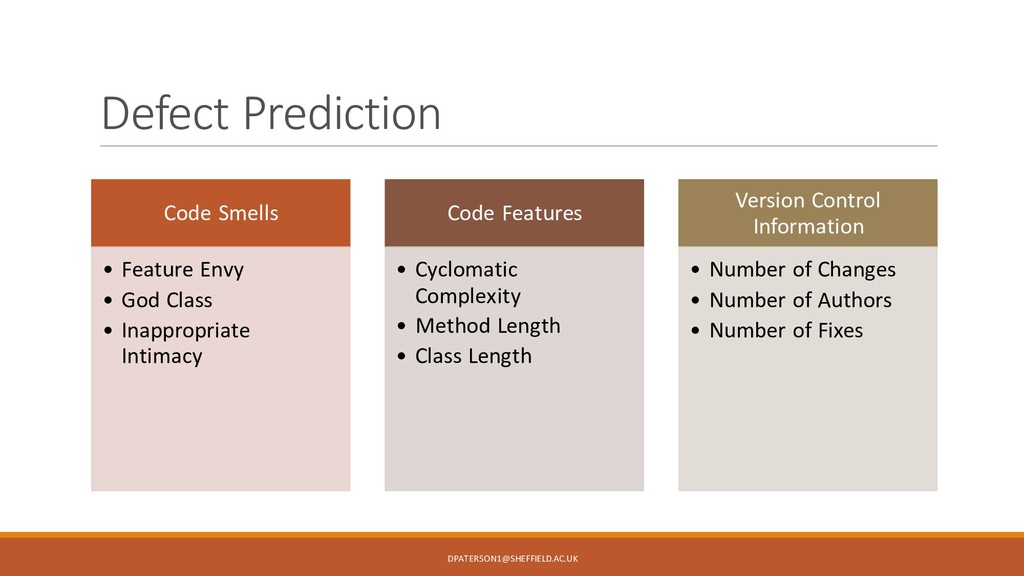
• Inappropriate Intimacy Code Features • Cyclomatic Complexity • Method Length • Class Length Version Control Information • Number of Changes • Number of Authors • Number of Fixes [email protected]
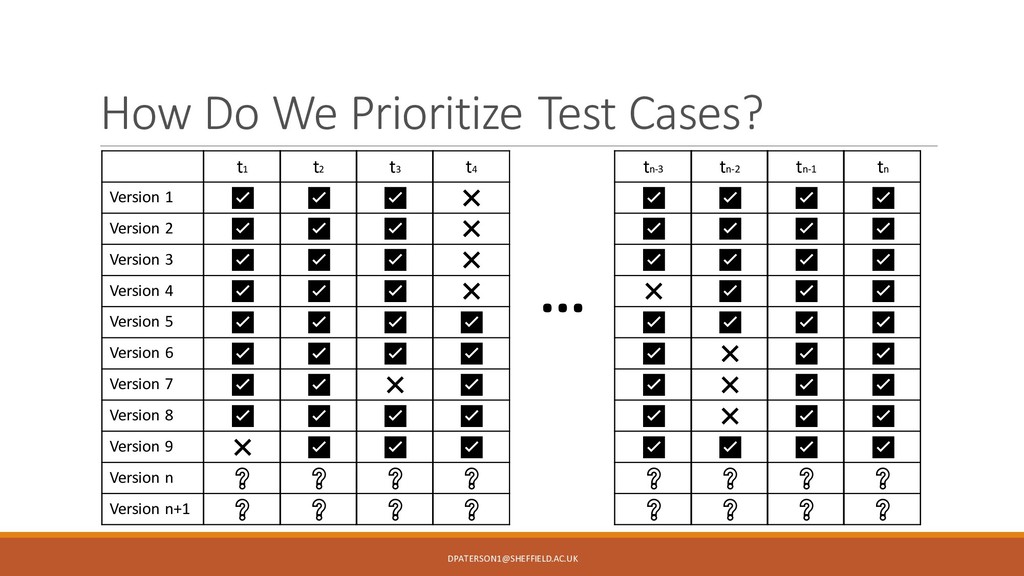
for up to 80% of the total testing budget, and up to 50% of the cost of software maintenance In some situations, it may not be possible to re-run all test cases on a system By prioritizing test cases, we aim to ensure faults are detected in the smallest amount of time irrespective of program changes [email protected]
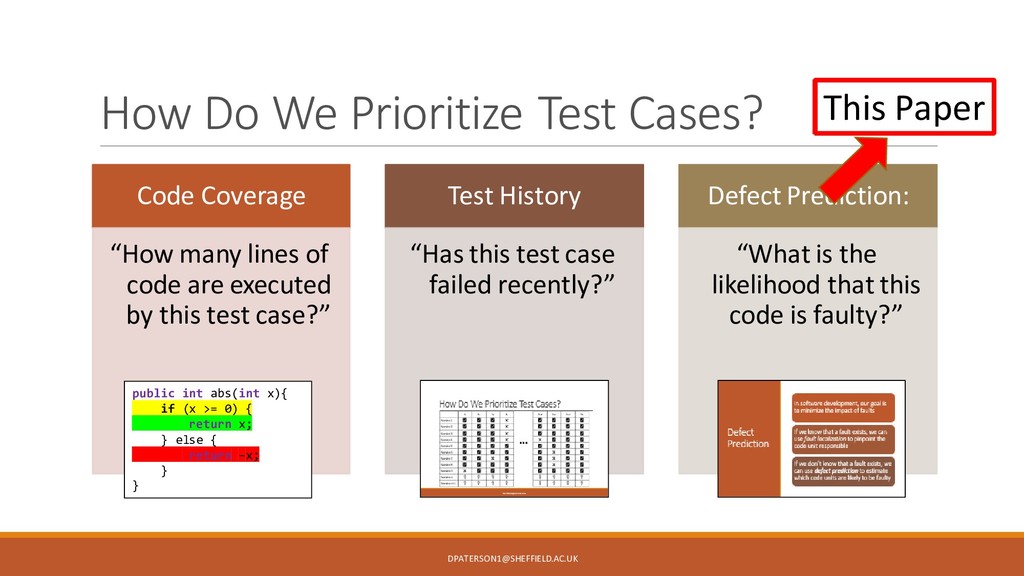
lines of code are executed by this test case?” Test History “Has this test case failed recently?” Defect Prediction: “What is the likelihood that this code is faulty?” public int abs(int x){ if (x >= 0) { return x; } else { return –x; } } This Paper [email protected]
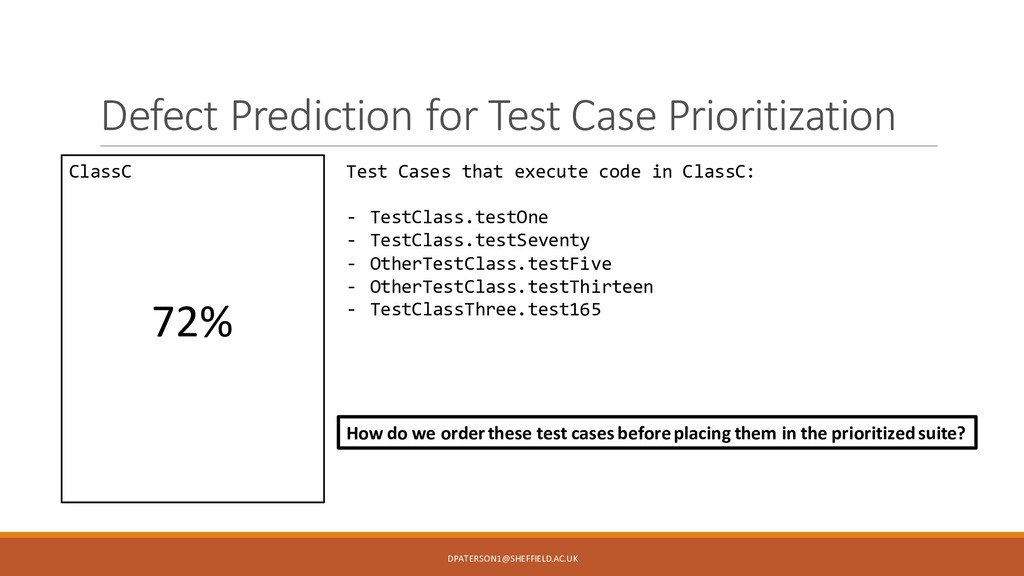
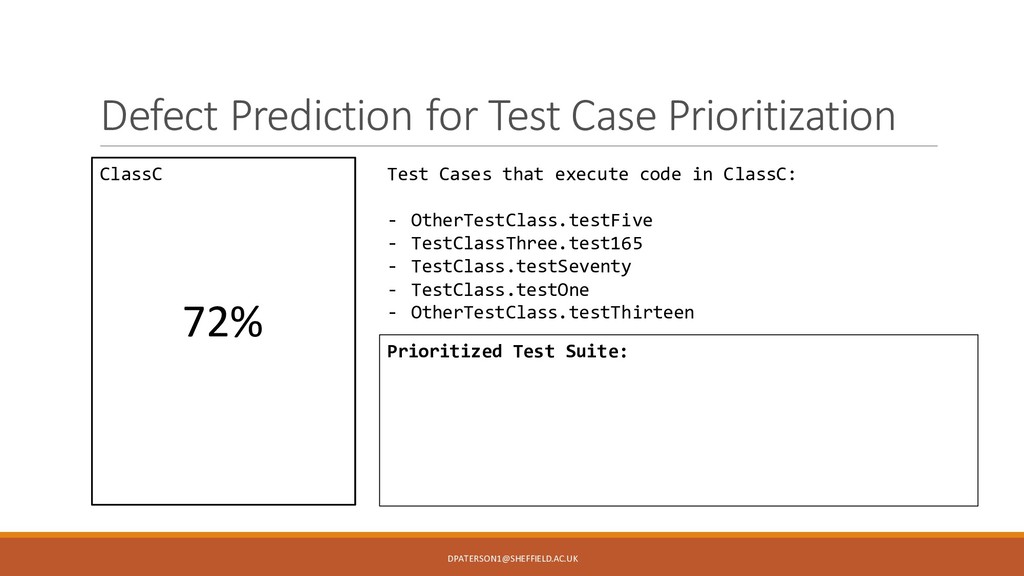
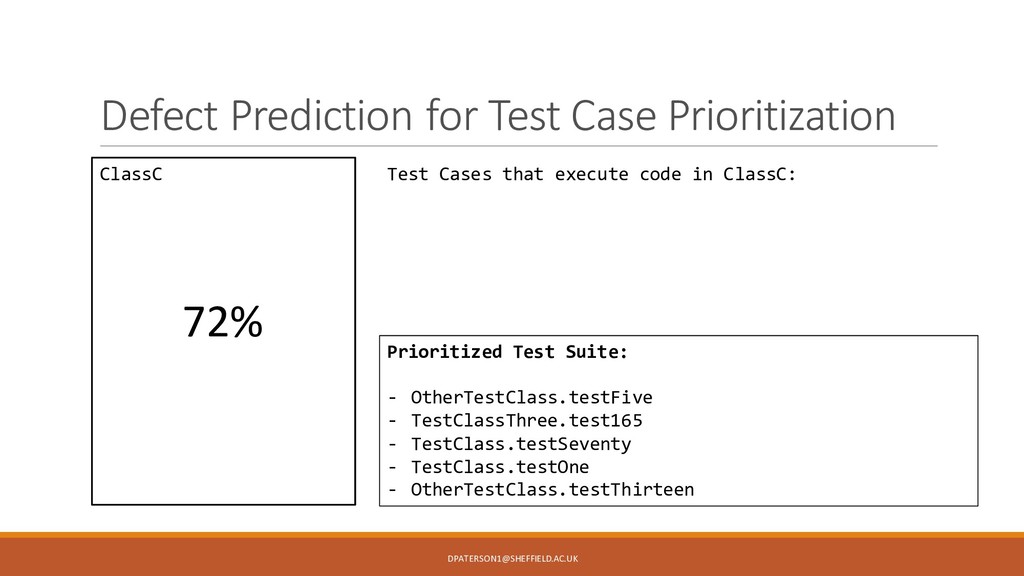
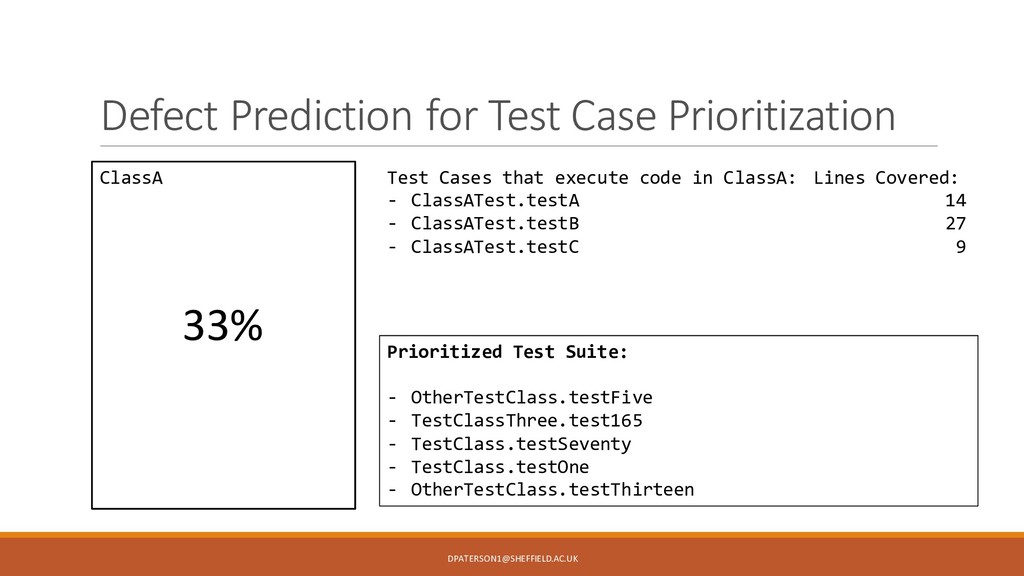
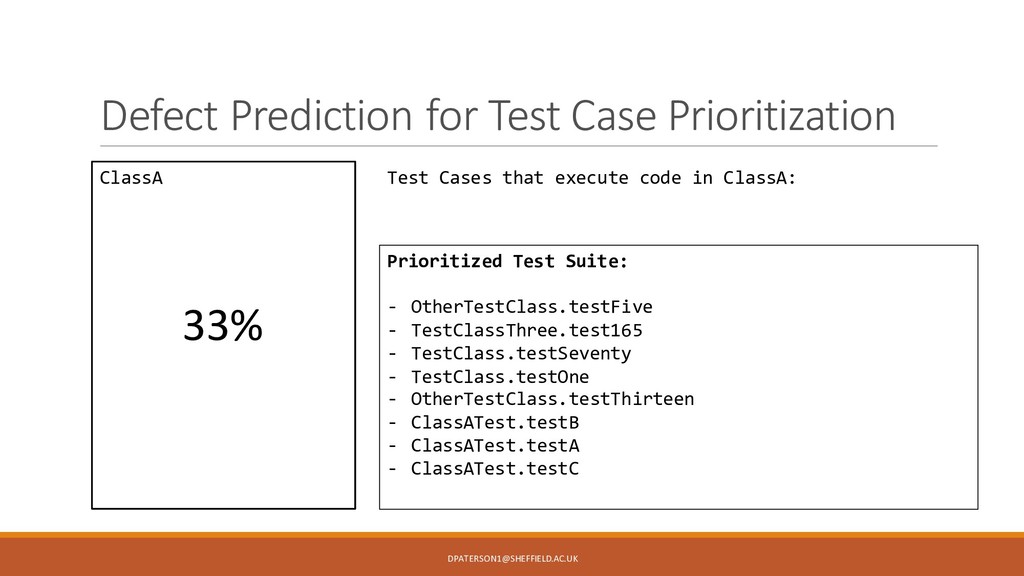
that execute code in ClassC: - TestClass.testOne - TestClass.testSeventy - OtherTestClass.testFive - OtherTestClass.testThirteen - TestClassThree.test165 How do we order these test cases before placing them in the prioritized suite? [email protected]
earlier (e.g. code coverage) as a way of ordering the subset of test cases Test Cases that execute code in ClassC: - TestClass.testOne - TestClass.testSeventy - OtherTestClass.testFive - OtherTestClass.testThirteen - TestClassThree.test165 [email protected]
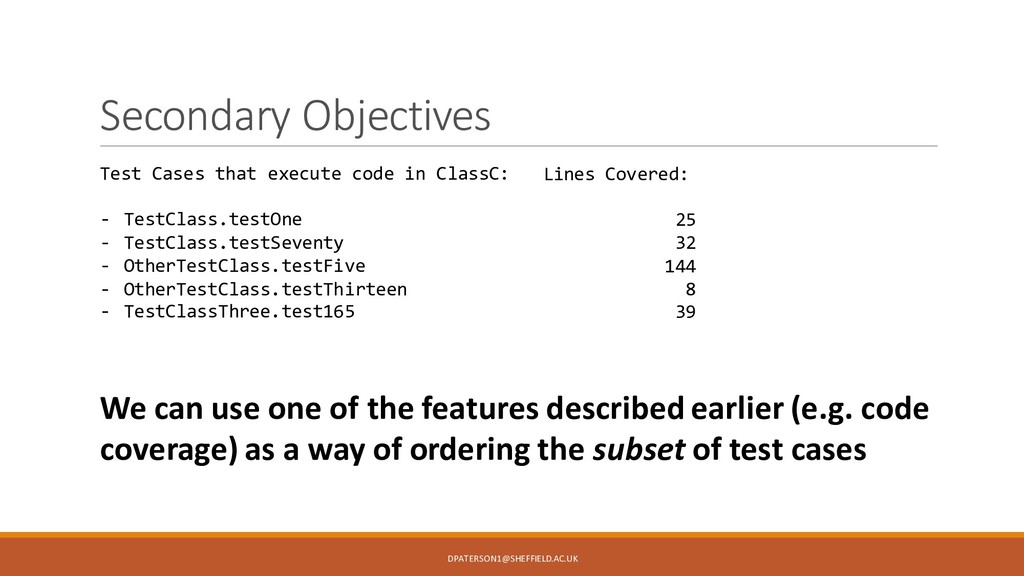
earlier (e.g. code coverage) as a way of ordering the subset of test cases Lines Covered: 25 32 144 8 39 Test Cases that execute code in ClassC: - TestClass.testOne - TestClass.testSeventy - OtherTestClass.testFive - OtherTestClass.testThirteen - TestClassThree.test165 [email protected]
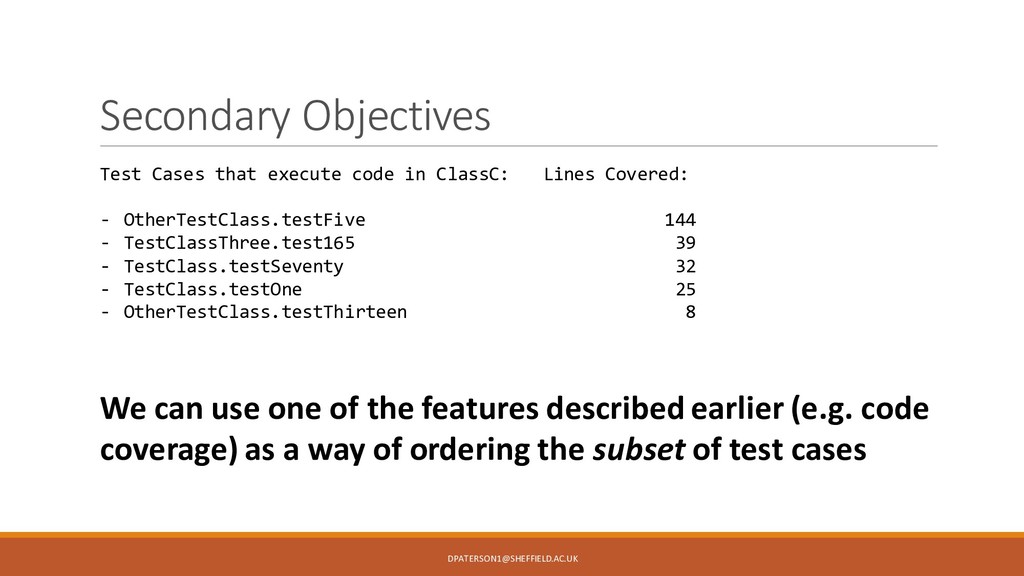
earlier (e.g. code coverage) as a way of ordering the subset of test cases Lines Covered: 144 39 32 25 8 Test Cases that execute code in ClassC: - OtherTestClass.testFive - TestClassThree.test165 - TestClass.testSeventy - TestClass.testOne - OtherTestClass.testThirteen [email protected]
produce defect prediction scores comprised of weighted number of commits, authors, and fixes related to a file [1] - https://github.com/andrefreitas/schwa [email protected]
produce defect prediction scores comprised of weighted number of commits, authors, and fixes related to a file [1] - https://github.com/andrefreitas/schwa Faults: DEFECTS4J [2] Repository containing 395 real faults collected across 6 open- source Java projects [2] - https://github.com/rjust/defects4j [email protected]
produce defect prediction scores comprised of weighted number of commits, authors, and fixes related to a file Faults: DEFECTS4J [2] Repository containing 395 real faults collected across 6 open- source Java projects Test Prioritization: KANONIZO [3] Test Case Prioritization tool built for Java Applications [1] - https://github.com/andrefreitas/schwa [2] - https://github.com/rjust/defects4j [3] - https://github.com/kanonizo/kanonizo [email protected]
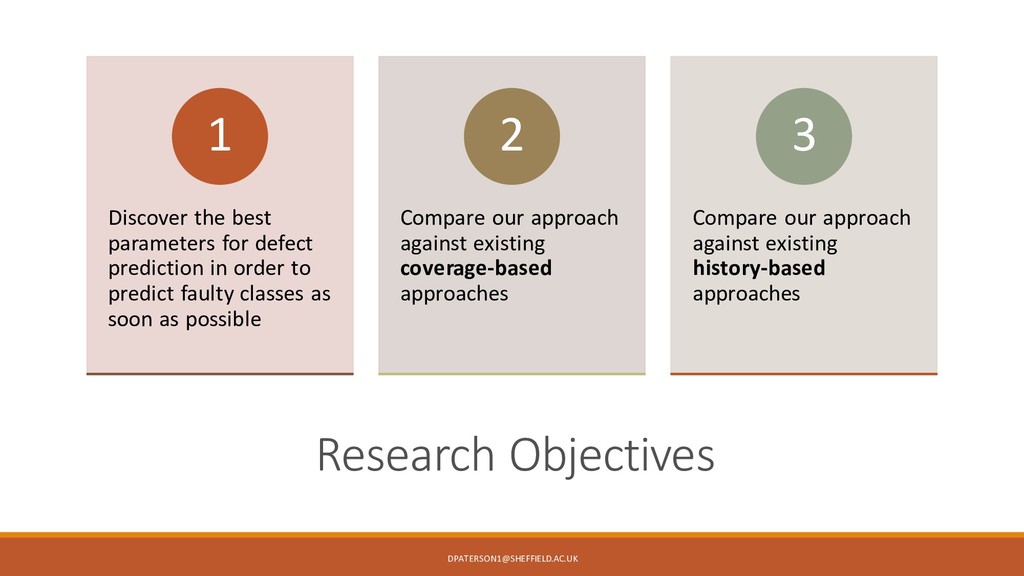
in order to predict faulty classes as soon as possible 1 Compare our approach against existing coverage-based approaches 2 Compare our approach against existing history-based approaches 3 [email protected]
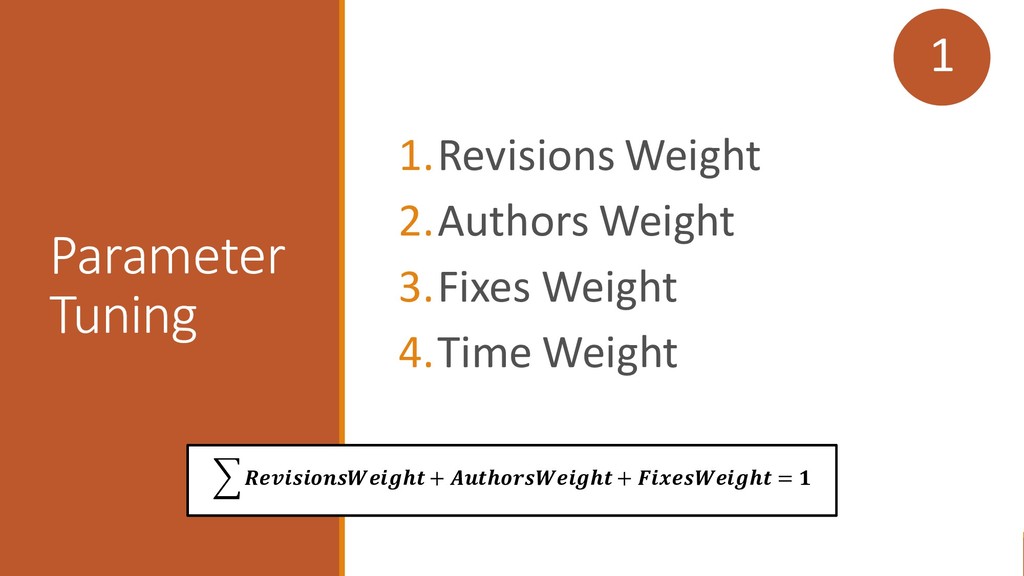
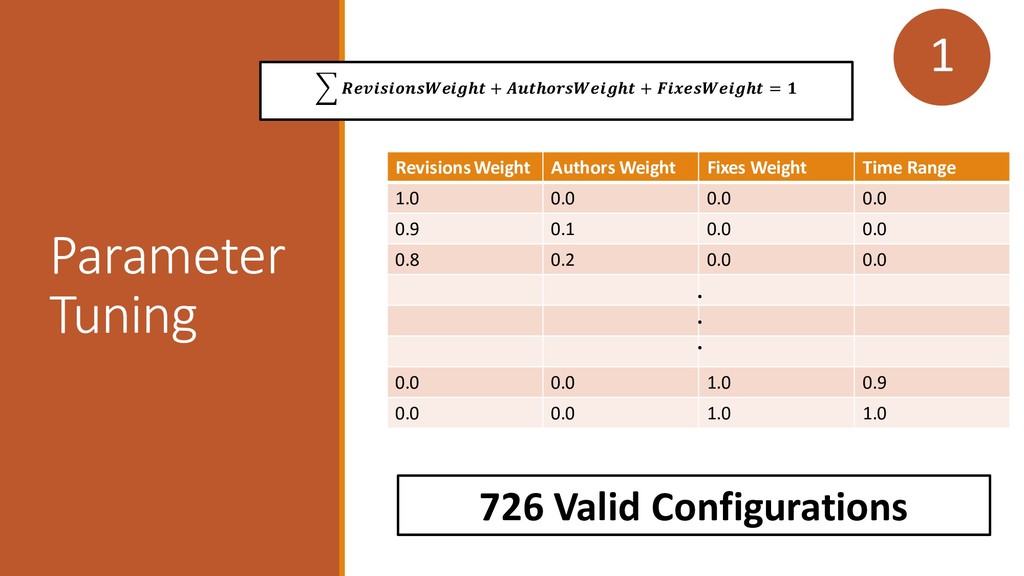
For each bug/valid configuration - Initialize Schwa with configuration and run - Collect “true” faulty class from DEFECTS4J - Calculate index of “true” faulty class according to prediction Parameter Tuning 1
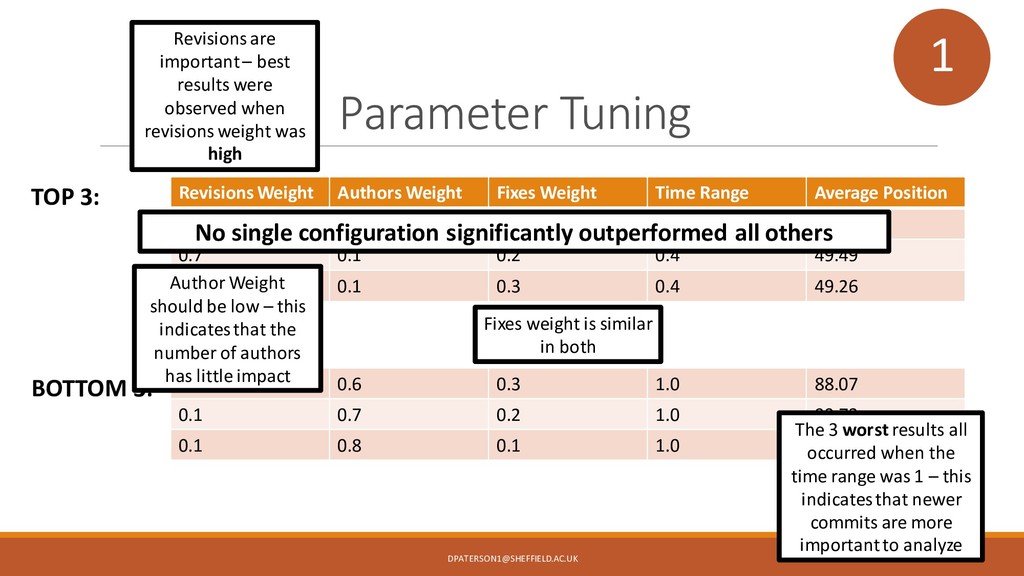
Average Position 0.6 0.1 0.3 0.0 49.12 0.7 0.1 0.2 0.4 49.49 0.6 0.1 0.3 0.4 49.26 0.1 0.6 0.3 1.0 88.07 0.1 0.7 0.2 1.0 90.73 0.1 0.8 0.1 1.0 91.43 TOP 3: BOTTOM 3: Revisions are important – best results were observed when revisions weight was high Author Weight should be low – this indicates that the number of authors has little impact Fixes weight is similar in both The 3 worst results all occurred when the time range was 1 – this indicates that newer commits are more important to analyze No single configuration significantly outperformed all others 1 [email protected]
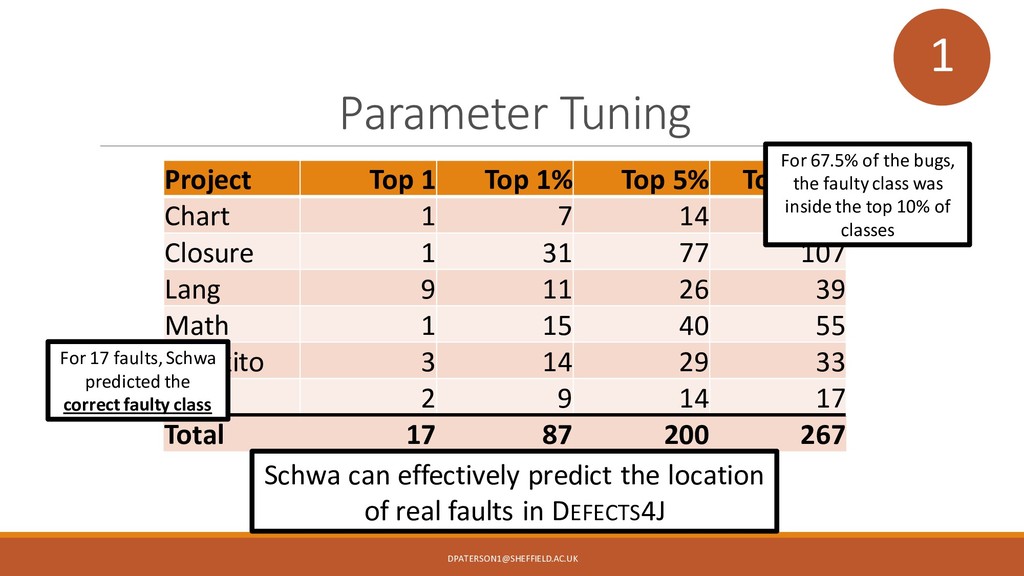
Top 10% Chart 1 7 14 16 Closure 1 31 77 107 Lang 9 11 26 39 Math 1 15 40 55 Mockito 3 14 29 33 Time 2 9 14 17 Total 17 87 200 267 For 67.5% of the bugs, the faulty class was inside the top 10% of classes For 17 faults, Schwa predicted the correct faulty class Schwa can effectively predict the location of real faults in DEFECTS4J [email protected]
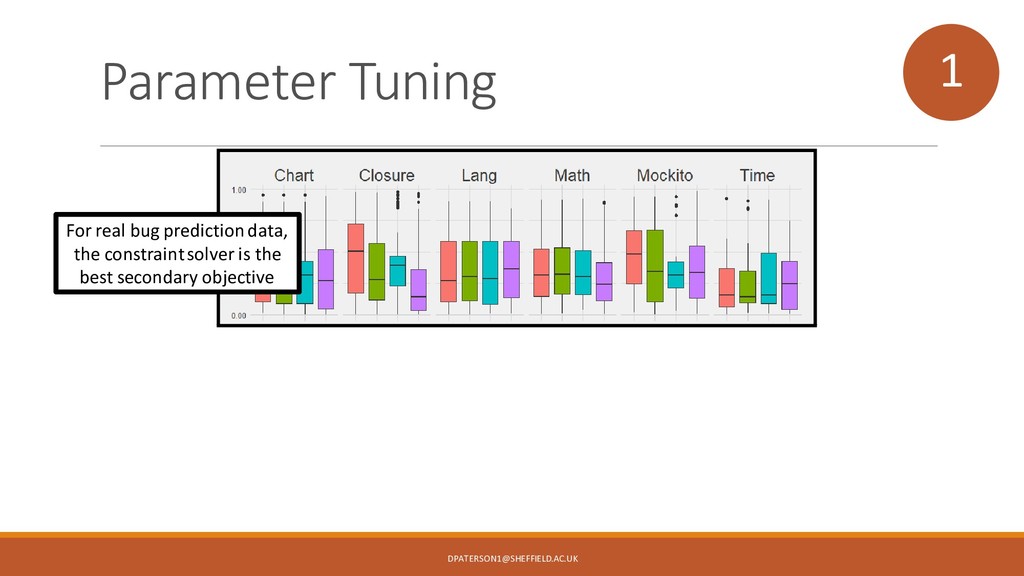
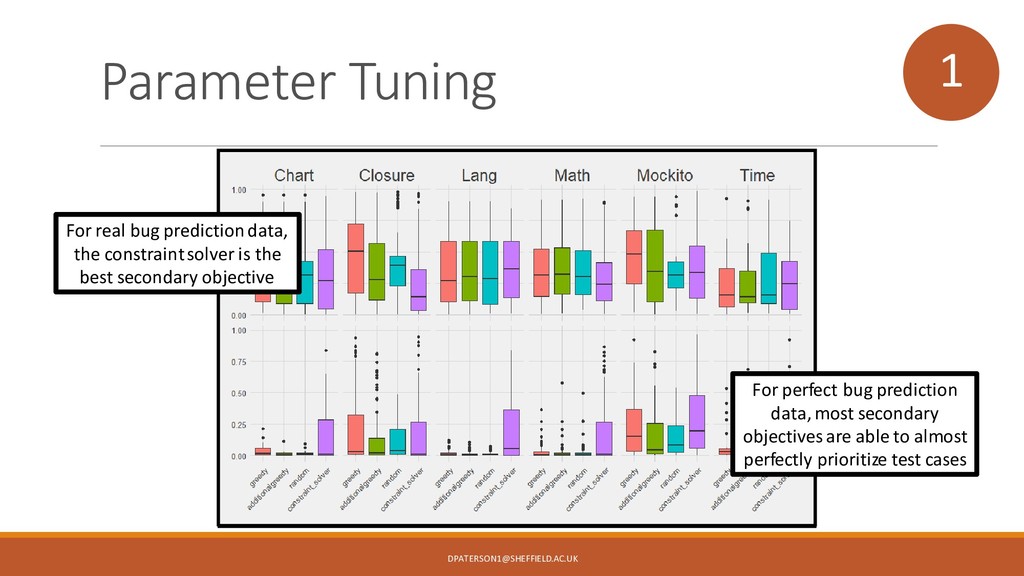
solver is the best secondary objective For perfect bug prediction data, most secondary objectives are able to almost perfectly prioritize test cases [email protected]
in order to predict faulty classes as soon as possible 1 Compare our approach against existing coverage-based approaches 2 Compare our approach against existing history-based approaches 3 [email protected]
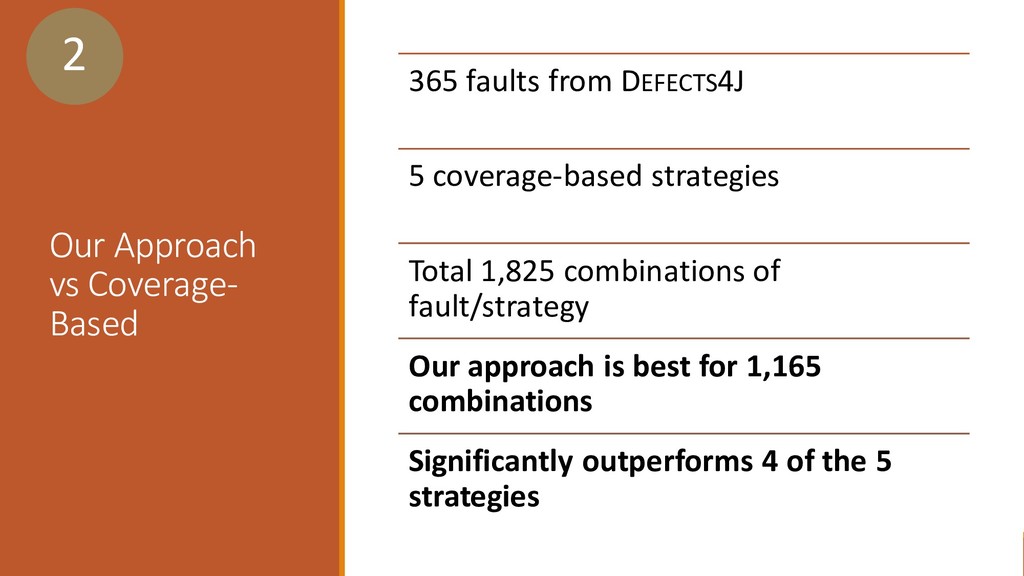
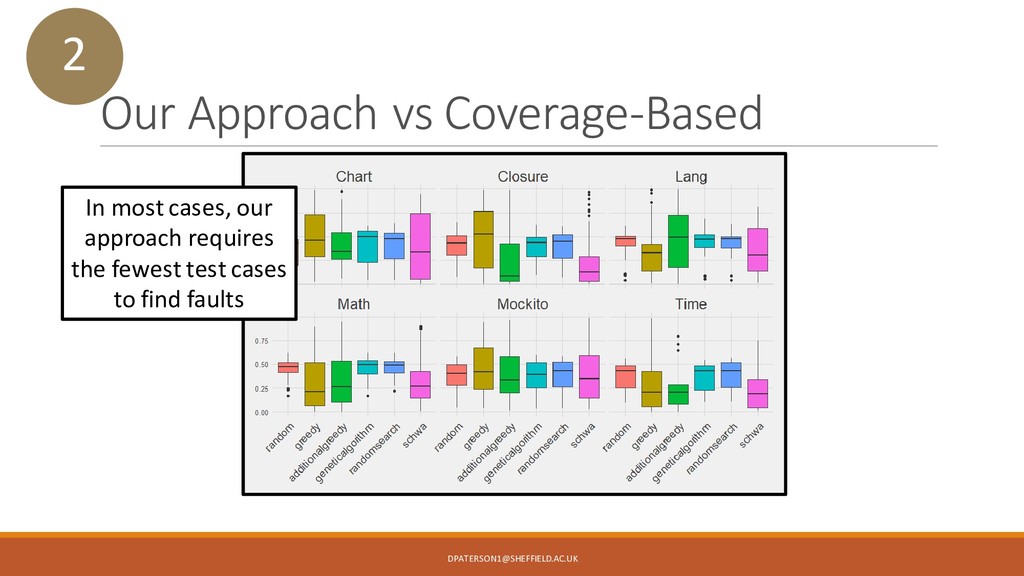
coverage-based strategies Total 1,825 combinations of fault/strategy Our approach is best for 1,165 combinations Significantly outperforms 4 of the 5 strategies 2 [email protected]
in order to predict faulty classes as soon as possible 1 Compare our approach against existing coverage-based approaches 2 Compare our approach against existing history-based approaches 3 [email protected]
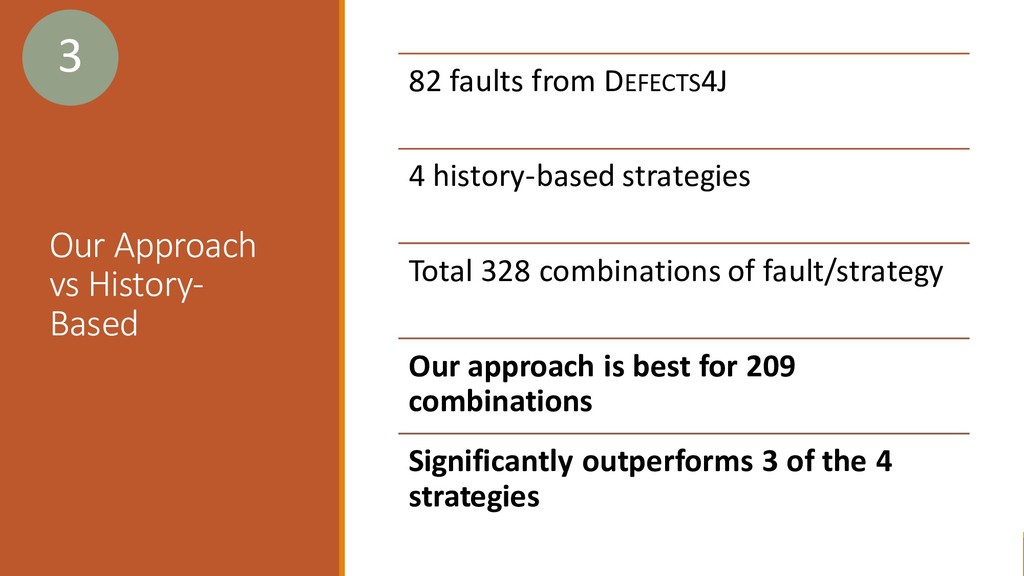
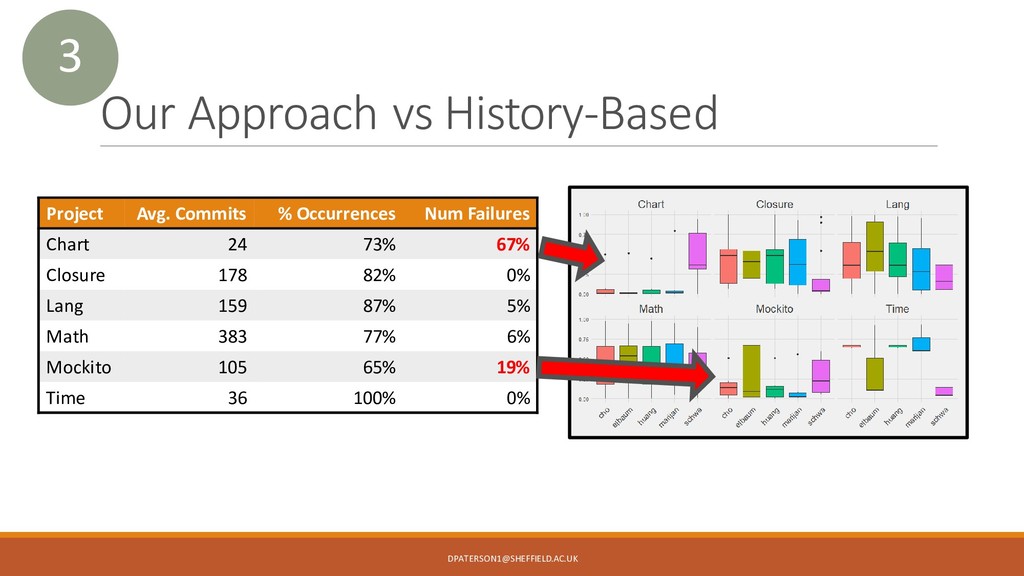
history-based strategies Total 328 combinations of fault/strategy Our approach is best for 209 combinations Significantly outperforms 3 of the 4 strategies 3 [email protected]
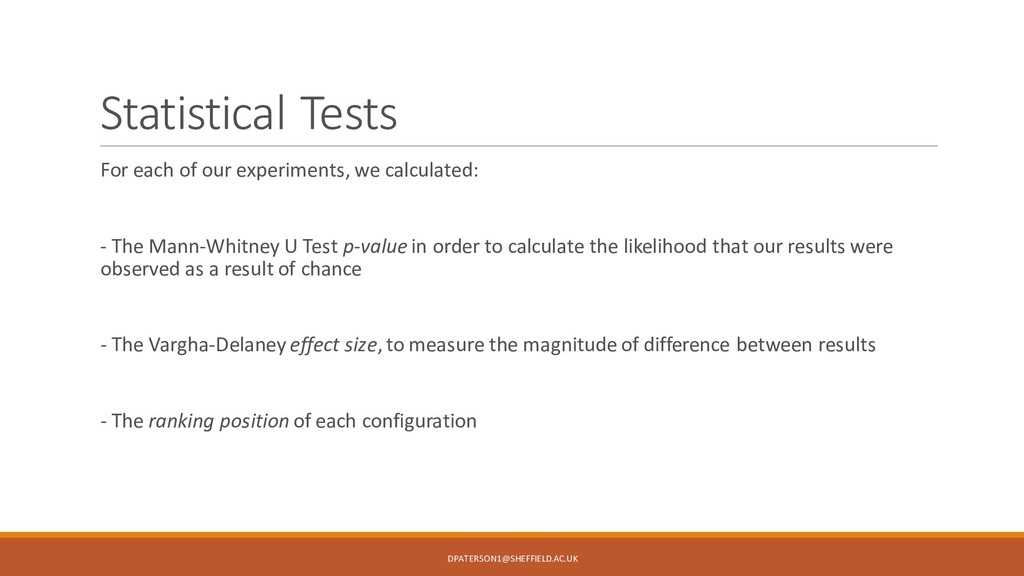
The Mann-Whitney U Test p-value in order to calculate the likelihood that our results were observed as a result of chance - The Vargha-Delaney effect size, to measure the magnitude of difference between results - The ranking position of each configuration [email protected]
![Defect Prediction for Test Case Prioritization ClassC 72% [email protected]](https://files.speakerdeck.com/presentations/e37b2960e1634839844565f9742227dc/slide_8.jpg)
![Empirical Evaluation [email protected]](https://files.speakerdeck.com/presentations/e37b2960e1634839844565f9742227dc/slide_19.jpg)
![Empirical Evaluation Defect Prediction: Schwa[1] Uses version control information to](https://files.speakerdeck.com/presentations/e37b2960e1634839844565f9742227dc/slide_20.jpg)
![Empirical Evaluation Defect Prediction: Schwa[1] Uses version control information to](https://files.speakerdeck.com/presentations/e37b2960e1634839844565f9742227dc/slide_21.jpg)
![Empirical Evaluation Defect Prediction: Schwa[1] Uses version control information to](https://files.speakerdeck.com/presentations/e37b2960e1634839844565f9742227dc/slide_22.jpg)
![Parameter Tuning 1.Greedy 2.Additional Greedy 3.Random 4.Constraint Solver 1 [email protected]](https://files.speakerdeck.com/presentations/e37b2960e1634839844565f9742227dc/slide_31.jpg)
![Our Approach vs History-Based 3 [email protected]](https://files.speakerdeck.com/presentations/e37b2960e1634839844565f9742227dc/slide_39.jpg)
![Summary Tool: https://github.com/kanonizo/kanonizo Data: https://bitbucket.org/josecampos/history-based-test-prioritization-data [email protected]](https://files.speakerdeck.com/presentations/e37b2960e1634839844565f9742227dc/slide_41.jpg)