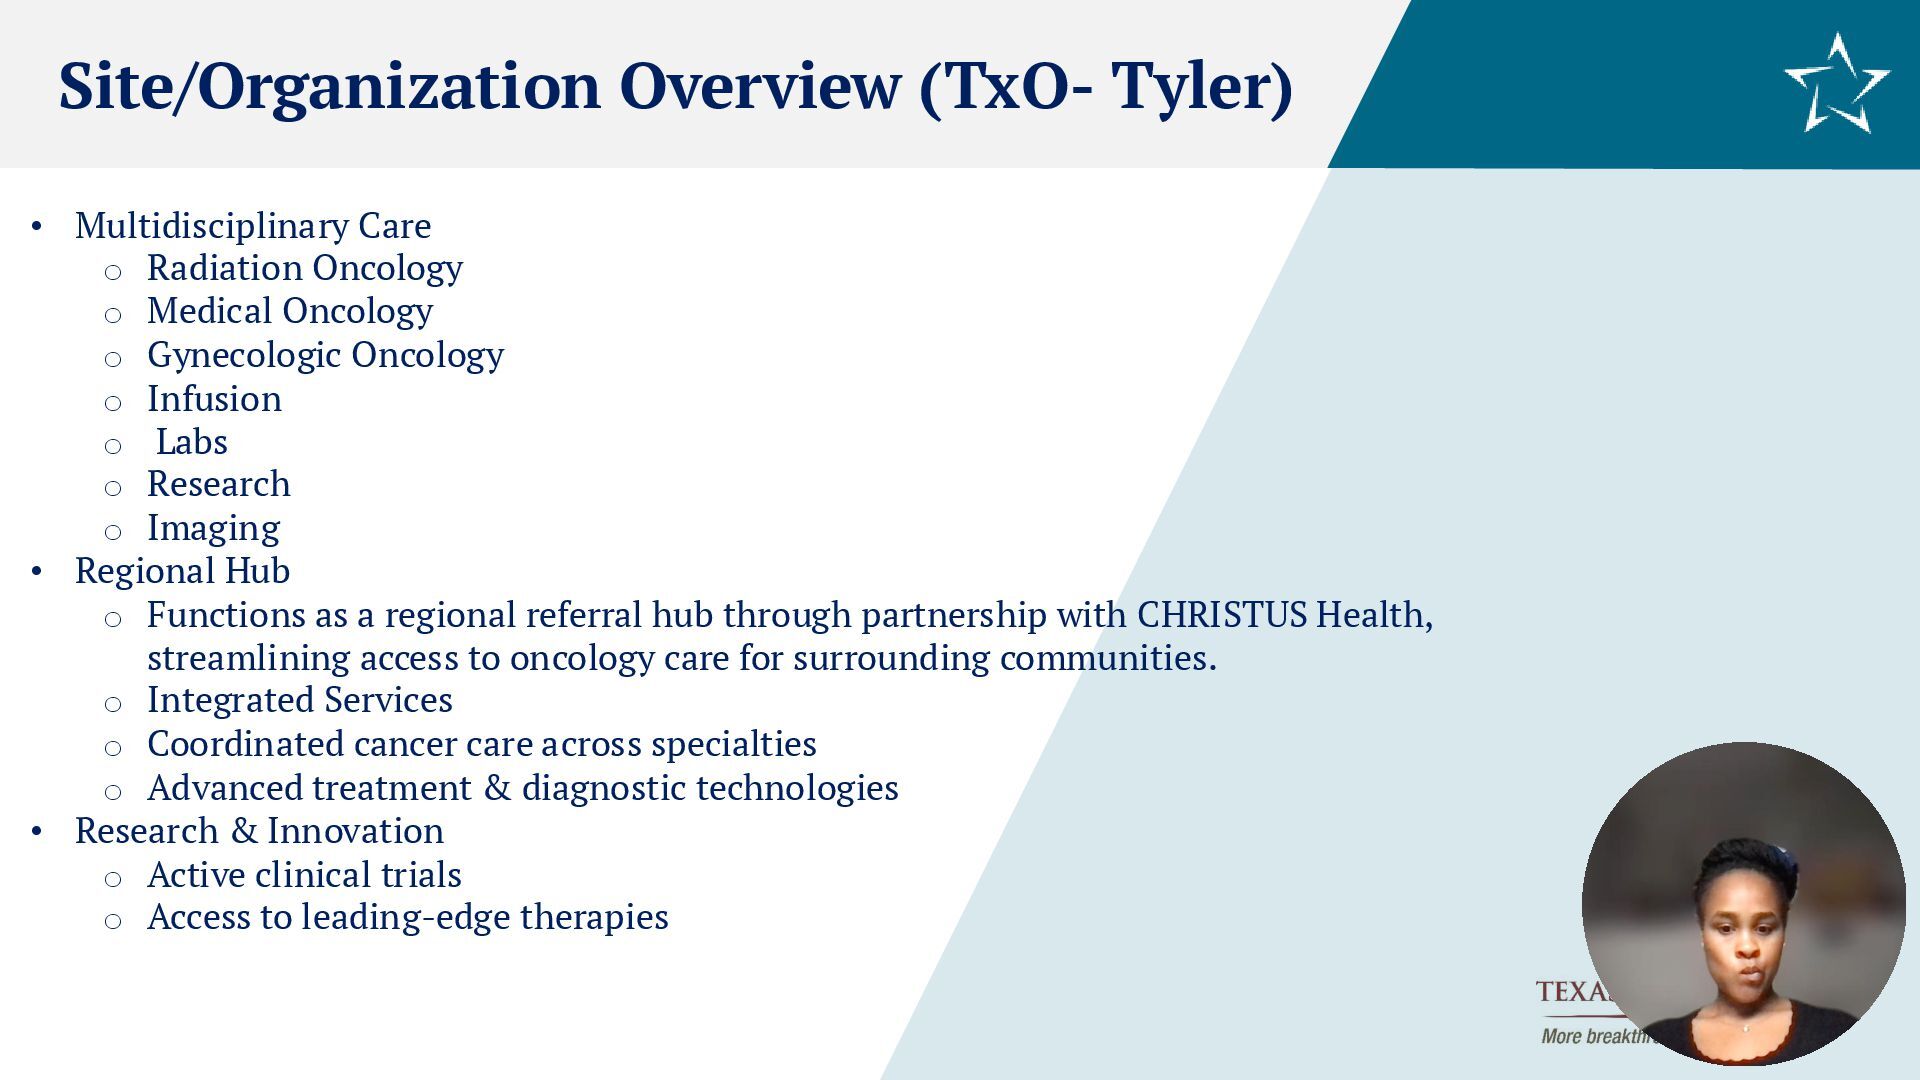
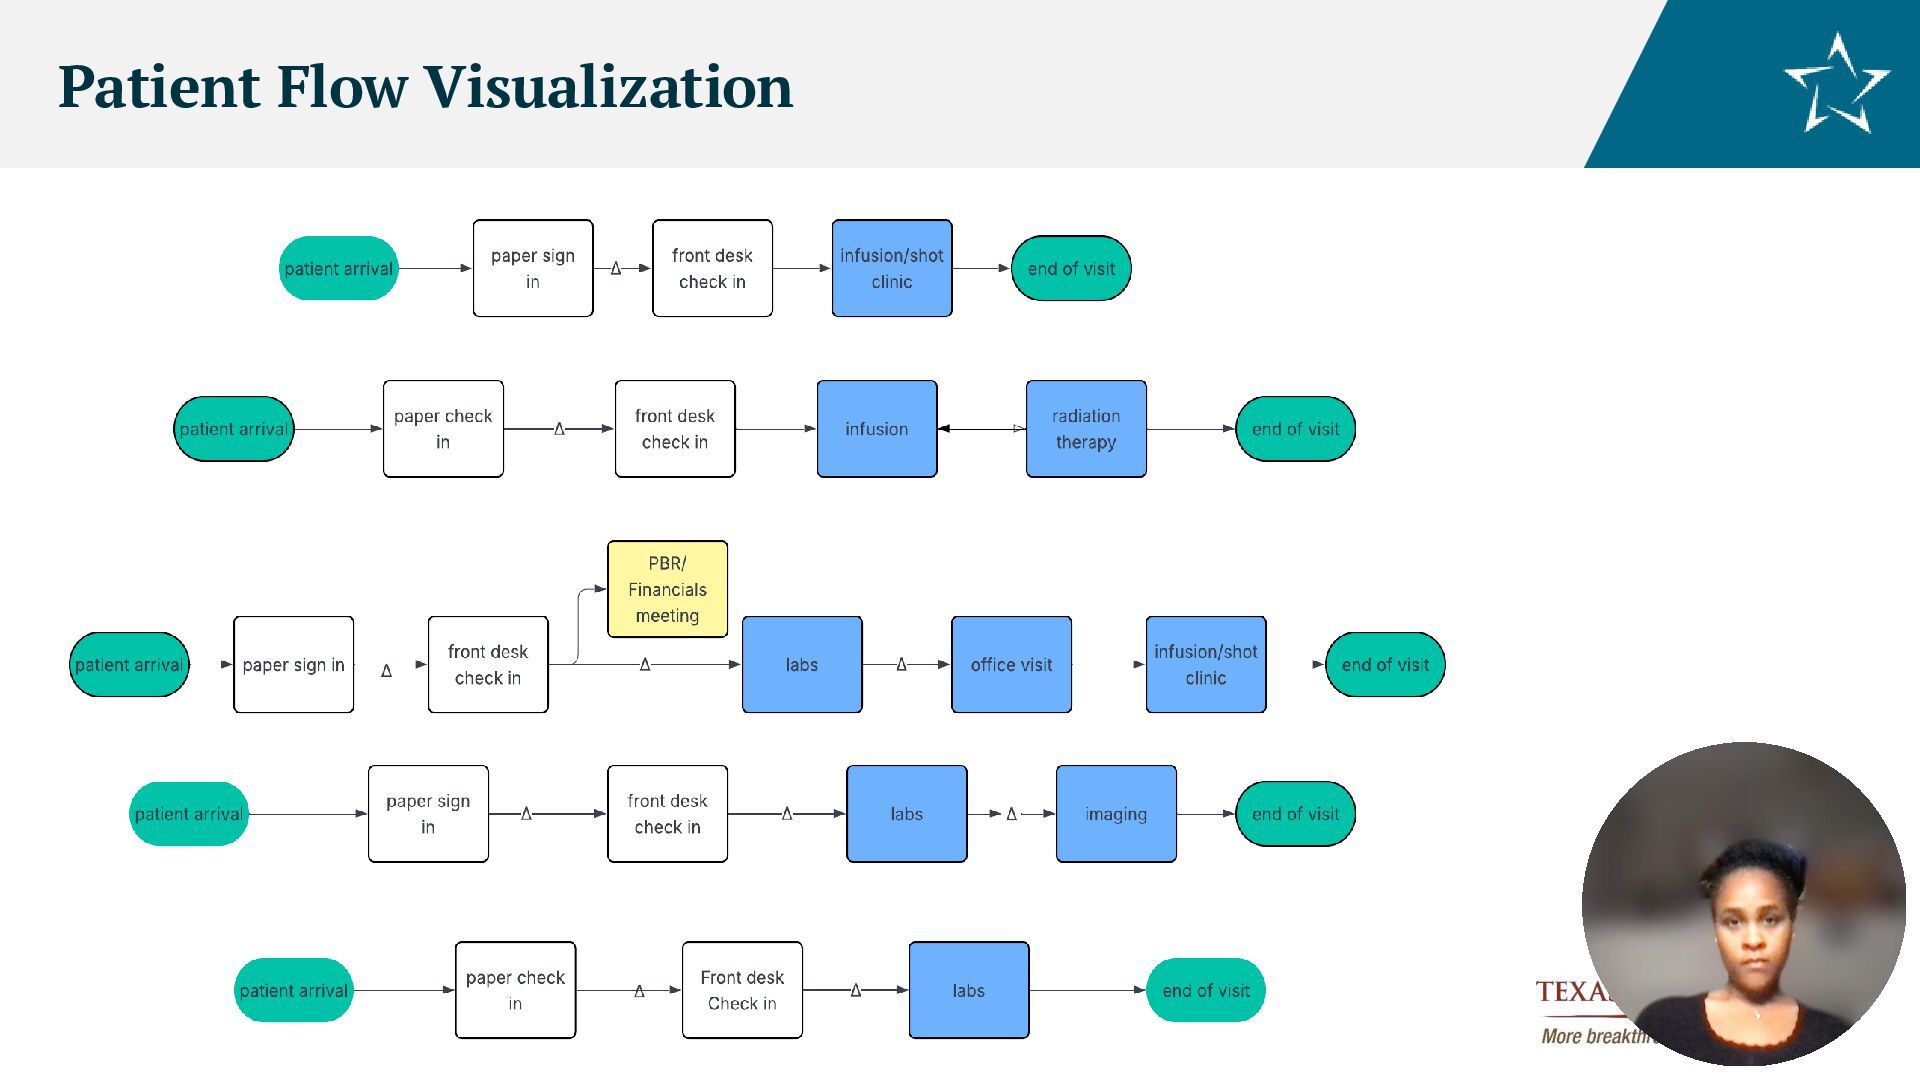
o Medical Oncology o Gynecologic Oncology o Infusion o Labs o Research o Imaging • Regional Hub o Functions as a regional referral hub through partnership with CHRISTUS Health, streamlining access to oncology care for surrounding communities. o Integrated Services o Coordinated cancer care across specialties o Advanced treatment & diagnostic technologies • Research & Innovation o Active clinical trials o Access to leading-edge therapies
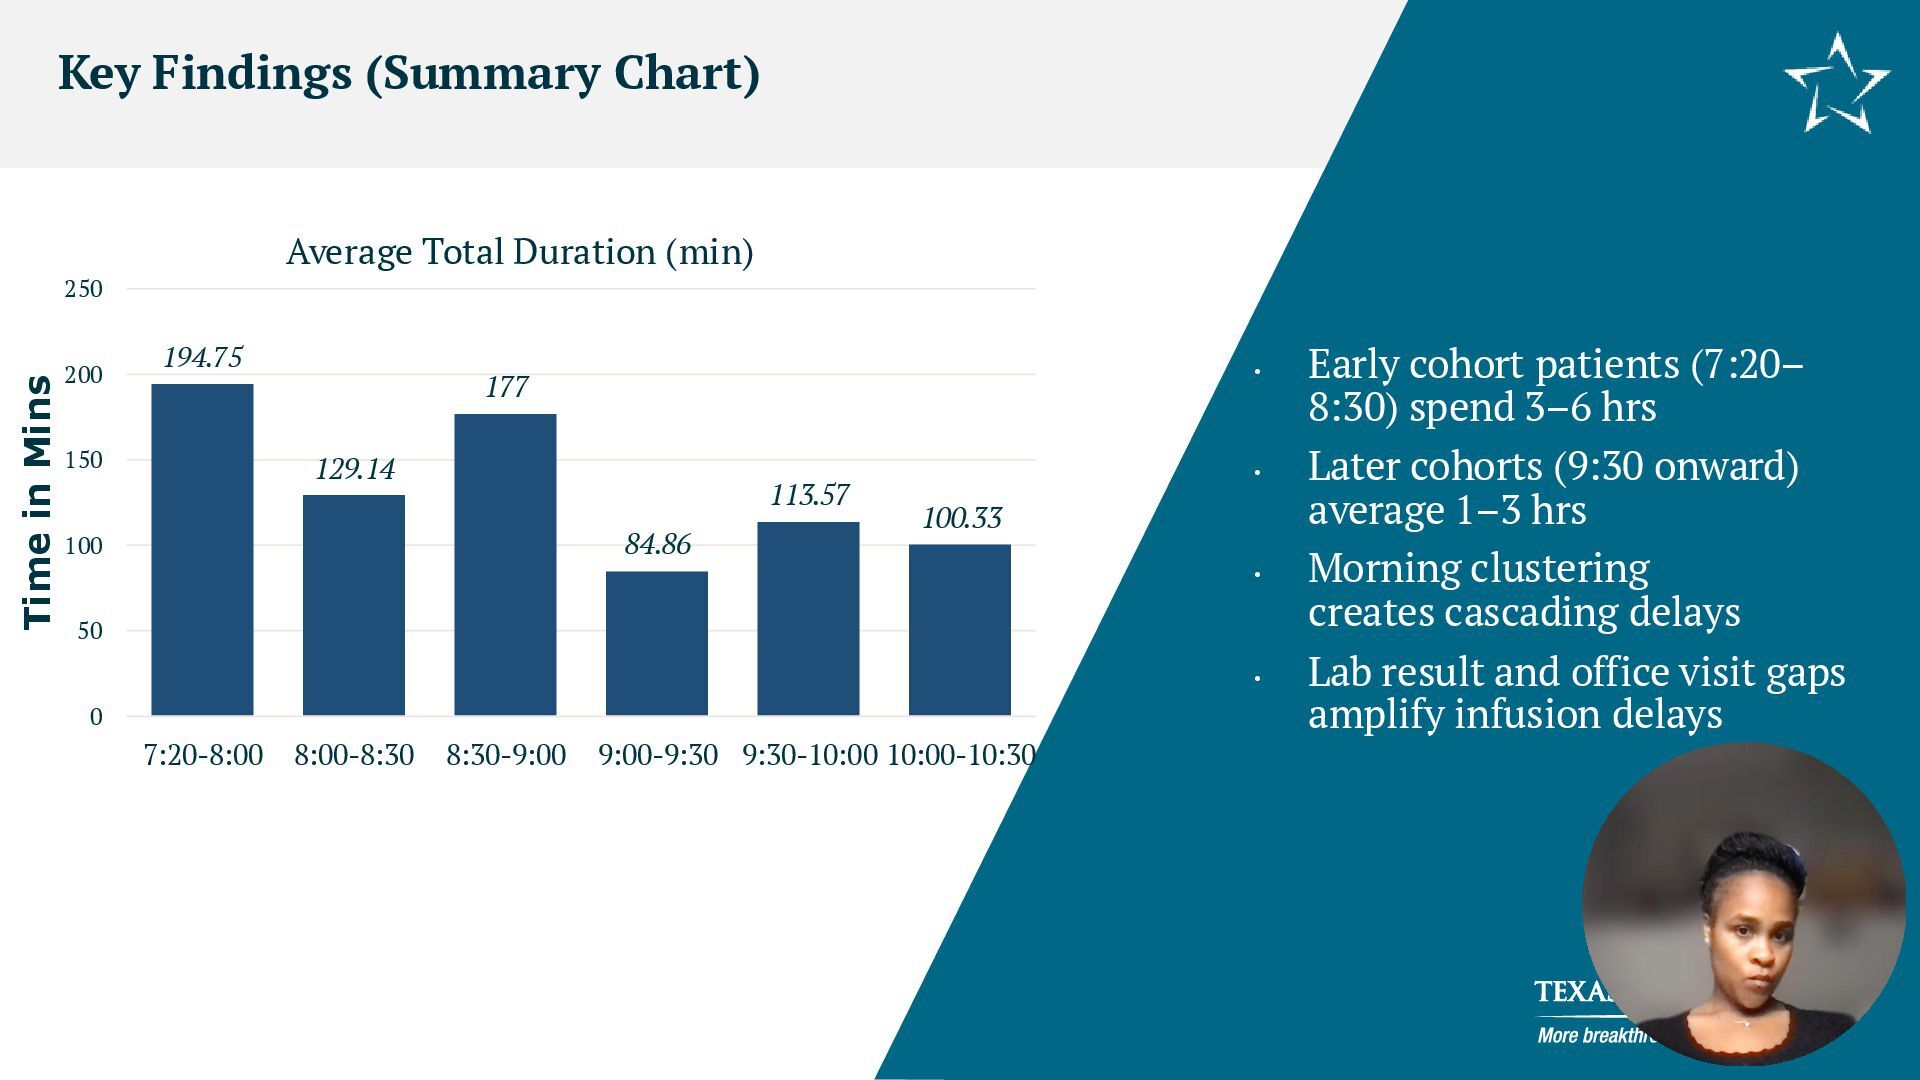
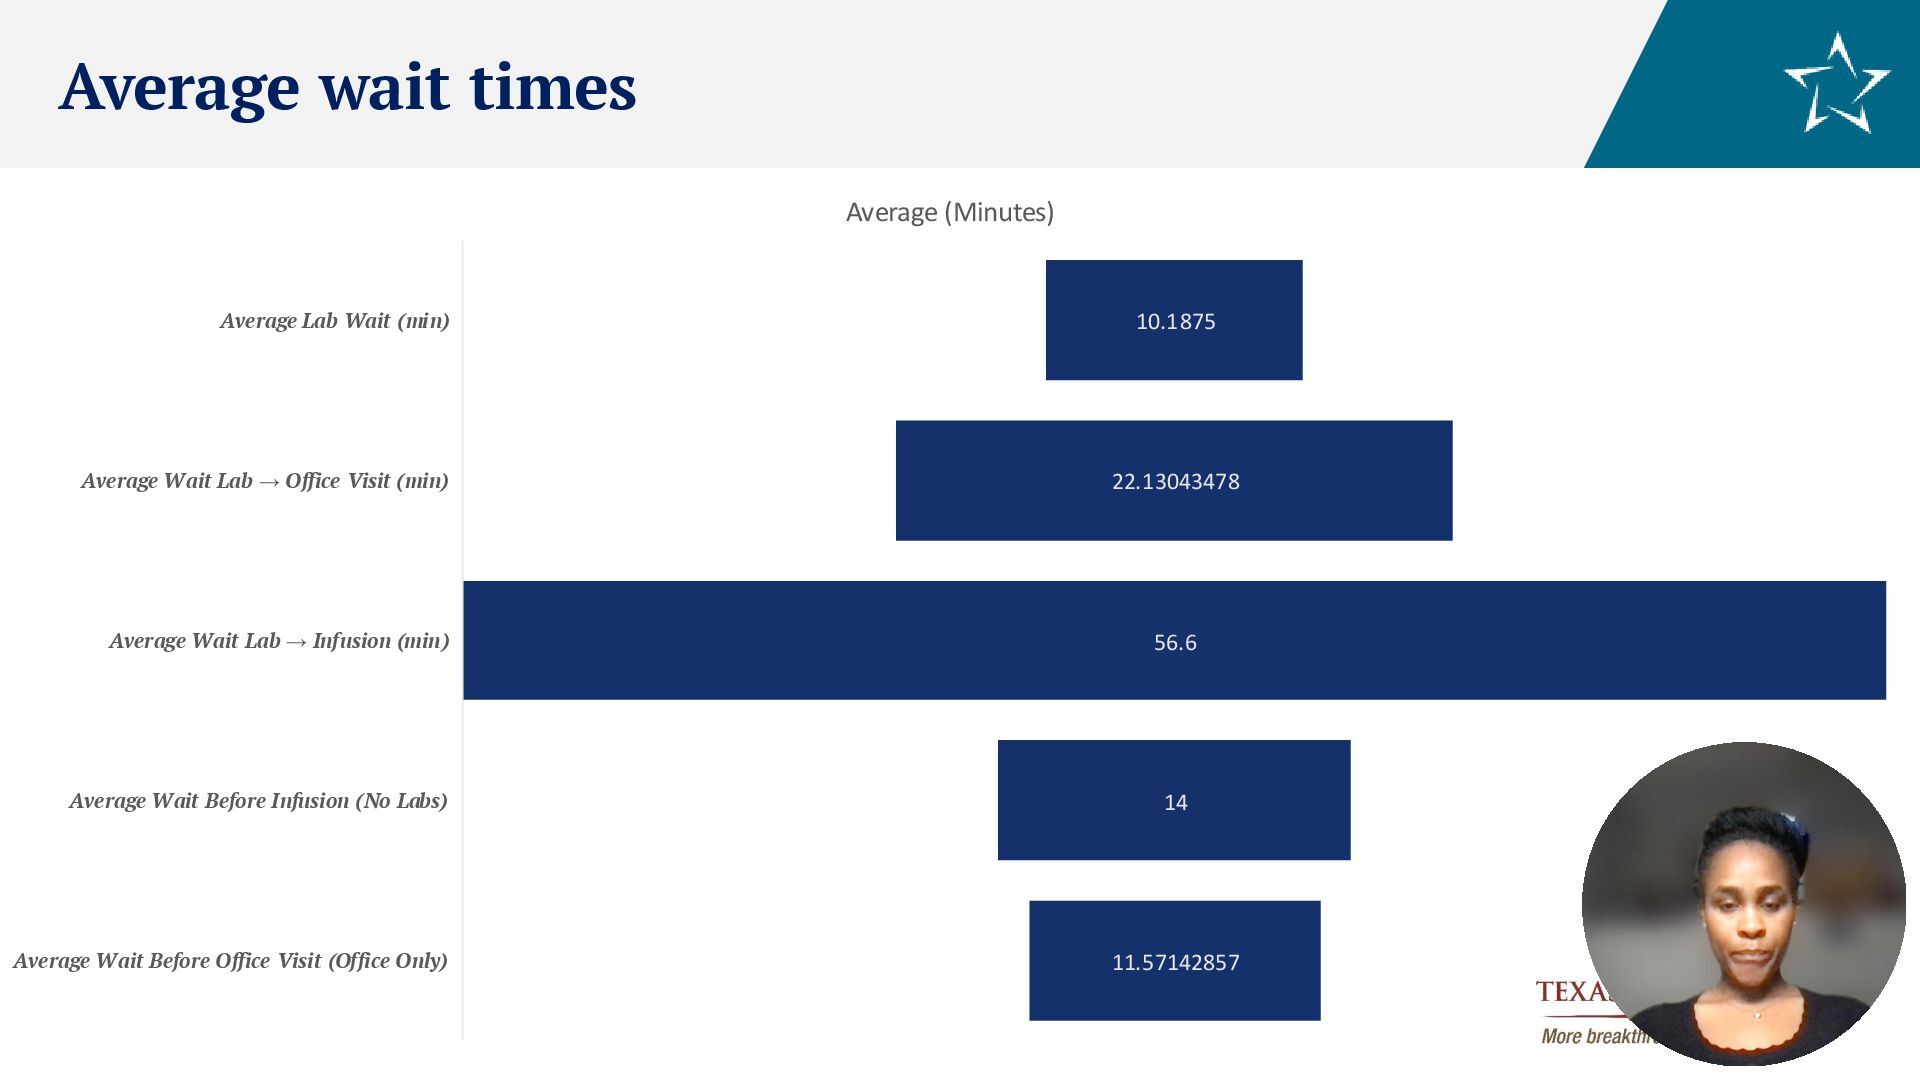
Wait (min) Average Wait Lab → Office Visit (min) Average Wait Lab → Infusion (min) Average Wait Before Infusion (No Labs) Average Wait Before Office Visit (Office Only) Average (Minutes)
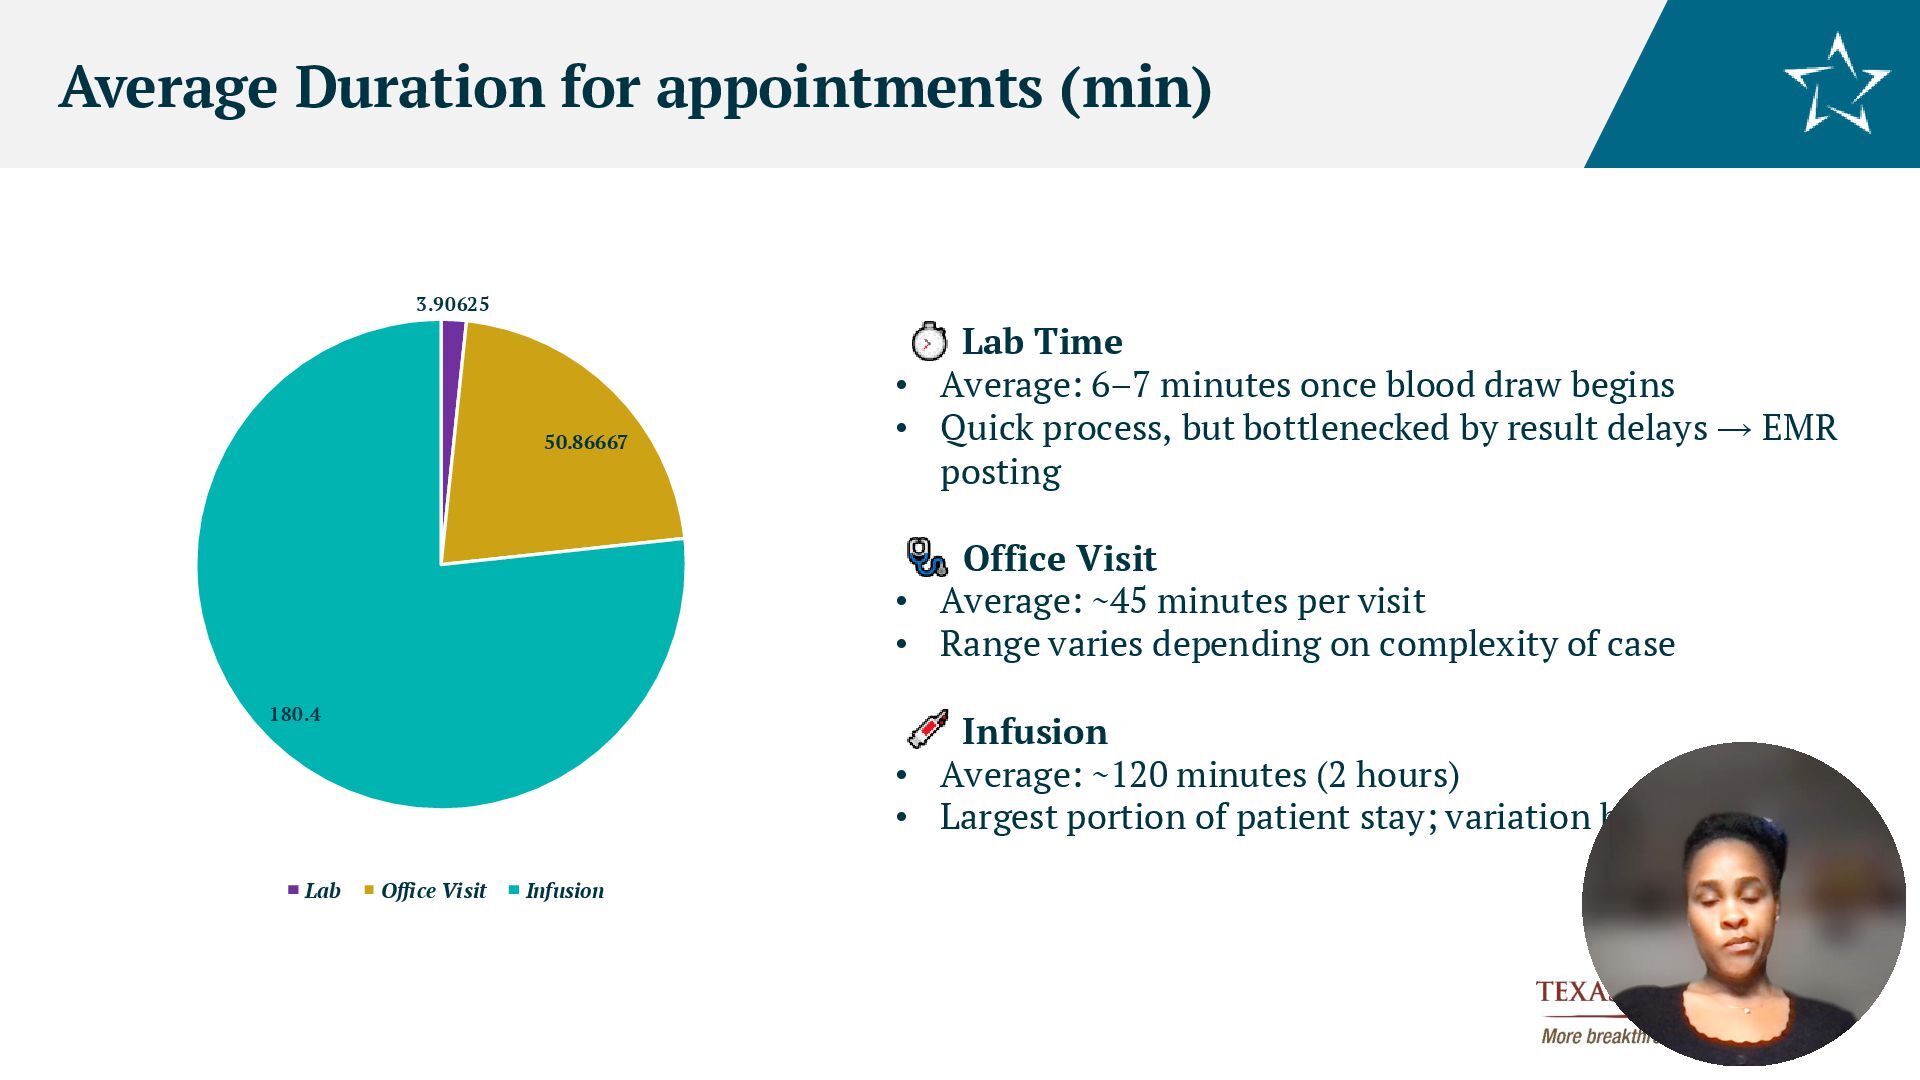
Visit Infusion Lab Time • Average: 6–7 minutes once blood draw begins • Quick process, but bottlenecked by result delays → EMR posting Office Visit • Average: ~45 minutes per visit • Range varies depending on complexity of case Infusion • Average: ~120 minutes (2 hours) • Largest portion of patient stay; variation by regimen
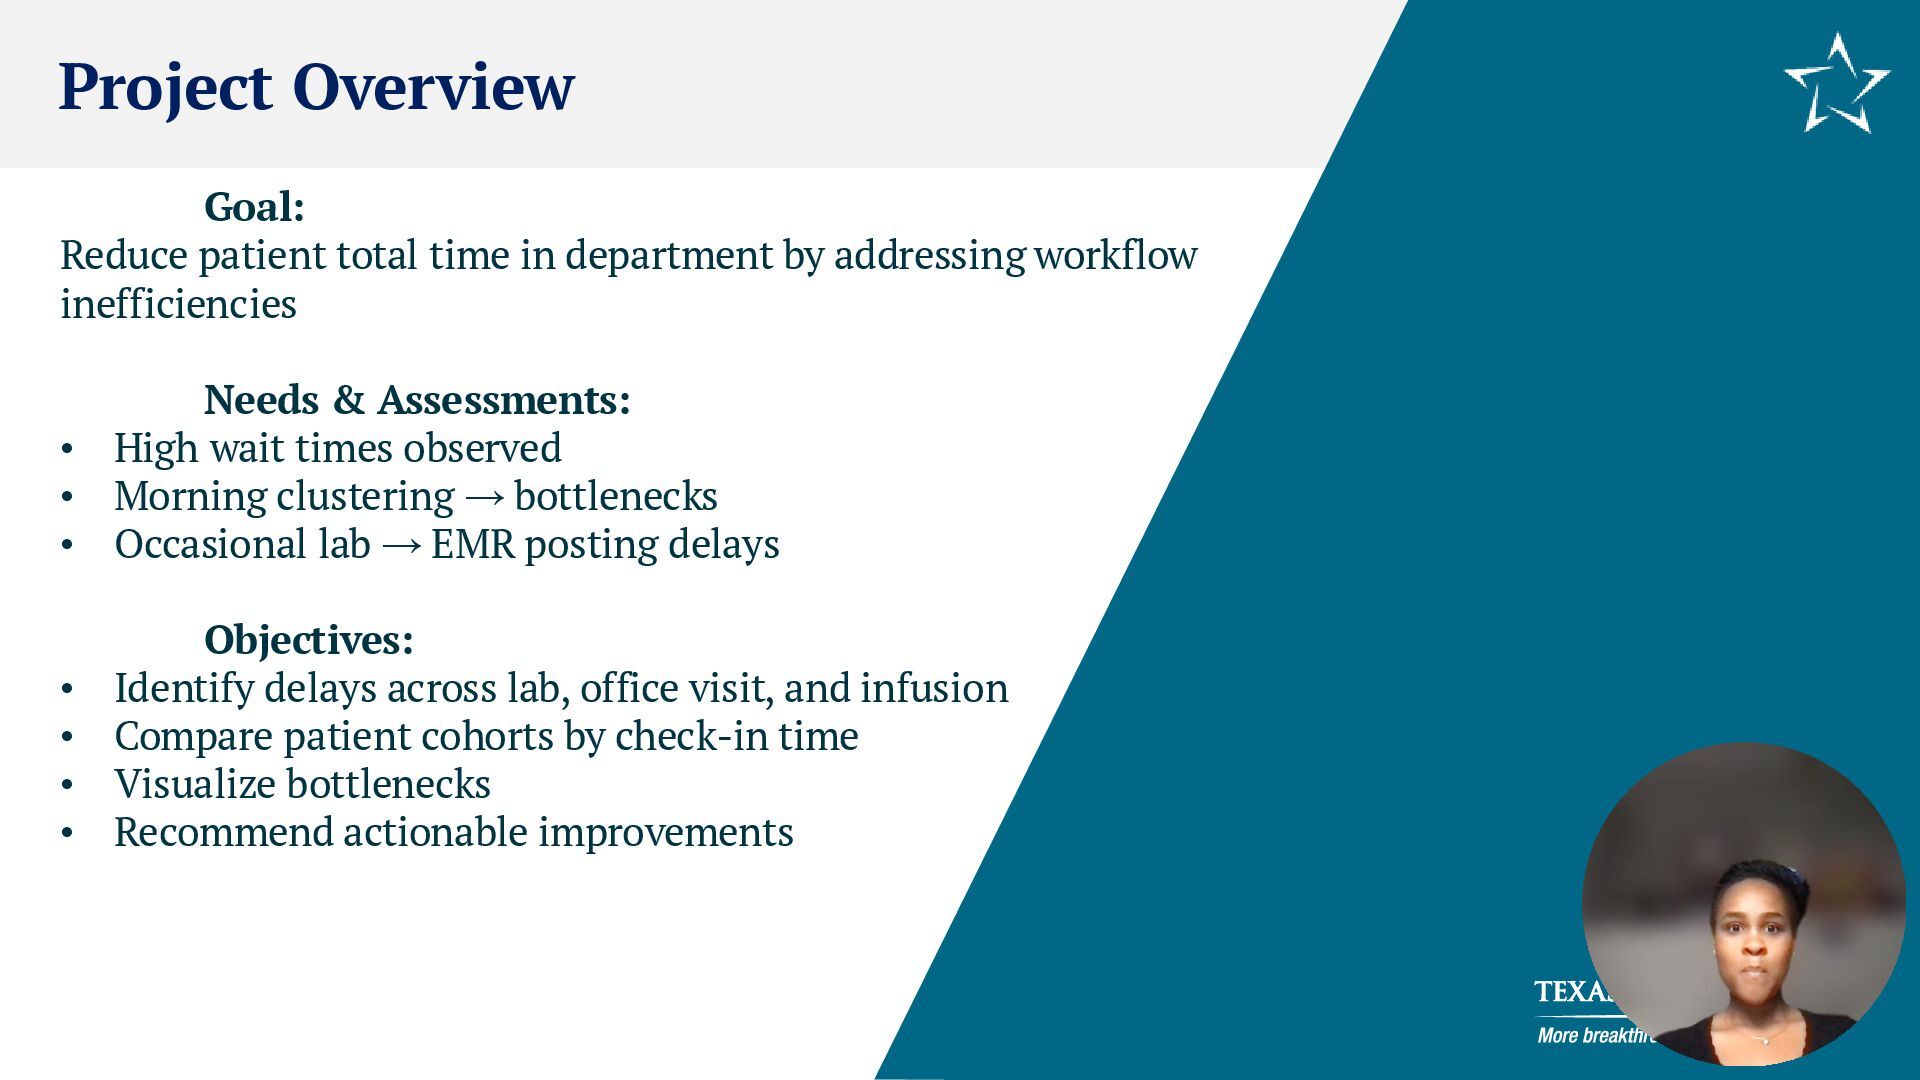
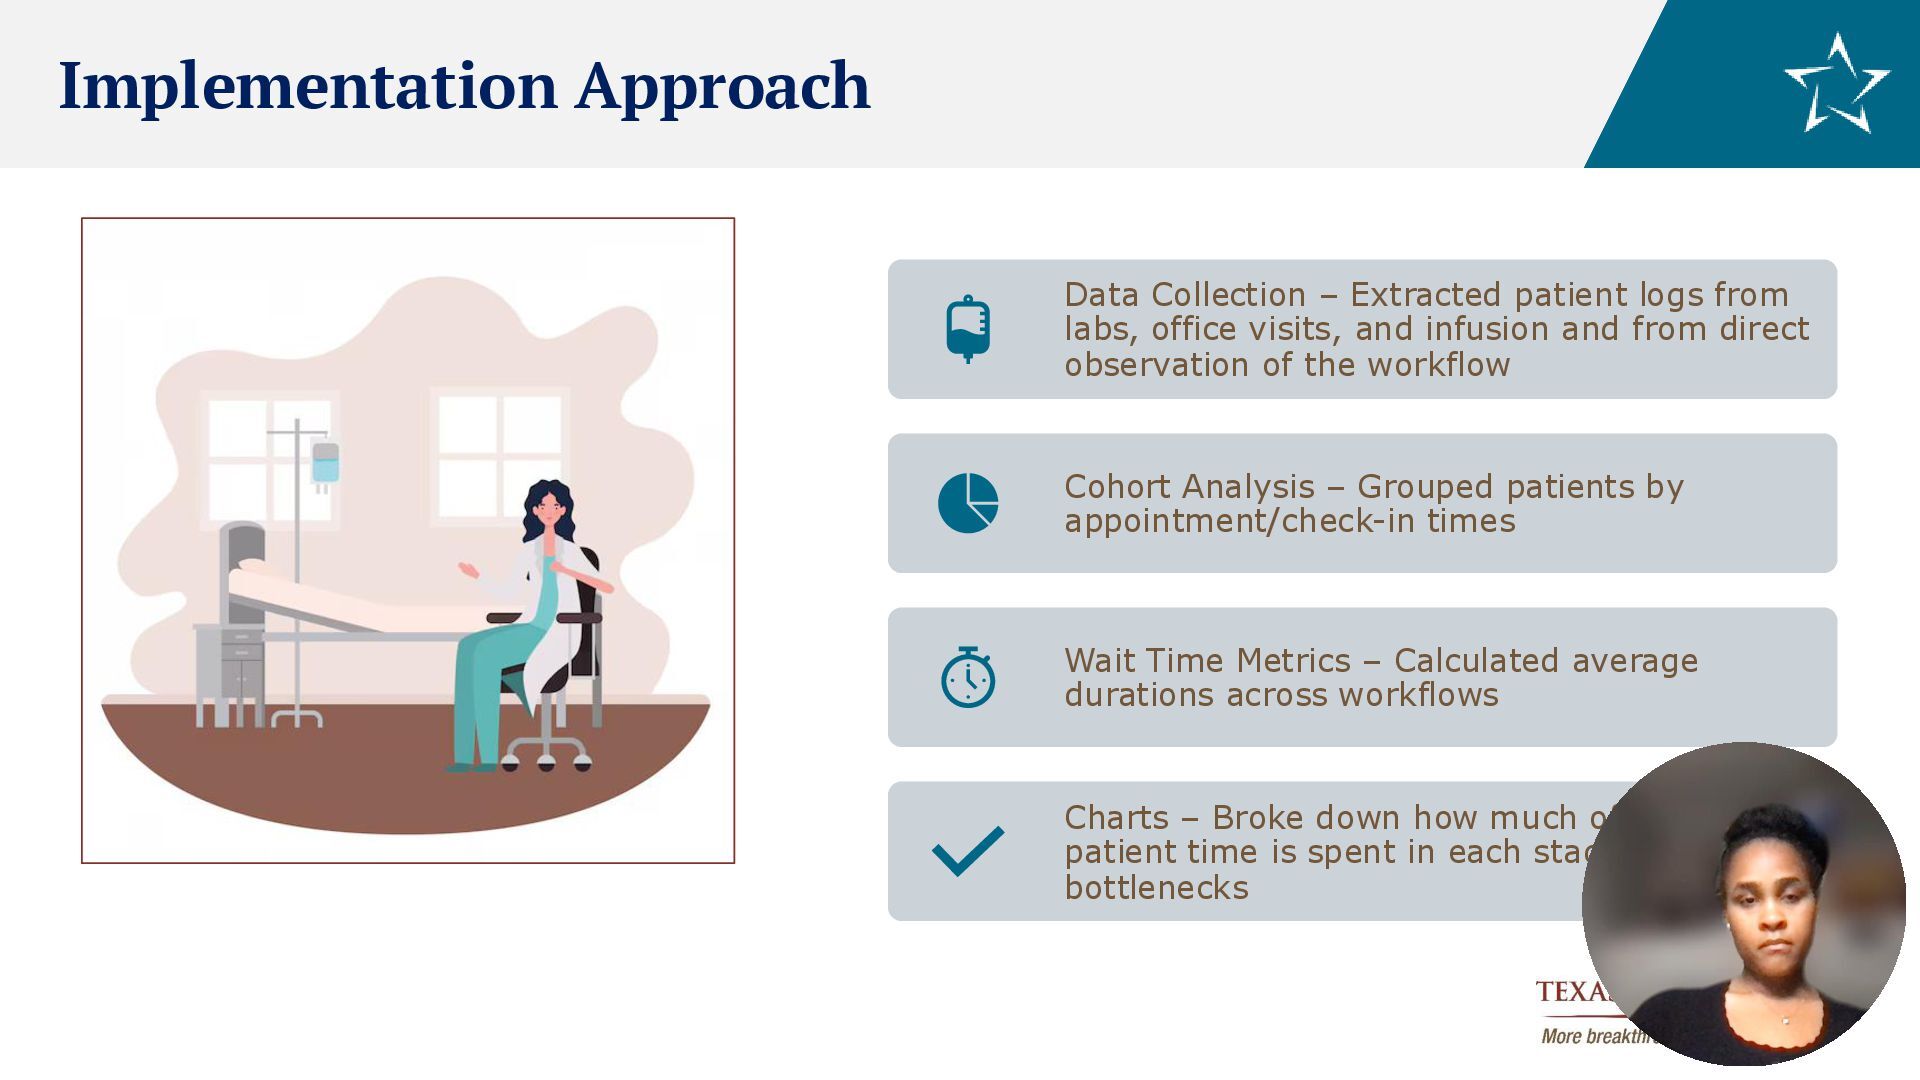
office visits, and infusion and from direct observation of the workflow Cohort Analysis – Grouped patients by appointment/check-in times Wait Time Metrics – Calculated average durations across workflows Charts – Broke down how much of total patient time is spent in each stage to highlight bottlenecks
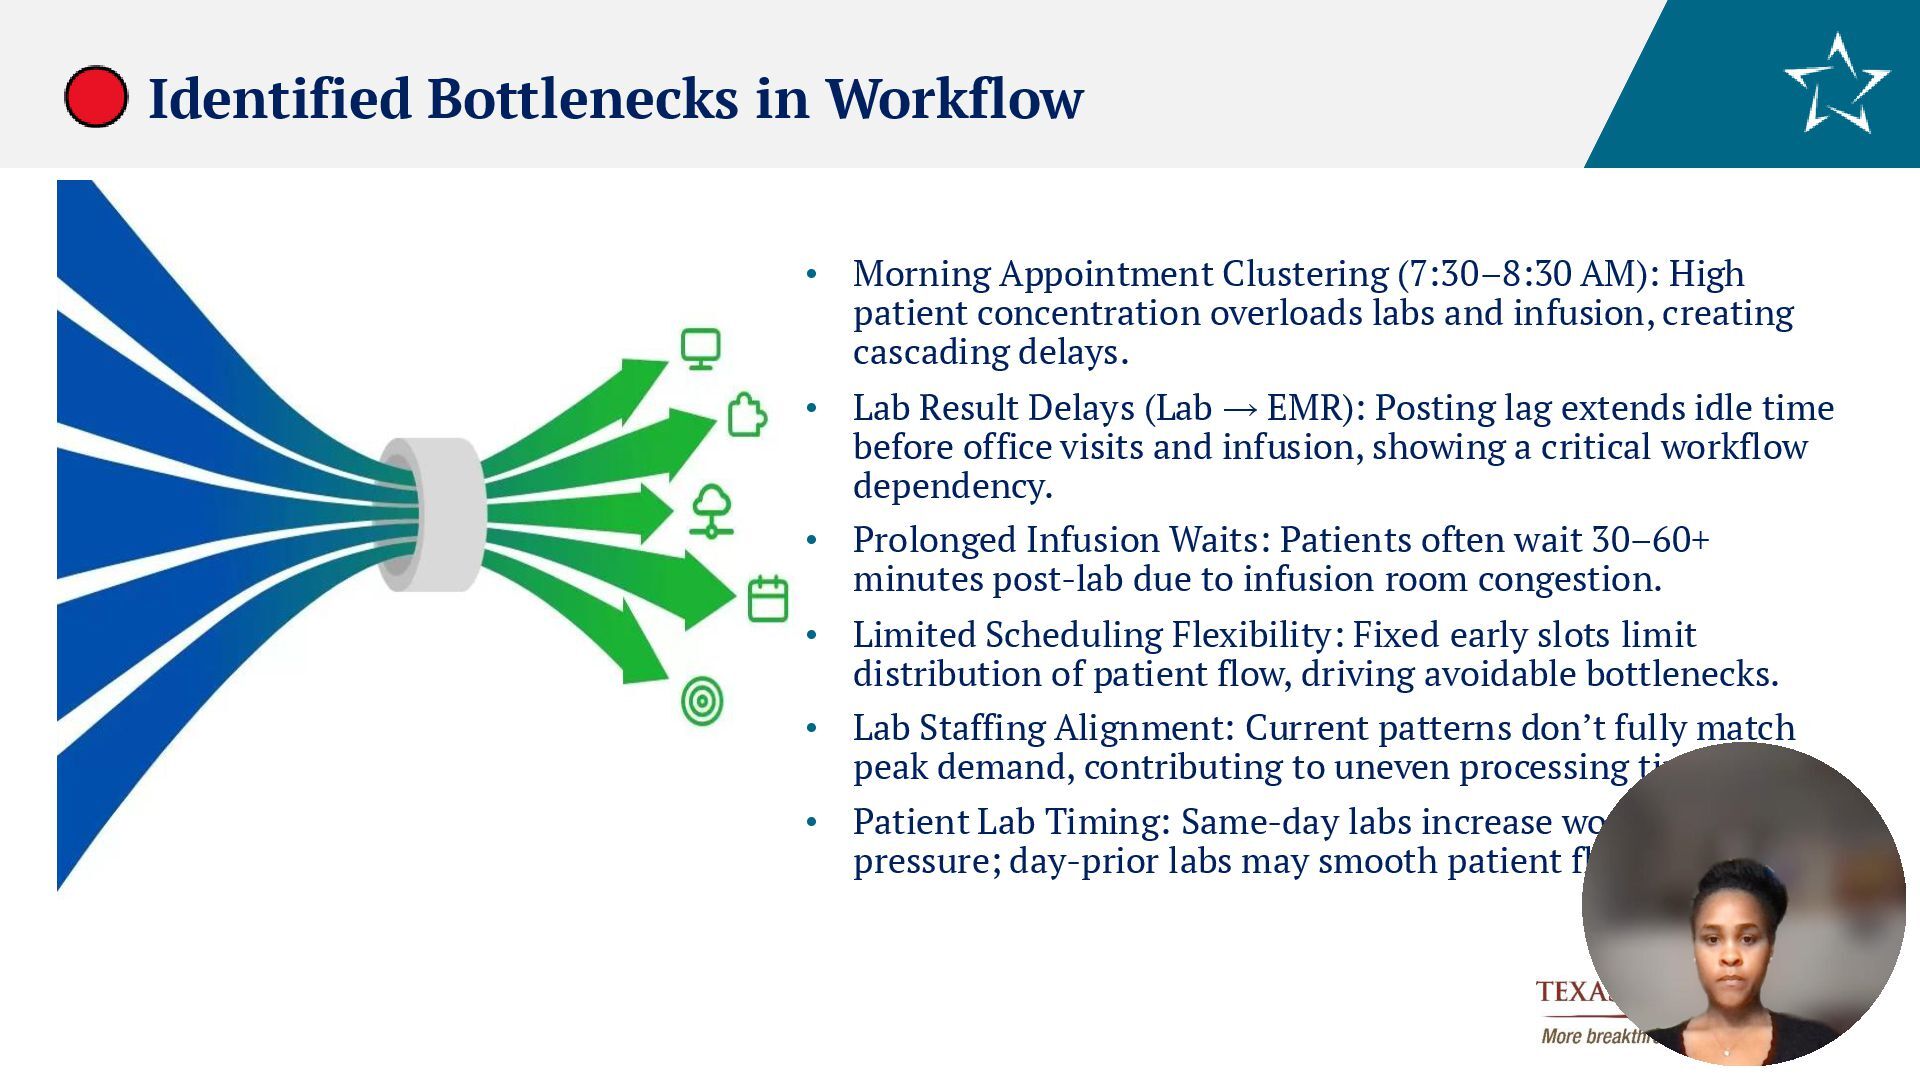
to test alternative flows during mapping. • Technology Limitations: EMR posting delays highlighted IT challenges that were outside the project scope to resolve. • Workforce Availability: Staffing shortages limited flexibility in exploring process adjustments. • Resource Constraints: Budgetary and equipment limitations restricted the ability to test higher-capacity scenarios. • Data Gaps: Some workflow steps (e.g., manual result posting, informal staff hand- offs) were harder to capture consistently.
and between appointments (labs, office visits, infusion) • Staff workload uneven, especially during morning clustering • Patient satisfaction impacted by delays and bottlenecks Anticipated with Proposed Solutions • Reduced Wait Times across all stages of care. • More balanced staff workload throughout the day • Improved patient satisfaction through smoother, more predictable flow • Baseline data established to support long-term scheduling and workflow improvements
continue to be referenced for scheduling and staffing reviews. • Findings integrated into ongoing huddles and quality improvement meetings. • Hand-off: Data and visuals shared with Travis Walters (Practice Director) to guide future initiatives. • Even if not continuously updated, the one- time analysis creates a reference point for future improvements.
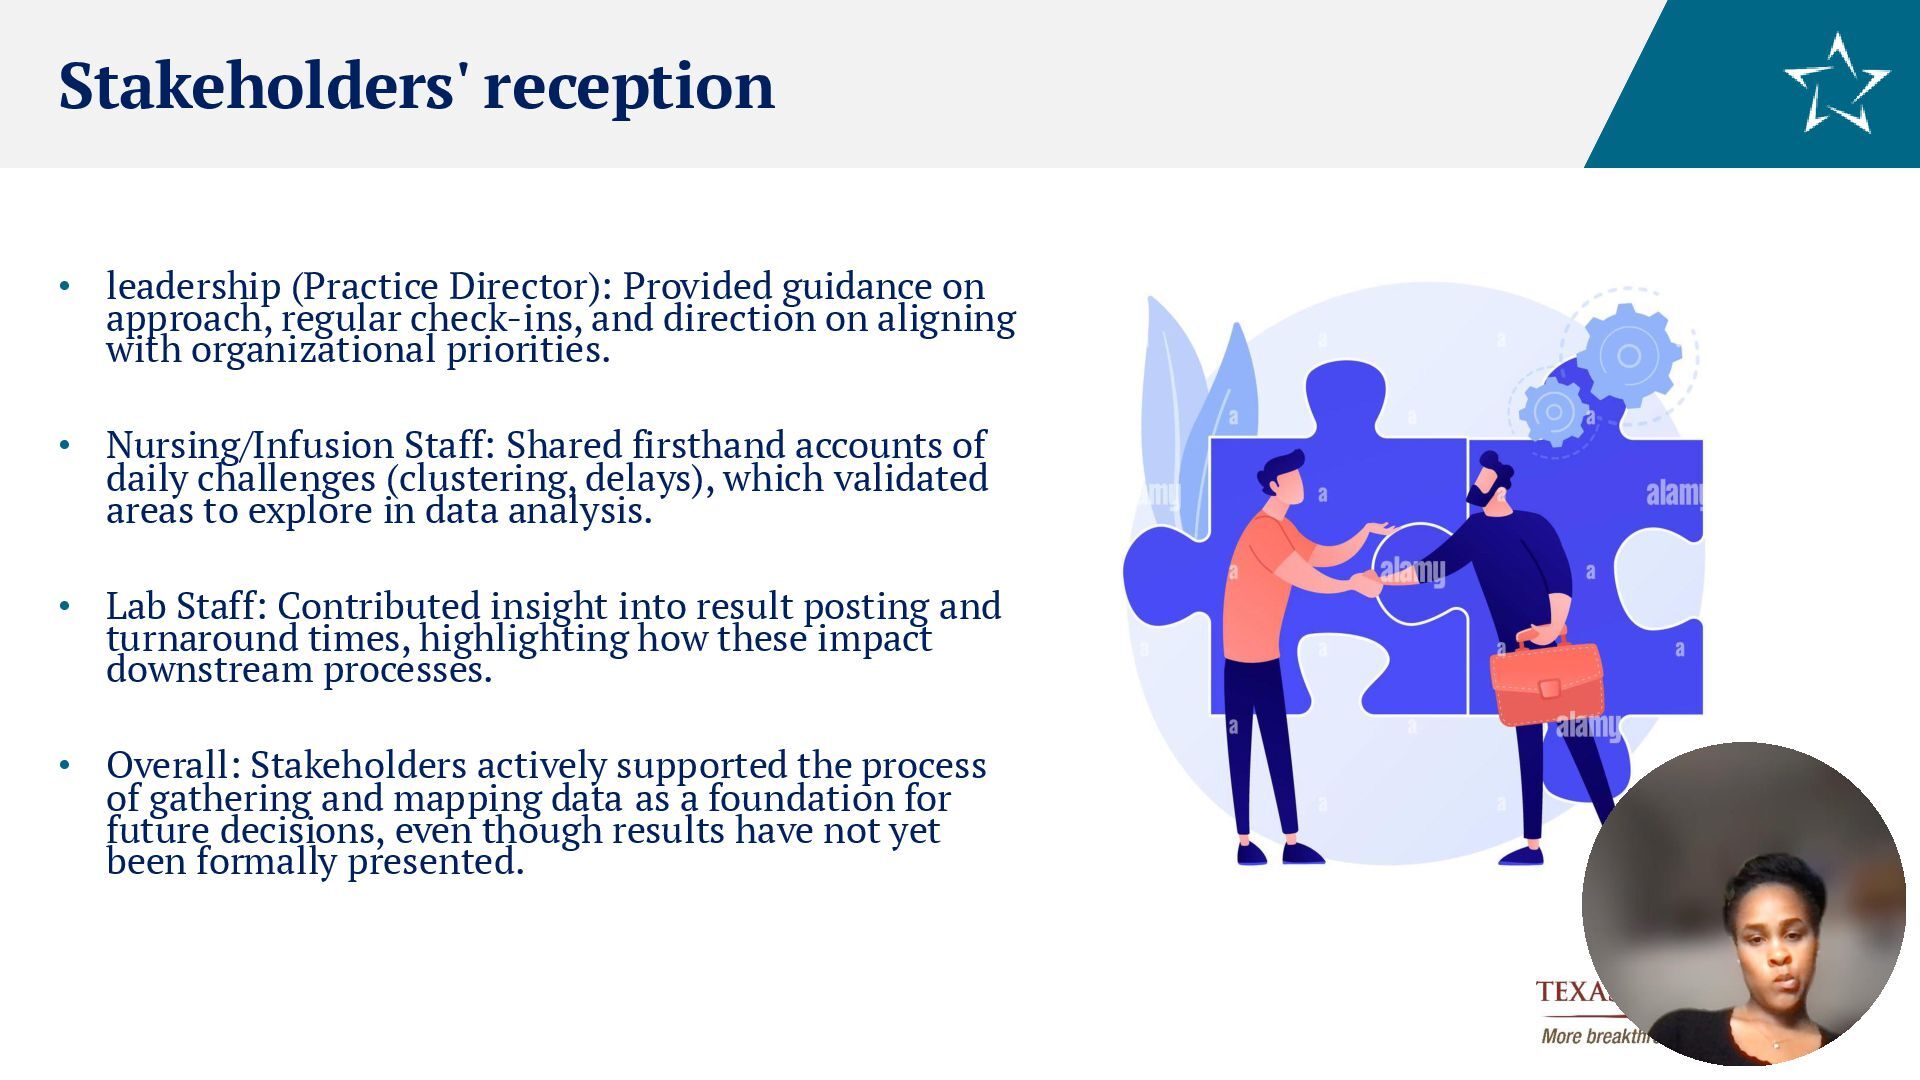
regular check-ins, and direction on aligning with organizational priorities. • Nursing/Infusion Staff: Shared firsthand accounts of daily challenges (clustering, delays), which validated areas to explore in data analysis. • Lab Staff: Contributed insight into result posting and turnaround times, highlighting how these impact downstream processes. • Overall: Stakeholders actively supported the process of gathering and mapping data as a foundation for future decisions, even though results have not yet been formally presented.
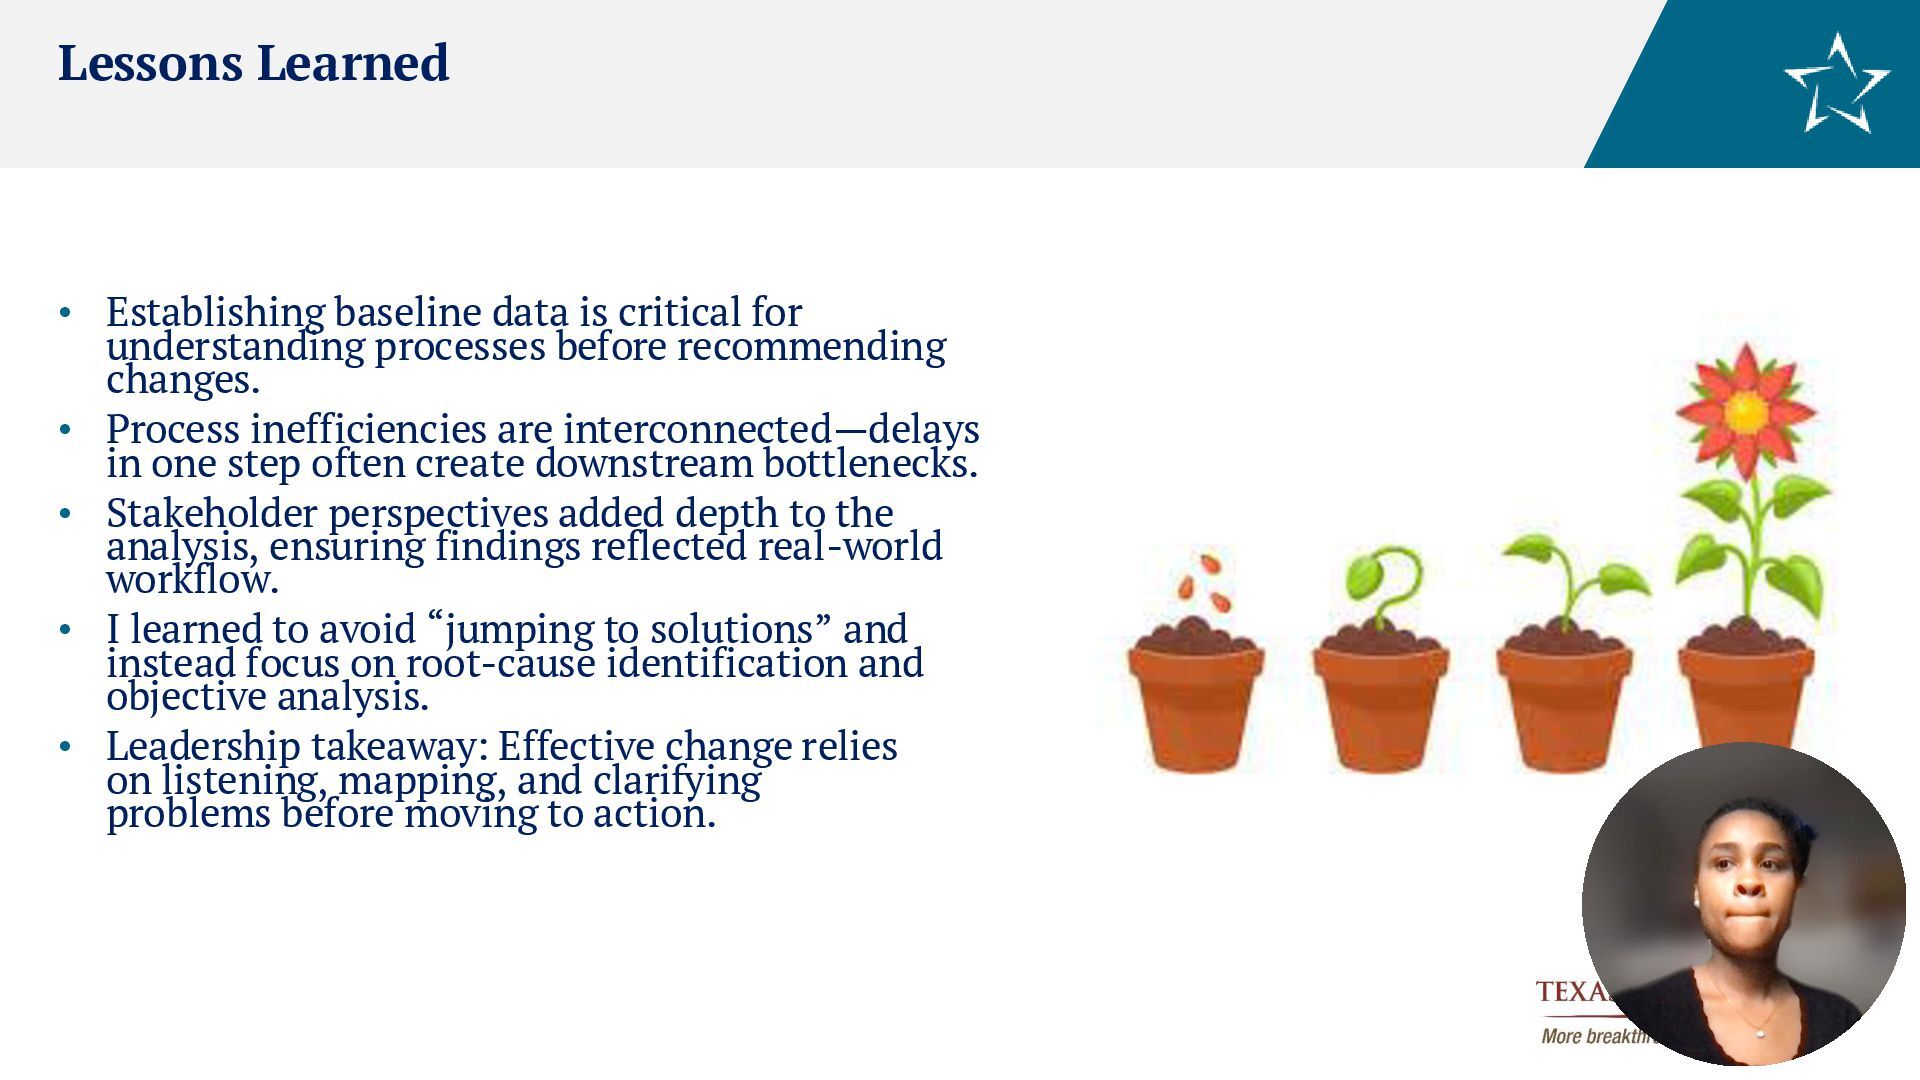
processes before recommending changes. • Process inefficiencies are interconnected—delays in one step often create downstream bottlenecks. • Stakeholder perspectives added depth to the analysis, ensuring findings reflected real-world workflow. • I learned to avoid “jumping to solutions” and instead focus on root-cause identification and objective analysis. • Leadership takeaway: Effective change relies on listening, mapping, and clarifying problems before moving to action.


 juanmartin2026
 cbtlibrary
 terazawa
 yoshimura_datam
 akiraasano
 pawan_pharm
 2720japanoke
 signer
 frievea
 mariooc
 terasawat
 techseoconnect
 retrage
 bermonpainter
 chriscoyier
 cargoodrich
 tmiket
 inesmontani
 popppiees
 tonyrice
 bryan
 aleyda
 reverentgeek