Upgrade to Pro — share decks privately, control downloads, hide ads and more …

Analytics toolbox

Analytics toolbox

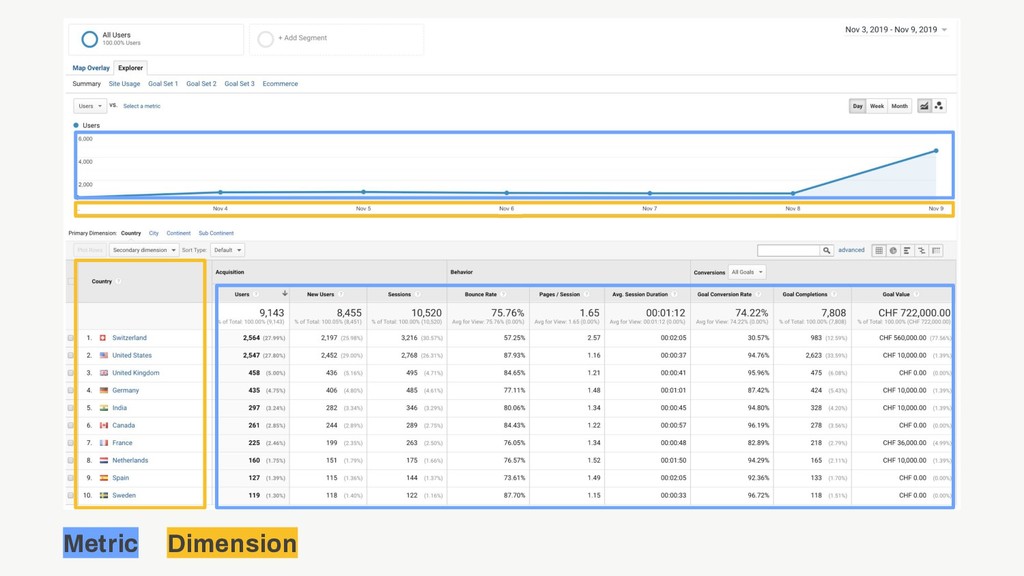
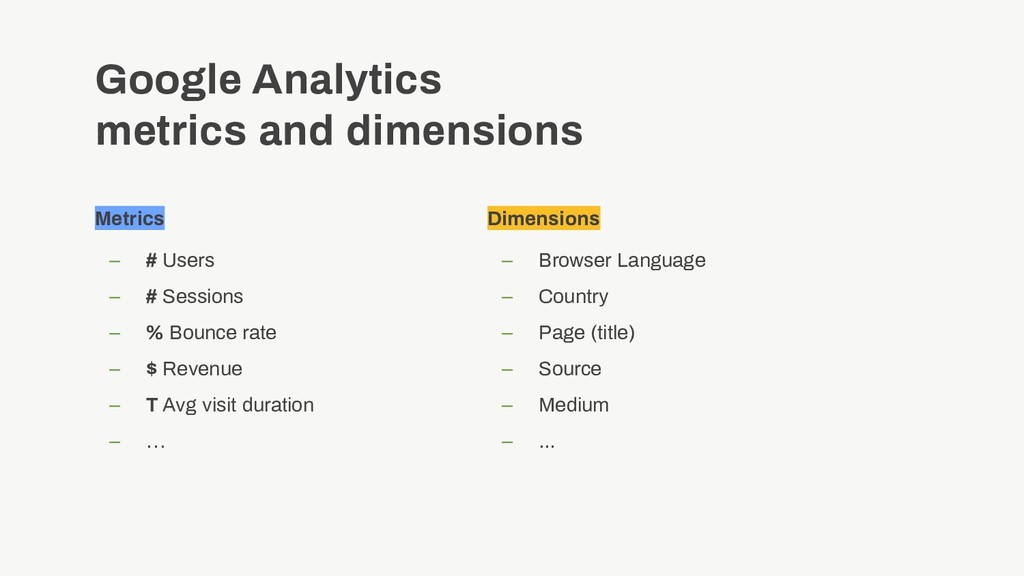
Page views, bounce rate, average time spent on a page, …
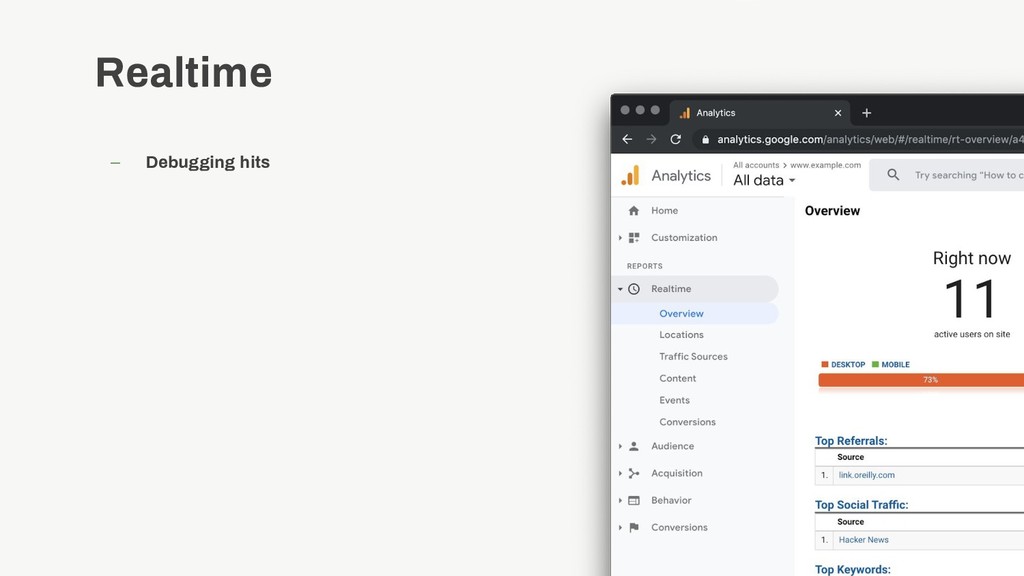
The Web analytics tools such as Google Analytics or Matomo give you access to plethora of data that can often overwhelm us.
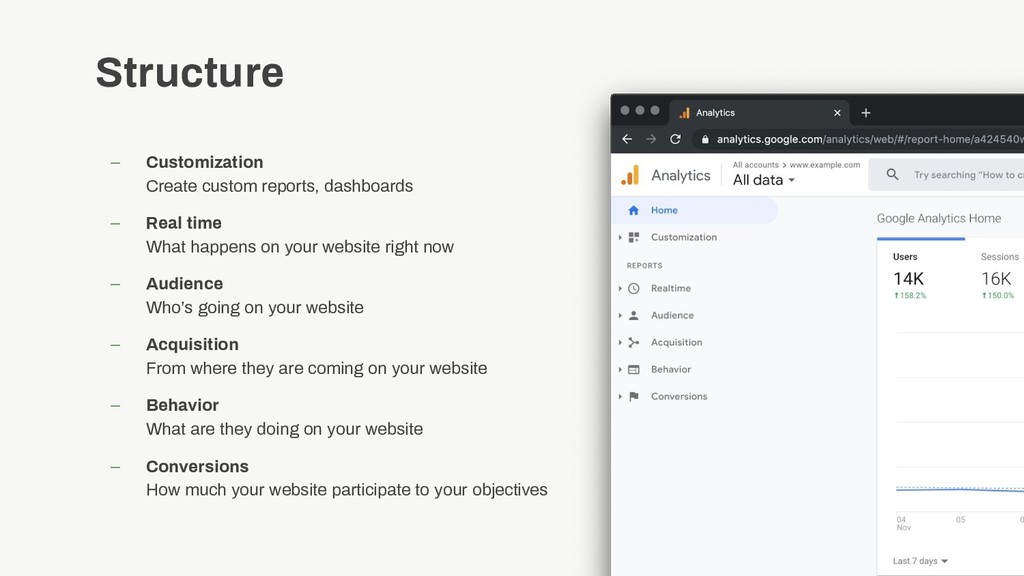
During this talk, you will discover step by step how to start to measure the performance of your website

Geoffroy Perriard

November 12, 2019
Tweet

More Decks by Geoffroy Perriard

Other Decks in Technology

Transcript

  1. – Geoffroy Perriard – Digital Analytics Consultant at Liip –

    Event organizer at Webmardi – Curious – Love history , architecture , swimming
  2. Having an overview on how you can measure how much

    your website is contributing to your business objectives
  3. Agenda – Talk – Metrics & dimensions – Tools availables

    on the market – Reporting structure in Google Analytics – Defining an objective to define the frame – Defining KPIs – Defining goals in Google Analytics – Going further – Resources – Question & answer – Quizz
  4. Metrics and dimensions A metric is a count, a ratio,

    a measurement, a stat – Number of people – Global revenue of an e-commerce A dimension puts a metric in a context – Realizing how the metric behaves in different contexts (segment) – Restrict the observation of a metric to a portion of the world (filter)
  5. Metrics and dimensions Example of metrics and dimensions: – 2048

    sessions coming from Switzerland – 28% of exit rate on the search results page – AVG of 2.5 minutes spend watching the introduction video – 46% of abandonment rate on payment step
  6. Google Analytics Free version Pro – Easy to setup –

    No server maintenance cost 360 - Paid version Pro – Unsampled reports – Higher limits (views, custom dims, ..) – Technical support Cons – Data hosted outside CH – Data sampling applies from 100’000 hits – No full access to the data Cons – Expensive
  7. Matomo On-premise (self hosted) Pro – Full control over the

    data – Hosted wherever you want – Practical oriented documentation Cloud Pro – Form tracking included – A/B testing solution included Cons – Server and system update costs – UI performance can get tricky over time – Missing custom report by default Cons – Hosted outside Switzerland – No 100% control over the data
  8. Other tools to consider Analytics – Fathom – Simple Analytics

    – Adobe Analytics – Hotjar – Crazy Egg – VWO Tag Management System – Google Tag Manager – Tealium IQ – Adobe Dynamic Tag Management Reporting – Google Data Studio – Tableau – Looker – Spreadsheet A/B testing – Google Optimize – Crazy Egg – VWO
  9. Google Analytics metrics and dimensions Metrics – # Users –

    # Sessions – % Bounce rate – $ Revenue – T Avg visit duration – … Dimensions – Browser Language – Country – Page (title) – Source – Medium – ...
  10. Structure – Customization Create custom reports, dashboards – Real time

    What happens on your website right now – Audience Who’s going on your website – Acquisition From where they are coming on your website – Behavior What are they doing on your website – Conversions How much your website participate to your objectives 24
  11. Audience – Number of users – Number of sessions –

    Geographical information – Device type – Device model – OS version – Browser – Browser version – Service provider – User flow
  12. Acquisition – Acquisition channels performance (source / medium) – Campaigns

    performance (all campaigns) – Organic keywords performance – Social media – Google Ads* – Google Search Console* * Need to connect to Google Ads and Google Search Console
  13. Behavior – Behavior Flow – All pages – Landing pages

    – Exit pages – Site Speed* – Site Search* – Events* * Need configuration in the UI and the code
  14. Conversions – Goals* – Funnel Visualisation* – Shopping behavior* –

    Checkout behavior* – Product performance* – Sales performance* – Top Conversion Path – Time Lag * Need configuration in the UI and the code
  15. 1. Gather stakeholders in a room (1 animator for 2

    stakeholder) 2. Define business objectives during a 5 min. brainstorming with post-it 3. Define website missions during a 5 min. brainstorming with post-it 4. Prioritize business objectives and missions Prioritizing is the key. You won’t be able to satisfy all stakeholders’ desires. Reassure them and remember you can always improve in the future. How to define objectives?
  16. Website mission A website or an app rarely has a

    single mission. The channel often supports many activities through several touchpoints. 33 leshop.ch missions, as an example: Provide home-shopping and delivery experience Inform about Migros products and brands ... What do you expect your website to achieve for you? What is the purpose of each content / function on your website? Phrase each mission starting with a verb
  17. Business objectives Missions align to objectives / activities. 34 leshop.ch

    example: Provide Home-shopping … experience Inform about Migros supports and donations Inform about Migros products and brands Increase sales Increase brand awareness Which of your business objectives/activities do those missions fulfill/support? Write down your entreprise objectives
  18. Why do we need KPIs? Challenges – We can’t make

    sense of too much information. – We should not waste time staring at data. We need to understand how successful are the things we pilot.
  19. – As early as possible in the product life cycle

    by defining what you consider as a success for your new product – Before adding a new feature by assessing wherever that new feature supports your objectives or not – When you need to define a common direction for your product with stakeholders, projects members, developers, public target When to define KPIs?
  20. A good KPI ... – speaks of your business objectives,

    – bases on reliable, accurate and obtainable data, – keeps everyone & moving in same direction, – serves the business, not the ego, – supports concrete actions you could take, – is regularly revised to accompany business evolution.
  21. Monitoring vs Exploring Monitoring Looking at the same KPIs and

    at their evolution in repeated manner and from the same point of view. Exploring Making sense of data through statistical and graphical enquiries in a sequential and non-deterministic way.
  22. 1. Gather stakeholders in a room (1 animator for 2

    stakeholder) 2. Define one KPI per mission, by assigning missions to stakeholder starting with the most important ones using the KPI sheet 3. Compare your results together Favorise qualitative results over quantitative results. You might not be able to define one KPI per mission. Guide them and remember you can always improve in the future. How to define KPIs?
  23. Key metrics Key metrics allow to measure the success towards

    each mission. 42 leshop.ch example: Provide home-shopping and delivery experience Inform about Migros products and brands ... Increase sales ... # Number of sales # Number of views on products % Conversion rate by sessions What key metrics can truly measure each mission’s success? Use one sheet per metric
  24. How can you make those metrics even more accurate? Do

    we want to have the number for all pages? All audiences? Filter segment Filter segments ensure the metric data is pertinent to the market/activity by only considering it on the right audience / content / behaviour segment. Leshop.ch example: Provide home-shopping and delivery experience ... Increase sales ... Number of sales - from swiss traffic
  25. What dimensions will help you interpret that metric? What’s interesting

    to know about that metric? Key dimensions Key dimensions enrich the interpretation of the metric and initiate exploration. Leshop.ch example: Home-shopping and delivery experience ... Customer retention ... Number of sales - from swiss traffic ... per month ... par product type
  26. Leshop.ch example: How will you interpret that metric’s value? When

    does it mean success or failure? Metrics objective / thresholds When does the metric mean success, danger or failure? Home-shopping and delivery experience ... Customer retention ... Number of sales - from swiss traffic ... per month ... per product type threshold : 6000 / month
  27. Using goals – Destination When user lands on contact form

    confirmation page – Event When user click on a paiement button – Session duration When user spend more than 2 minutes – Pages per session When user loads more than 5 pages
  28. Valuable indicators in Google Analytics – Conversions per acquisition channel

    – Conversions per organic keyword – Conversions per country – Timeline of conversions per months – Shopping behavior report (abandonment) – Checkout behavior report (abandonment) – Funnels (abandonment) – Unique pageviews by content type – Internal keywords by uniques searches and site exits after search
  29. Increasing conversion – Search Engine Optimization (SEO) – Ads –

    Personalization – A/B Testing – Multivariate Testing
  30. Resources Mentors – Avinash Kaushik – Simo Ahava – Benoît

    Pointet Books – The Big Book of Dashboards: Visualizing Your Data Using Real-World Business Scenarios by Jeffrey Shaffer and Andy Cotgreave Online resources – Google Analytics Academy – Matomo documentation and blog – Google Analytics dimensions & metrics explorer
  31. Recap 1. Define an objective 2. Define KPIs 3. Setup

    measurement (Google Analytics, Matomo, …) 4. Define action plan (A/B Testing, SEO, …) 5. Report on performance 6. Iterate
  32. Keep in mind to: – Prioritize – Collaborate with expert

    (devs, digital analytics) – Iterate, make smaller steps – Interpret web analytics figures as trends not absolute numbers Recap
  33. Thank you I would be happy to assist you in

    - Defining your goals - Setuping your web analytics tool - Monitoring your goals Geoffroy Perriard Digital Analytics Consultant [email protected]