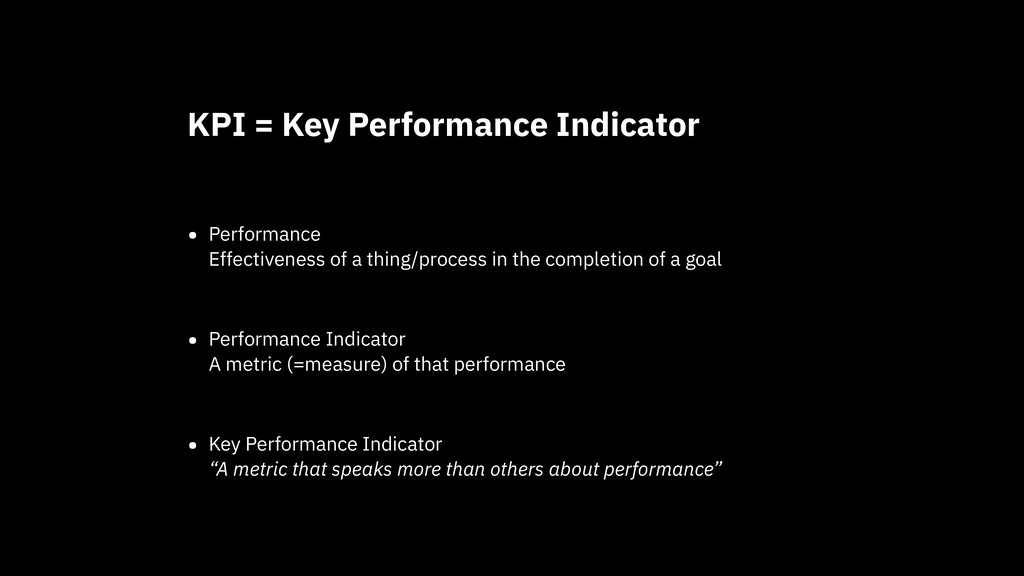
a goal • Performance Indicator A metric (=measure) of that performance • Key Performance Indicator “A metric that speaks more than others about performance” KPI = Key Performance Indicator
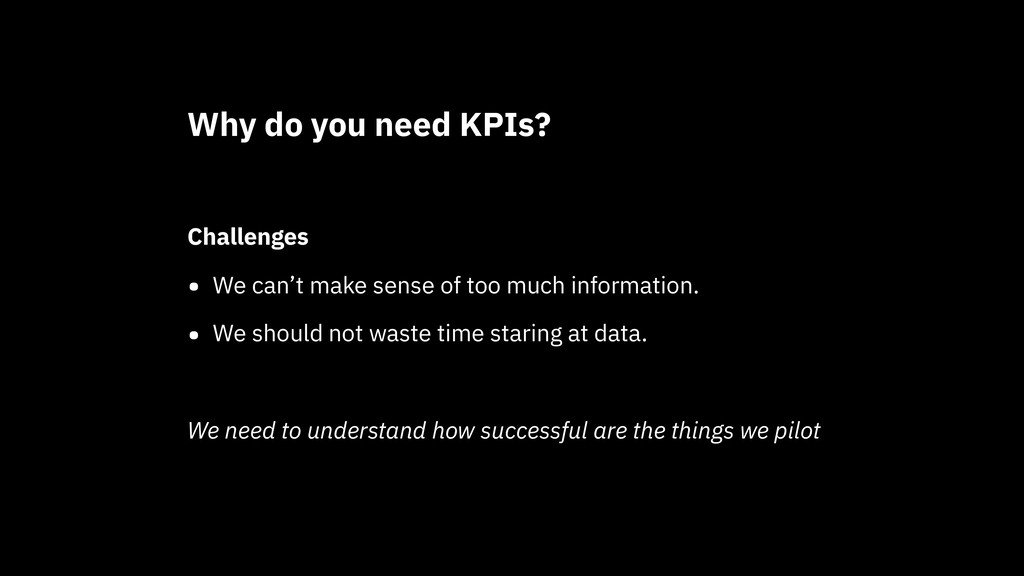
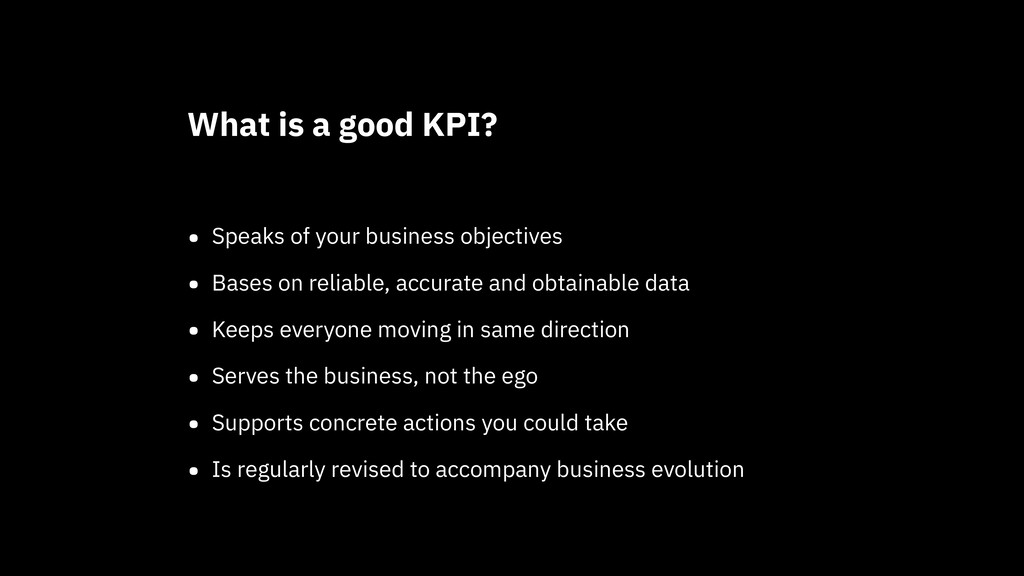
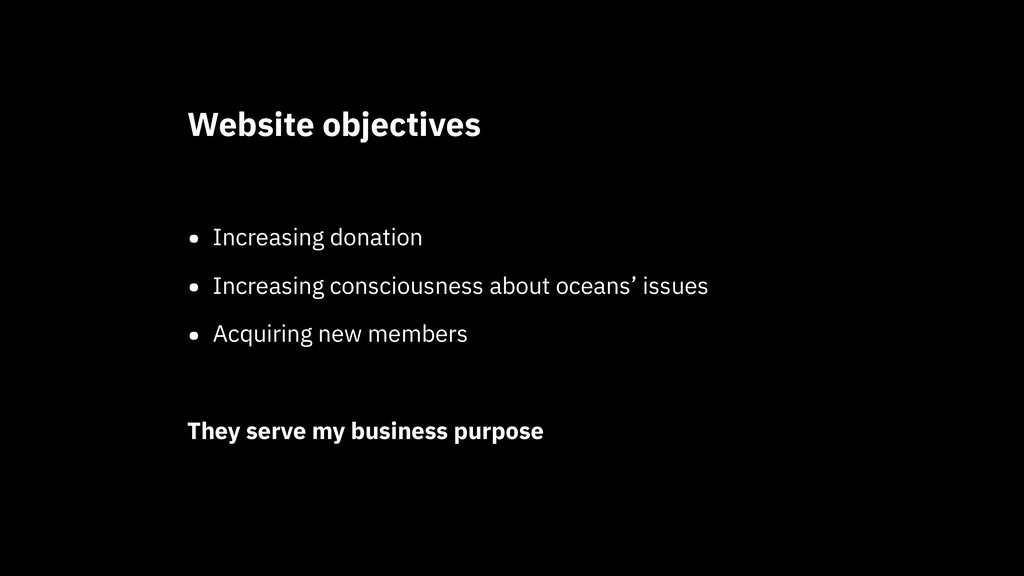
accurate and obtainable data • Keeps everyone moving in same direction • Serves the business, not the ego • Supports concrete actions you could take • Is regularly revised to accompany business evolution What is a good KPI?
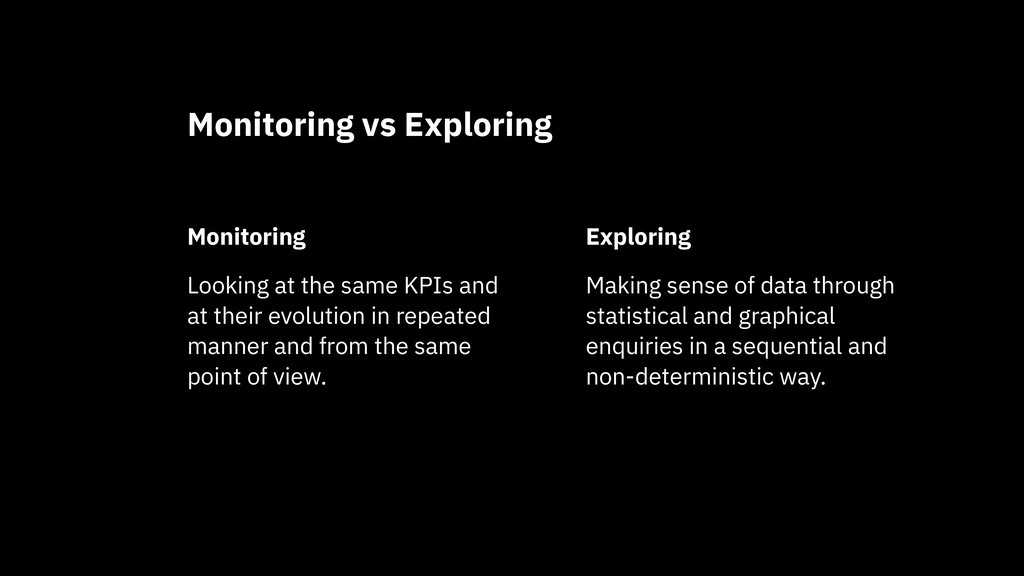
in repeated manner and from the same point of view. Monitoring vs Exploring Exploring Making sense of data through statistical and graphical enquiries in a sequential and non-deterministic way.
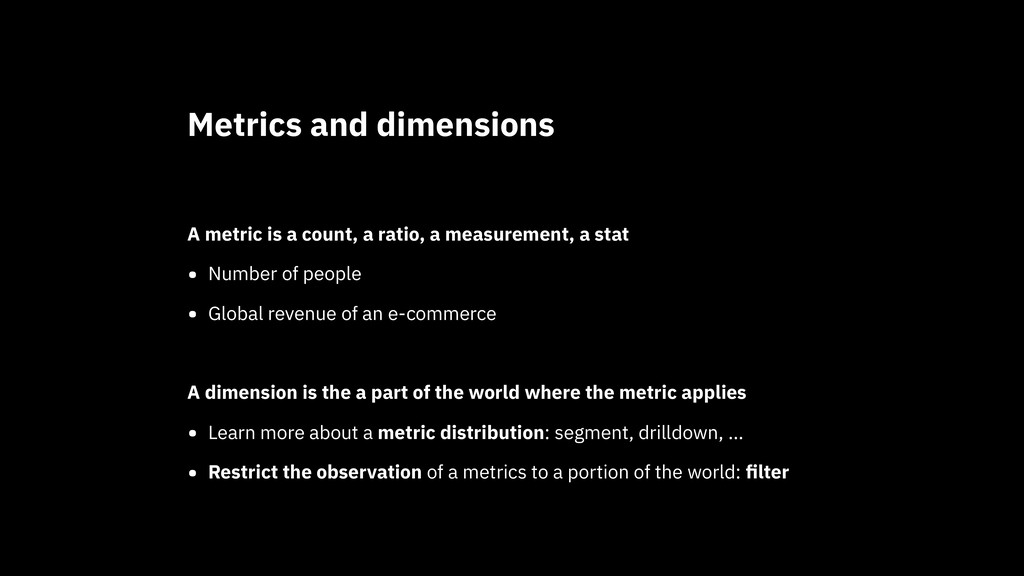
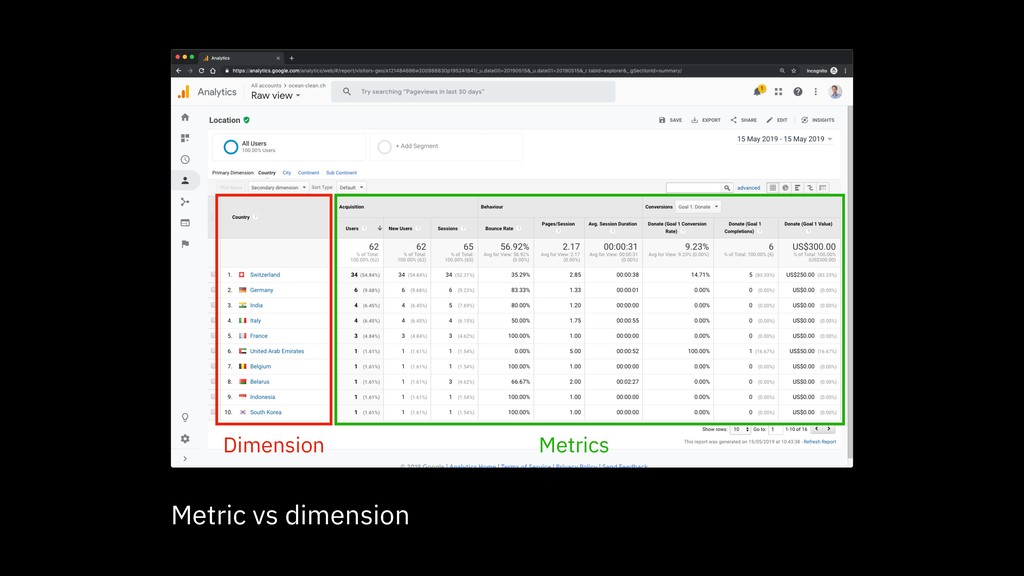
stat • Number of people • Global revenue of an e-commerce A dimension is the a part of the world where the metric applies • Learn more about a metric distribution: segment, drilldown, ... • Restrict the observation of a metrics to a portion of the world: filter Metrics and dimensions
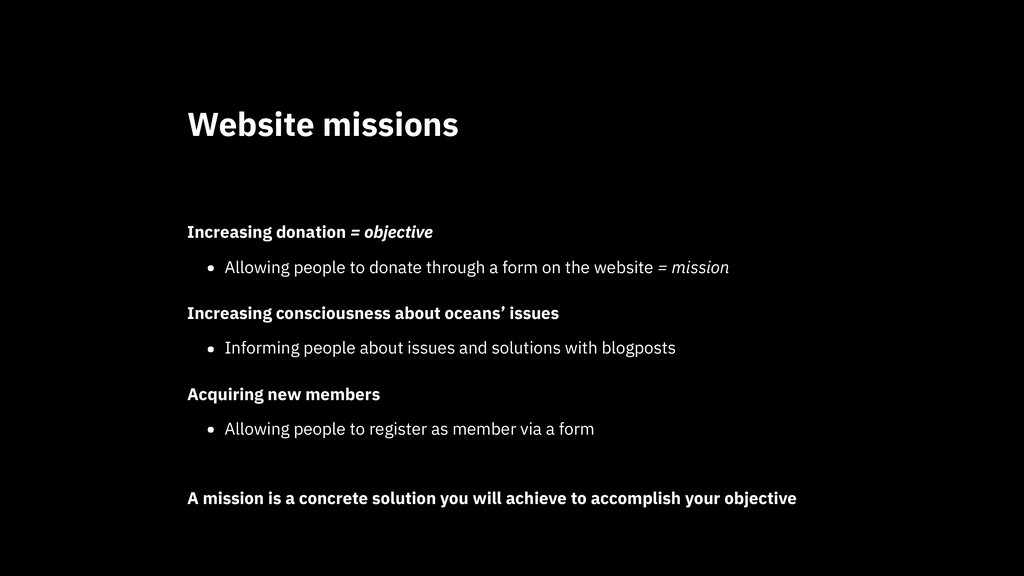
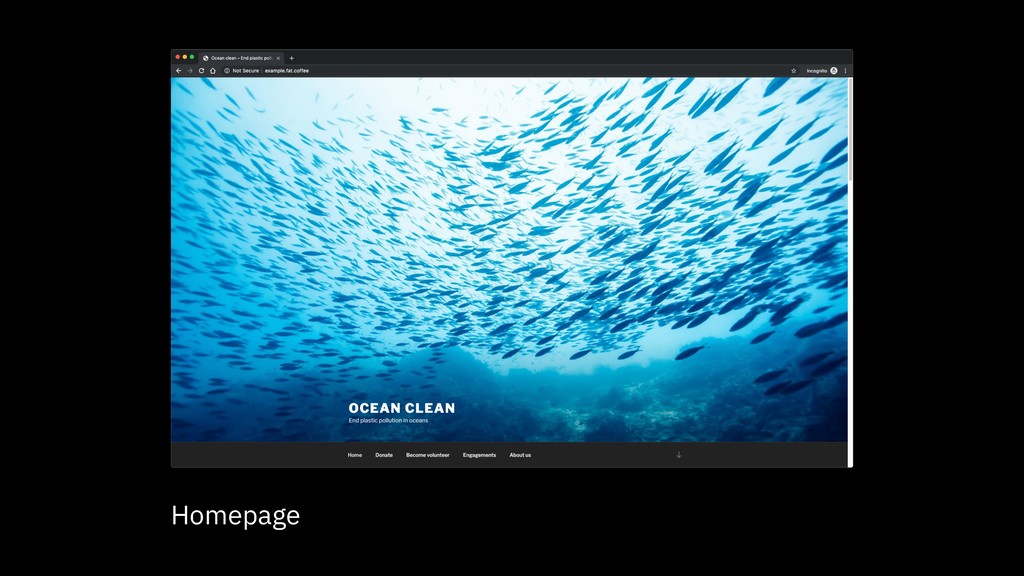
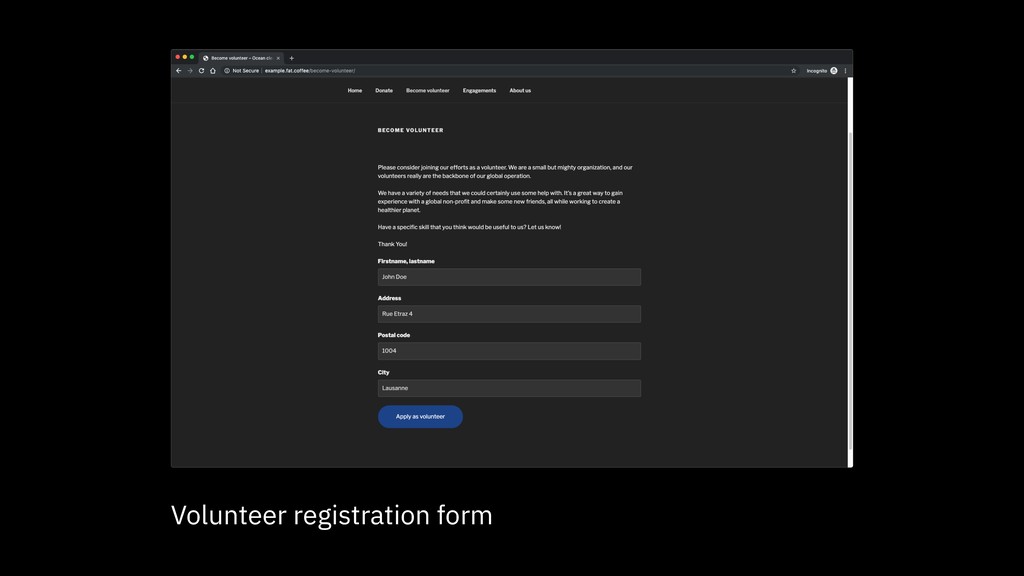
a form on the website = mission Increasing consciousness about oceans’ issues • Informing people about issues and solutions with blogposts Acquiring new members • Allowing people to register as member via a form A mission is a concrete solution you will achieve to accomplish your objective Website missions
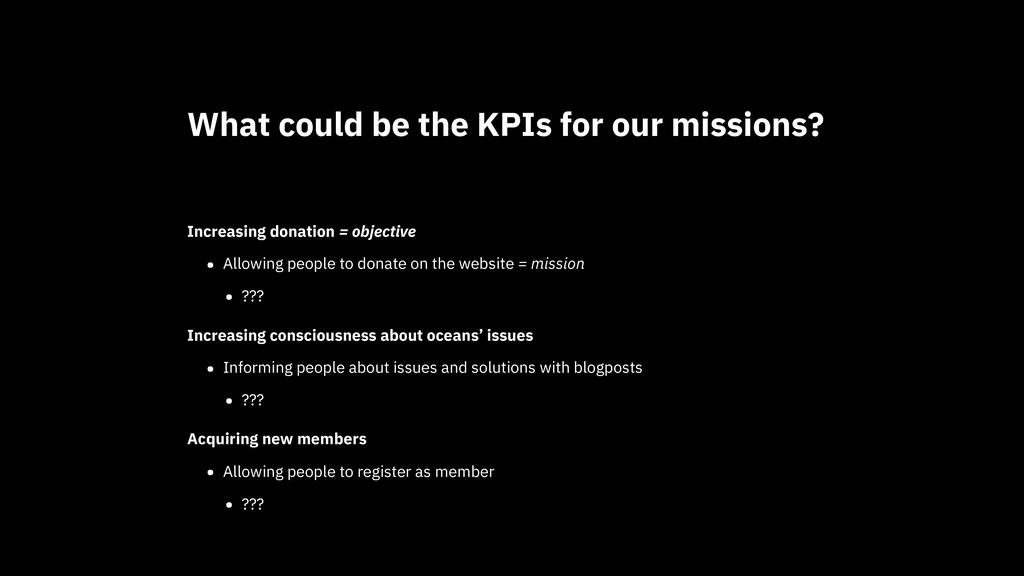
the website = mission • ??? Increasing consciousness about oceans’ issues • Informing people about issues and solutions with blogposts • ??? Acquiring new members • Allowing people to register as member • ??? What could be the KPIs for our missions?
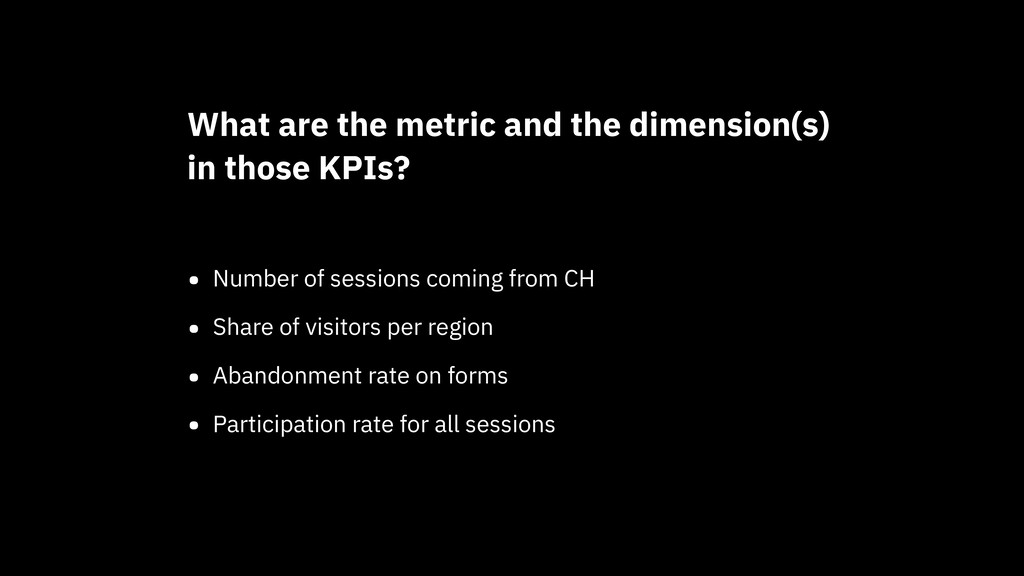
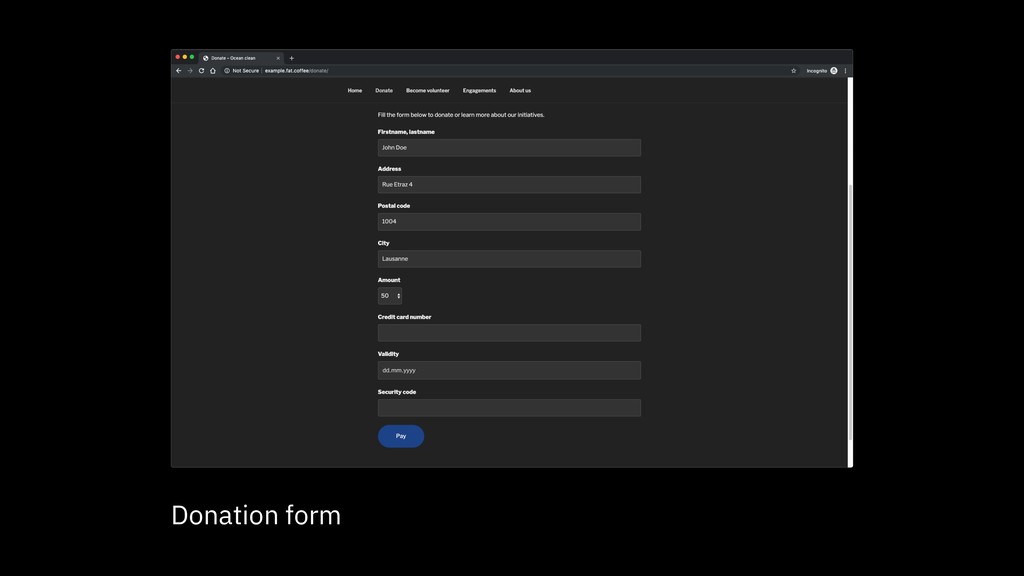
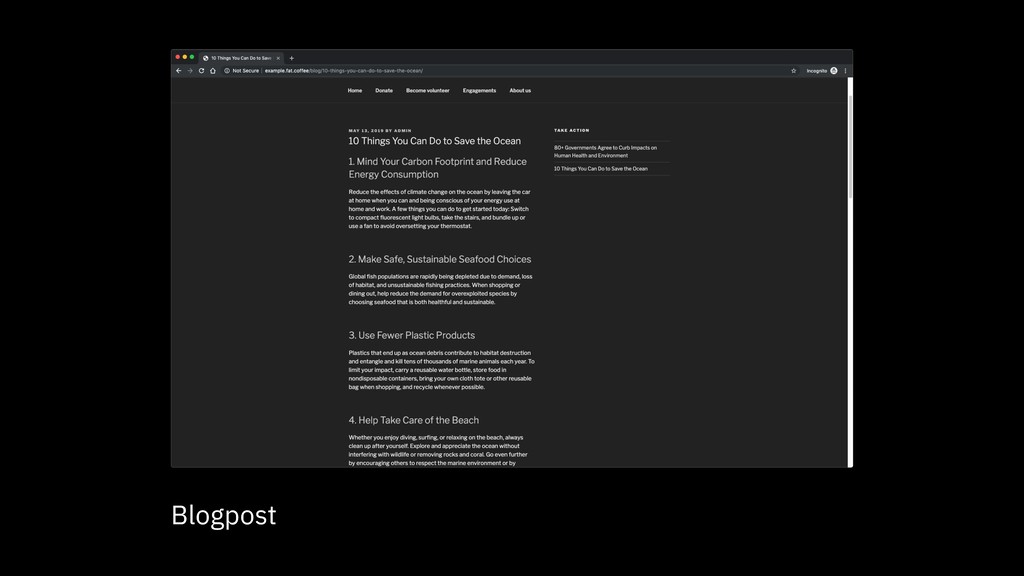
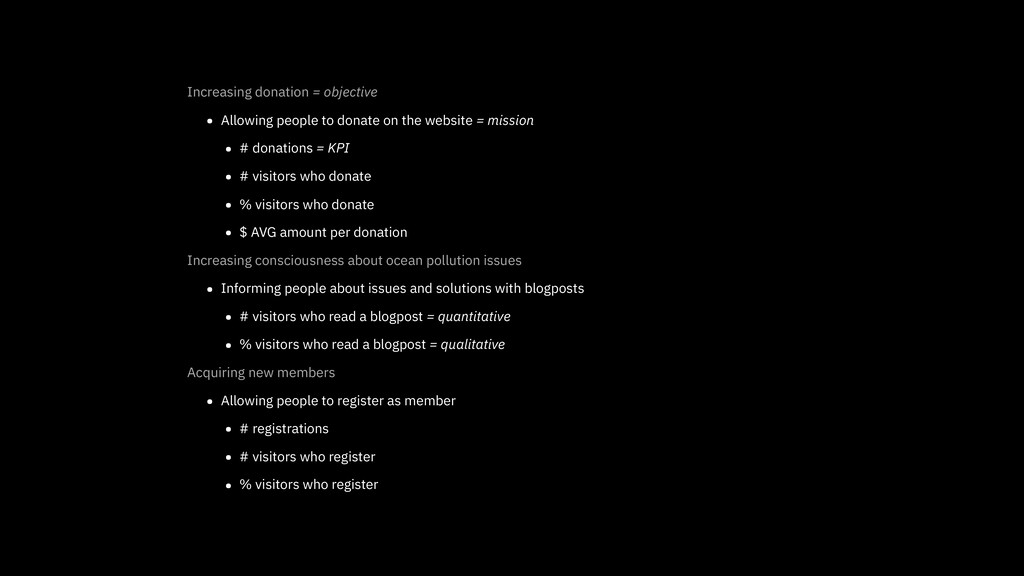
the website = mission • # donations = KPI • # visitors who donate • % visitors who donate • $ AVG amount per donation Increasing consciousness about ocean pollution issues • Informing people about issues and solutions with blogposts • # visitors who read a blogpost = quantitative • % visitors who read a blogpost = qualitative Acquiring new members • Allowing people to register as member • # registrations • # visitors who register • % visitors who register
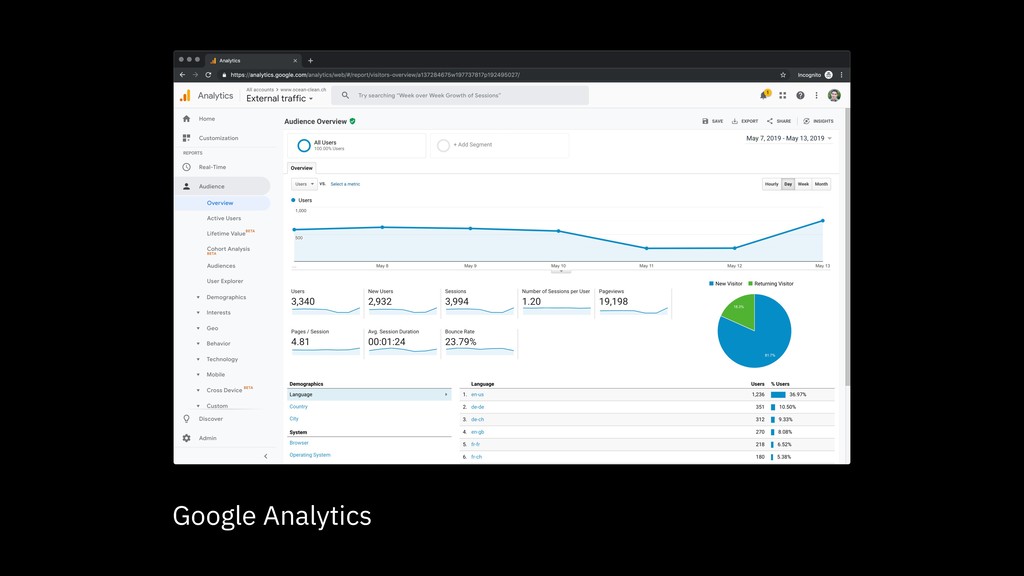
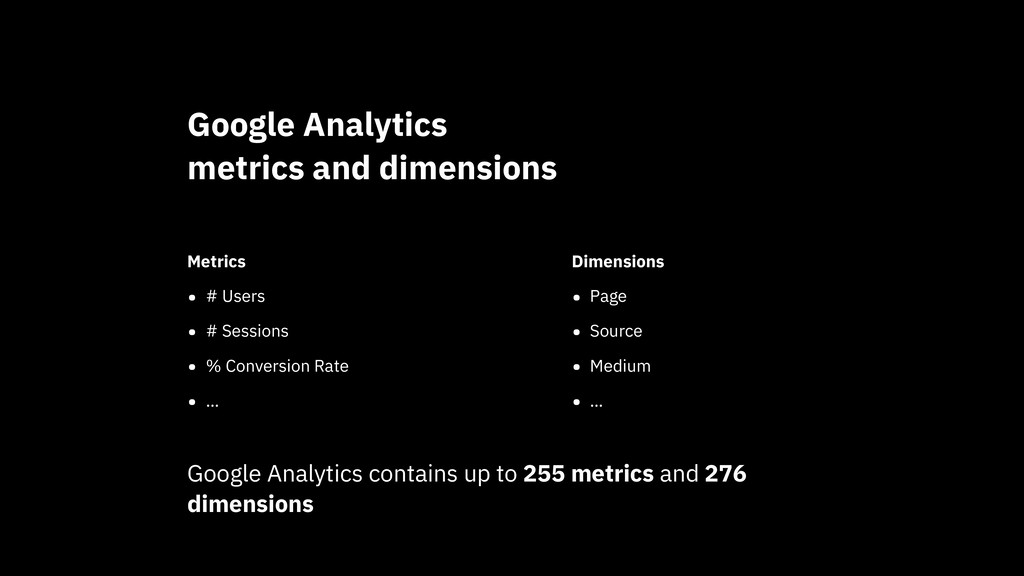
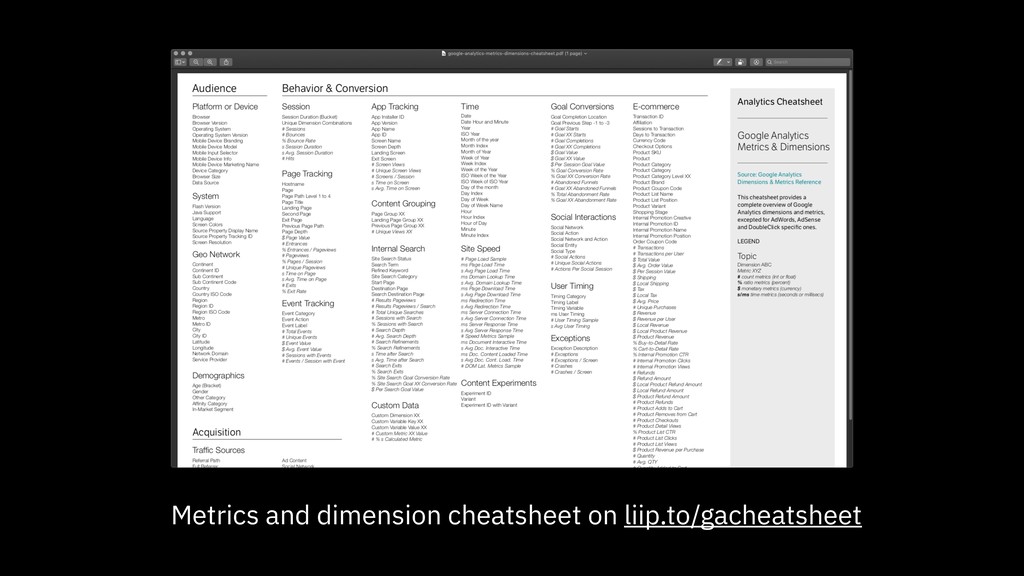
Rate • … Google Analytics metrics and dimensions Dimensions • Page • Source • Medium • … Google Analytics contains up to 255 metrics and 276 dimensions
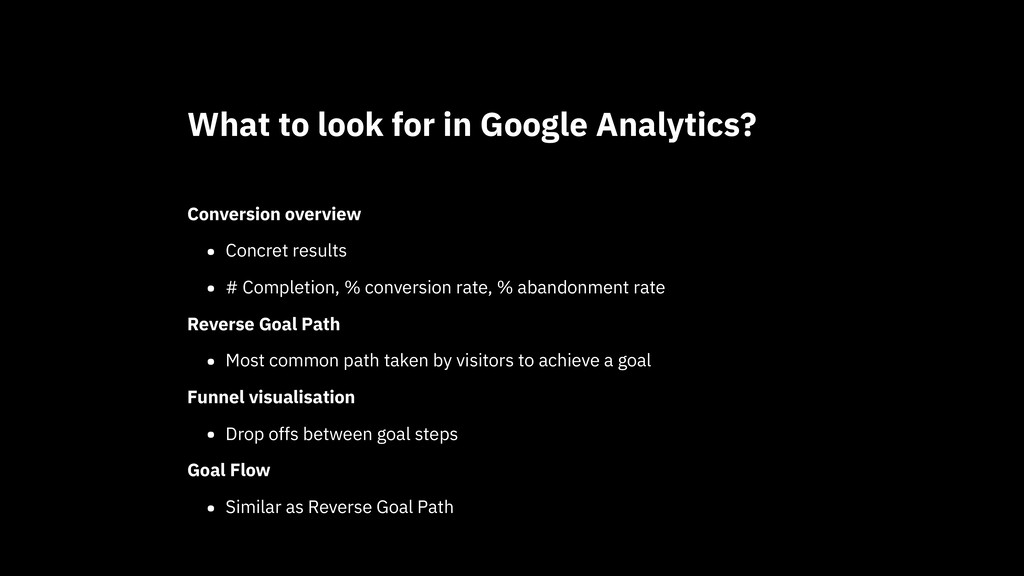
rate, % abandonment rate Reverse Goal Path • Most common path taken by visitors to achieve a goal Funnel visualisation • Drop offs between goal steps Goal Flow • Similar as Reverse Goal Path What to look for in Google Analytics?
![[email protected]](https://files.speakerdeck.com/presentations/6e9f961399334720af031db04143bfa4/slide_52.jpg)