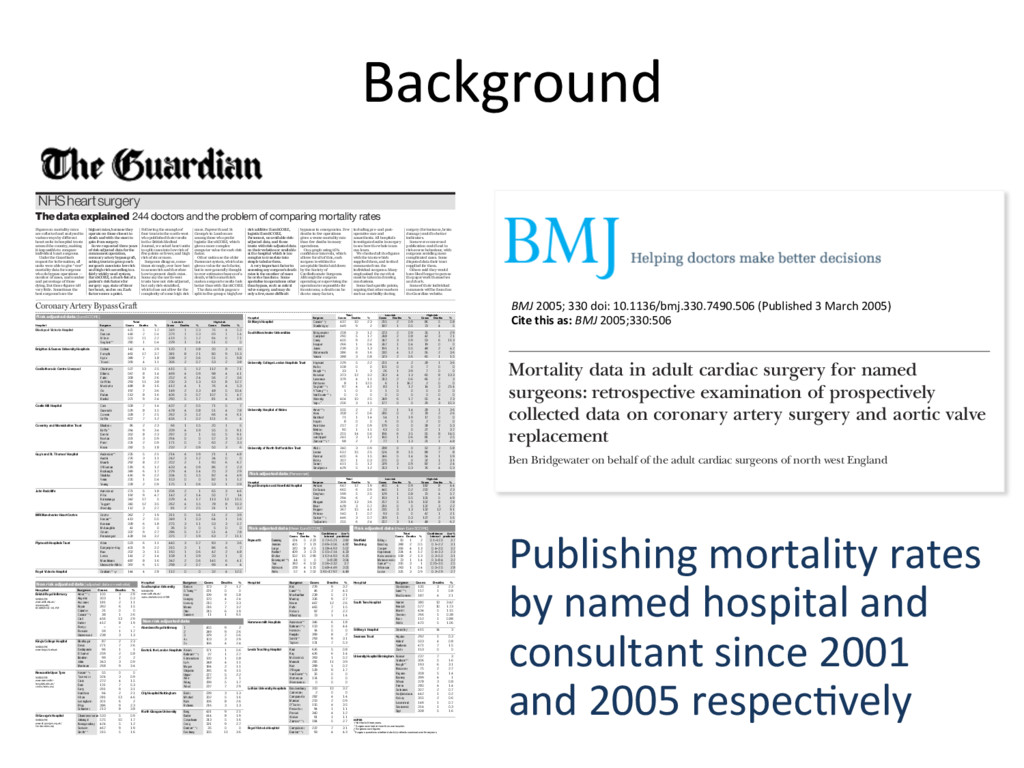
consultant since 2001 and 2005 respecHvely NHS heart surgery 10 The Guardian Wednesday March 16 2005 The data explained 244 doctors and the problem of comparing mortality rates Figures on mortality rates are collected and analysed in various ways by different heart units in hospital trusts around the country, making it impossible to compare individual heart surgeons. Under the Guardian’s request for information, all units were able to give “raw” mortality data for surgeons who do bypass operations — number of cases, and number and percentage of those dying. But those figures tell very little. Sometimes the best surgeons have the Following the example of four trusts in the north-west who published their results in the British Medical Journal, we asked heart units to split cases into low risk of five points or fewer, and high risk of six or more. Surgeons disagree, some- times strongly, over how best to assess risk and therefore how to present death rates. Some say the north-west trusts have not risk-adjusted, but only risk-stratified, which does not allow for the complexity of some high risk cases. Papworth and St George’s in London are among those who prefer logistic EuroSCORE, which gives a more complex computer value for each risk factor. Other units use the older Parsonnet system, which also gives a value for each factor, but is now generally thought to over-estimate chances of a death, which some think make a surgeon’s results look better than with EuroSCORE. The data on this page are split in five groups: high/low including pre- and post- operative care and anaesthesia. All hospitals investigate deaths in surgery to see how the whole team can learn. We checked all the figures with the trusts which supplied them, and invited comments from the individual surgeons. Many emphasised the care that must be taken in drawing conclusions. Some had specific points, arguing that other markers such as morbidity during surgery (for instance, brain damage) could be better indicators. Some were concerned publication could lead to risk-averse behaviour, with surgeons avoiding more complicated cases. Some disputed data their trust supplied for them. Others said they would have liked longer to peruse the paperwork themselves and check. Some of their individual comments will be found on the Guardian website. bypasses in emergencies. Few deaths in few operations gives a worse mortality rate than few deaths in many operations. On a graph using 95% confidence intervals, which allows for all of this, each surgeon is within the acceptable limits laid down by the Society of Cardiothoracic Surgeons. Although the surgeon operating or supervising the operation is responsible for its outcome, a death can be due to many factors, Risk adjusted data (EuroSCORE) Total Low risk High risk Hospital Surgeon Cases Deaths % Cases Deaths % Cases Deaths % Blackpool Victoria Hospital Au 425 5 1.2 349 1 0.3 76 4 5.3 Duncan 448 2 0.4 379 1 0.3 69 1 1.4 Millner 503 11 2.2 419 5 1.2 84 6 7.1 Sogliani** 280 1 0.4 229 1 0.4 51 0 0 Brighton & Sussex University Hospitals Cohen 140 4 2.9 120 1 0.8 20 3 15 Forsyth 461 17 3.7 381 8 2.1 80 9 11.3 Hyde 389 7 1.8 338 2 0.6 51 5 9.8 Trivedi 359 4 1.1 306 2 0.7 53 2 3.8 Cardiothoracic Centre Liverpool Chalmers 527 13 2.5 415 5 1.2 112 8 7.1 Dihmis 567 8 1.4 469 4 0.9 98 4 4.1 Fabri 308 8 2.6 252 6 2.4 56 2 3.6 Griffiths 293 11 3.8 230 3 1.3 63 8 12.7 Mediratta 488 8 1.6 412 4 1 76 4 5.3 Oo 197 7 3.6 149 2 1.3 48 5 10.4 Pullan 513 8 1.6 406 3 0.7 107 5 4.7 Rashid 371 9 2.4 290 5 1.7 81 4 4.9 Castle Hill Hospital Cale 508 7 1.4 437 2 0.5 71 5 7 Guvendik 529 8 1.5 478 4 0.8 51 4 7.8 Cowen 328 7 2.1 262 3 1.2 66 4 6.1 Griffin 607 7 1.2 456 1 0.2 151 6 4 Coventry and Warwickshire Trust Bhabra† 86 2 2.3 66 1 1.5 20 1 5 Briffa ≥ 264 9 3.4 209 4 1.9 55 5 9.1 Dimitri 352 8 2.3 297 3 1 55 5 9.1 Norton 321 3 0.9 264 0 0 57 3 5.3 Patel 231 2 0.9 171 0 0 60 2 3.3 Rosin 282 5 1.8 232 2 0.9 50 3 6 Guy’s and St. Thomas’ Hospital Anderson** 235 5 2.1 214 4 1.9 21 1 4.8 Austin 276 3 1.1 242 3 1.2 34 0 0 Blauth 292 8 2.7 202 2 1 90 6 6.7 O’Riordan 519 6 1.2 433 4 0.9 86 2 2.3 Roxburgh 349 6 1.7 279 4 1.4 70 2 2.9 Shabbo 416 9 2.2 334 5 1.5 82 4 4.9 Venn 235 1 0.4 153 0 0 82 1 1.2 Young 228 2 0.9 175 1 0.6 53 1 0.9 John Radcliffe Armistead 271 5 1.8 206 2 1 65 3 4.6 Pillai 192 9 4.7 142 2 1.4 50 7 14 Ratnatunga 342 17 5 229 4 1.7 113 13 11.5 Taggart 340 12 3.5 262 4 1.5 78 8 10.3 Westaby 112 3 2.7 81 2 2.5 31 1 3.2 MRI Manchester Heart Centre Grotte 362 7 1.9 311 5 1.6 51 2 3.9 Hasan** 413 2 0.5 349 1 0.3 64 1 1.6 Keenan 328 6 1.8 275 3 1.1 53 3 5.7 McLaughlin 41 0 0 36 0 0 5 0 0 Odom 337 9 2.7 286 5 1.7 51 4 7.8 Prendergast 438 14 3.2 375 7 1.9 63 7 11.1 Plymouth Hospitals Trust Allen 523 6 1.1 440 3 0.7 83 3 3.6 Dalrymple-Hay 401 9 2.2 315 3 1 86 6 7 Kuo 202 3 1.5 160 1 0.6 42 2 4.8 Lewis 141 2 1.4 108 1 0.9 33 1 3 Marchbank 487 8 1.6 342 2 0.6 145 6 4.1 Unsworth-White 397 6 1.5 298 2 0.7 99 4 4 Royal Victoria Hospital Graham**†ƒ 144 4 2.8 112 0 0 32 4 12.5 Total Low risk High risk Hospital Surgeon Cases Deaths % Cases Deaths % Cases Deaths % St Mary’s Hospital Casula**ƒ 437 10 2.3 215 2 0.9 86 5 5.8 Stanbridgeƒ 449 9 2 187 1 0.5 73 4 5 South Manchester Universities Bridgewater 258 3 1.2 223 2 0.9 35 1 2.9 Campbell 290 5 1.7 248 2 0.8 42 3 7.1 Carey 400 9 2.2 347 3 0.9 53 6 11.3 Hooper 266 1 0.4 247 1 0.4 19 0 0 Jones 239 3 1.3 191 1 0.5 48 2 4.2 Waterworth 386 6 1.6 330 4 1.2 56 2 3.6 Yonan 388 3 0.8 323 2 0.6 65 1 1.5 University College London Hospitals Trust Hayward 229 5 2.2 201 4 2 28 1 3.6 Kallis† 108 0 0 101 0 0 7 0 0 Keogh**† 33 1 3 26 1 3.9 7 0 0 Kolvekar 373 12 3.2 313 4 1.3 60 8 13.3 Lawrence 379 4 1.1 313 2 0.6 66 2 3 Pattison† 8 1 12.5 6 1 16.7 2 0 0 Sogliani**† 97 4 4.1 83 1 1.2 14 3 21.4 V Tsang**† 1 0 0 1 0 0 0 0 0 Van Doorn**† 0 0 0 0 0 0 0 0 0 Walesby 404 10 2.5 349 6 1.7 55 4 7.3 Yap † ≥ 206 3 1.5 177 0 0 29 3 10.3 University Hospital of Wales Amer**† 100 2 2 72 1 1.4 28 1 3.6 Azzu 358 2 0.6 280 0 0 78 2 2.6 Butchart 71 1 1.4 54 1 1.9 17 0 0 Hayat† 8 0 0 6 0 0 2 0 0 Kulatilake 217 2 0.9 179 0 0 38 2 5.3 Mehta† 90 1 1.1 63 0 0 27 1 3.7 O’Keefe 251 14 5.6 196 6 3.1 55 8 14.5 von Oppell 241 3 1.2 160 1 0.6 81 2 2.5 Zamvar**†≥ 98 2 2 77 1 1.3 21 1 4.8 University of North Staffordshire Trust Abid† 340 3 0.9 288 0 0 52 3 5.8 Levine 612 15 2.5 524 8 1.5 88 7 8 Parmar 400 6 1.5 346 5 1.4 54 1 1.9 Ridley 307 1 0.3 275 0 0 32 1 3.1 Satur† 411 5 1.2 329 3 0.9 82 2 2.4 Smallpeice 429 5 1.2 353 1 0.3 76 4 5.3 Risk adjusted data (Parsonnet) Total Low risk High risk Hospital Surgeon Cases Deaths % Cases Deaths % Cases Deaths % Royal Brompton and Harefield Hospital Amrani 647 12 1.9 465 4 0.9 182 8 4.4 De Souza 660 6 0.9 440 1 0.2 220 5 2.3 Dreyfus† 199 5 2.5 129 1 0.8 70 4 5.7 Gaer 294 6 2 193 1 0.5 101 5 4.9 Khagani 359 13 3.6 257 5 1.9 102 8 7.8 Moat 428 3 0.7 291 0 0 137 3 2.2 Pepper 367 15 4.1 235 3 1.3 132 12 9.1 Petrou† 140 1 0.7 93 0 0 47 1 2.1 Sarkar**† 446 3 0.7 319 1 0.3 127 2 1.6 Tadjkarimi† 255 6 2.4 207 3 1.4 48 3 6.2 Non risk adjusted data (adjusted data on website) Hospital Surgeon Cases Deaths % Bristol Royal Infirmary Amer**† 105 3 2.9 Angelini 303 1 0.3 Ascione† 181 2 1.1 Bryan 392 6 1.5 Caputo† 31 0 0 Casula**† 38 1 2.6 Ciulli 456 13 2.9 Hutter 412 8 1.9 Parry† - - - Pawade 59 1 1.7 Underwood 238 3 1.3 King’s College Hospital Bhathagar 87 2 2.3 Desai 271 7 2.6 Deshpande 96 1 1 El Gamel 259 2 0.8 Ibrahim 99 2 2 John 343 3 0.9 Marrinan 268 9 3.4 Newcastle Upon Tyne Hasan**† 55 0 0 Tocewicz† 324 3 0.9 Clark 272 4 1.5 Dark 131 7 5.3 Forty 291 9 3.1 Hamilton 94 2 2.1 Hilton 281 13 4.6 Ledingham 301 6 2 Pillay 386 9 2.3 Schueler† 213 8 3.8 St George’s Hospital Chandrasekaran 533 5 0.9 Jahangiri 575 10 1.7 Kanagasabay 424 5 1.2 Sarsam 467 9 1.9 Smith** 315 5 1.6 Hospital Surgeon Cases Deaths % Southampton University Barlow 173 2 1.2 G Tsang** 231 0 0 Haw 139 8 5.8 Langley 170 4 2.4 Livesey 210 7 3.3 Monro 216 7 3.2 Ohri 315 6 1.9 Sunder† 11 1 9.1 Non risk adjusted data Aberdeen Royal Infirmary 1 455 9 2 2 349 9 2.6 3 329 2 0.6 4† 103 3 2.9 5† 166 4 2.4 Barts & the London Hospitals Awad† 171 1 0.6 Bahrami**† 37 1 2.7 Edmondson 130 1 0.8 Lall† 348 4 1.1 Magee 184 2 1.1 Shipolini 395 6 1.5 Uppal 227 5 2.2 Weir 297 3 1 Wong 299 5 1.7 Wood 237 7 2.9 City Hospital Nottingham Birdi† 239 3 1.3 Mitchell 302 5 1.6 Naik 306 8 2.6 Richens 216 3 1.3 North Glasgow University Berg 431 9 2.1 Butler 414 8 1.9 Colquhoun 313 5 1.6 Craig 331 9 2.7 Danton**† 35 0 0 Faichney 305 11 3.6 Hospital Surgeon Cases Deaths % Kirk 279 9 3.2 Lund**† 46 2 4.3 MacAurthur 238 5 2.1 Murday 336 9 2.7 Nkere 467 12 2.6 Pathi 465 7 1.5 Pollock 92 2 2.2 Wheatley 73 1 1.4 Hammersmith Hospitals Anderson** 346 6 1.8 Bahrami**† 113 5 4.4 Hornick† 14 0 0 Punjabi 399 8 2 Smith** 293 9 3.1 Taylor† 131 7 5.3 Leeds Teaching Hospital Kaul 626 5 0.8 Kay 426 6 1.4 McGoldrick 393 1 0.2 Munsch 285 11 3.9 Nair 398 1 0.2 O’Regan 528 9 1.7 Van Doorn**† 35 0 0 Watterson 174 0 0 Weerasena† 0 0 0 Lothian University Hospitals Brackenbury 313 10 3.2 Cameron† 2 0 0 Campanella 282 4 1.4 Mankad 213 2 0.9 O’Toole† 115 4 3.5 Pessotto† 94 1 1.1 Prasad 340 4 1.2 Walker 91 1 1.1 Zamvar**† 184 5 2.7 Royal Victoria Hospital Campalani† 222 7 3.1 Danton**† 93 4 4.3 Hospital Surgeon Cases Deaths % Gladstone† 130 3 2.3 Lund**† 117 1 0.8 MacGowan† 187 4 2.1 South Tees Hospital Hunter 380 13 3.42 Kendall 577 10 1.73 Morritt 434 5 1.15 Owens† 266 1 0.38 Rao† 112 1 0.88 Wallis 470 5 1.06 St Mary’s Hospital Glenvilleƒ 415 14 3 Swansea Trust Argano 292 1 0.3 Ashraf 503 4 0.8 Youhana 471 7 1.5 Zaidi† 153 0 0 University Hospital Birmingham Bonser 237 7 3 Graham** 306 5 1.6 Keogh** 193 6 3.1 Mascaro† 75 2 2.7 Pagano 358 5 1.4 Rooney 399 4 1 Wilson 378 3 0.8 Firmin 280 4 1.4 Galinanes 307 2 0.7 Hadjinikolaou 442 1 0.2 Hickey 355 2 0.6 Leverment 149 1 0.7 Sosnowski 314 1 0.3 Spyt 308 5 1.6 Risk adjusted data (Mean EuroSCORE) Total Confidence Ave % Cases Deaths % Interval predicted Papworth Dunning 224 5 2.23 0.72-5.21 3.82 Jenkins 405 7 1.73 0.69-3.56 4.87 Large 320 8 2.5 1.08-4.93 5.07 Nashef 409 3 0.73 0.15-2.14 4.33 Ritchie 502 15 2.99 1.67-4.93 6.25 Rosengard**† 44 0 0 0-8.38 3.04 Tsui 393 6 1.53 0.56-3.32 3.7 Wallwork 228 4 1.75 0.48-4.49 3.05 Wells 57 4 7.02 1.91-17.97 4.49 Risk adjusted data (Mean EuroSCORE) Total Confidence Ave % Cases Deaths % Interval predicted Sheffield Billing† 50 1 2 0.1-12.0 3.7 Teaching Braidley 368 2 0.5 0.1-2.2 3.1 Cooper 306 4 1.3 0.4-3.5 3.2 Hopkinson 324 4 1.2 0.4-3.3 2.3 Kolocassides† 158 2 1.3 0.2-5.0 3.1 Matuszewski† 73 1 1.4 0.1-8.4 3.2 Sarkar**† 315 3 1 0.25-3.0 2.5 Wilkinson 263 1 0.4 0.0-2.5 2.8 Locke 325 3 0.9 0.2-2.9 2.7 risk additive EuroSCORE, logistic EuroSCORE, Parsonnet, no available risk- adjusted data, and those trusts with risk-adjusted data on their websites or available at the hospital which is too complex to translate into simple tabular form. A very important factor in assessing any surgeon’s death rates is the number of cases he or she has done. Some specialise in operations other than bypass, such as mitral valve surgery, and may do only a few, more difficult NOTES † Not the full three years. ** Surgeon worked at more than one hospital. ƒ Surgeons own figures ≥ Surgeon questions whether data fully reflects caseload over three years highest rates, because they operate on those closest to death and with the most to gain from surgery. So we requested three years of risk-adjusted data for the commonest operation, coronary artery bypass graft, asking trusts to group each surgeon’s cases into low risk and high risk according to a fairly widely used system, EuroSCORE, a check-list of a patient’s risk factors for surgery: age, state of his or her heart, and so on. Each factor scores a point. Coronary Artery Bypass Graft WEBSITE www.kingsch.nhs.uk WEBSITE www.ubht.nhs.uk/ mainreports/ ACSAR2003-04.PDF WEBSITE www.newcastle- hospitals.nhs.uk/ cardio/index.asp WEBSITE www.suht.nhs.uk/ index.cfm?articleid=1058 WEBSITE www.st-georges.org.uk/ Cardiacindex.asp clinical trials of hypericum extract for different pharmaceutical companies. AD and MK are employees of Dr Willmar Schwabe Pharmaceuticals. Ethical approval: The protocol was approved by the participat- ing centres’ appropriate independent ethics committees. 1 Linde K, Mulrow CD. St John’s wort for depression. Cochrane Database Syst Rev 2004;(4):CD000448. 2 Harrer G, Hübner WD, Podzuweit H. Effectiveness and tolerance of the hypericum extract LI 160 compared to maprotiline: a multicenter double-blind study. J Geriatric Psychiatry Neurol 1994;7(suppl 1):S24-8. 3 Philipp M, Kohnen R, Hiller KO. Hypericum extract versus imipramine or placebo in patients with moderate depression: randomised multicen- tre study of treatment for eight weeks. BMJ 1999;319:1534-8. 4 Vorbach EU, Hübner WD, Arnoldt KH. Effectiveness and tolerance of the hypericum extract LI 160 in comparison with imipramine: randomized double-blind study with 135 outpatients. J Geriatric Psychiatry Neurol 1994;7(suppl 1):S19-23. 5 Wheatley D. LI 160, an extract of St. John’s wort, versus amitriptyline in mildly to moderately depressed outpatients—a controlled 6-week clinical trial. Pharmacopsychiatry 1997;30(suppl 2):77-80. 6 Harrer G, Schmidt U, Kuhn U, Biller A. Äquivalenzvergleich Johanniskrautextrakt LoHyp-57 versus Fluoxetin. Arzneimittel-Forschung 1998;49:3-10. 7 Izzo AA. Drug interactions with St. John’s Wort (Hypericum perforatum): a review of the clinical evidence. Int J Clin Pharmacol Ther 2004;42:139-48. 8 Montgomery SA. Clinically relevant effect sizes in depression. Eur Neuropsychopharmacology 1994;4:283-4. 9 Committee for Proprietary Medicinal Products. Points to consider on switching between superiority and non-inferiority. London: European Agency for the Evaluation of Medicinal Products, 2000. 10 Paykel ES. The classification of depression. Br J Clin Pharmacol 1983;15(suppl 2):155-9S. 11 Hypericum Depression Trial Study Group. Effect of Hypericum perfora- tum (St. John’s wort) in major depressive disorder. JAMA 2002;287: 1807-14. 12 Dunner DL, Dunbar GC. Optimal dose regimen for paroxetine. J Clin Psychiatry 1992;53(suppl):21-6. 13 Bourin M, Chue P, Guillon Y. Paroxetine: a review. CNS Drug Rev 2001;7:25-47. (Accepted 17 December 2004) doi 10.1136/bmj.38356.655266.82 Mortality data in adult cardiac surgery for named surgeons: retrospective examination of prospectively collected data on coronary artery surgery and aortic valve replacement Ben Bridgewater on behalf of the adult cardiac surgeons of north west England Abstract Objectives To present named surgeon mortality for isolated first time coronary artery surgery and aortic valve surgery. Design Retrospective analysis of prospectively collected data. Setting All NHS hospitals undertaking adult cardiac surgery in north west England. Participants 25 consultant surgeons carrying out coronary artery surgery and aortic valve replacement between April 2001 and March 2004. Main outcome measures Mortality for both operations according to surgeon. EuroSCORE to stratify patients into low and high risk. Results 10 163 patients underwent surgery under 25 surgeons. The average number of patients per surgeon was 363 for coronary artery surgery and 44 for aortic valve replacement. Seventeen per cent of the patients undergoing coronary artery surgery and half of those undergoing aortic valve surgery were considered high risk. The average mortality was 1.8% Introduction Recent years have seen a move towards increased openness and transparency in healthcare delivery. This has been accelerated by a series of events, including the Bristol Royal Infirmary inquiry into paediatric cardiac surgery deaths.1 One recommendation of the inquiry was that patients must be able to see information about the relative performance of individual consultants operating within hospitals. The Society of Cardiotho- racic Surgeons of Great Britain and Ireland therefore published a study in 2004 of activity and performance of all consultants undertaking adult cardiac surgery in the United Kingdom.2 The history leading to this analysis and the underlying methods have been comprehensively described.3 The study was conducted on a single operation: first time isolated coronary artery surgery. Because of a lack of comprehensive data on which to perform a complete analysis that would allow adjustments to be made for differing case mix, the benchmarking was done on “crude” non-adjusted mortality data. The exact mortality for individual Papers South Manchester University Hospital, Manchester M23 9LT Ben Bridgewater consultant surgeon Correspondence to: B Bridgewater ben.bridgewater@ smuht.nwest.nhs.uk BMJ 2005;330:506–10 BMJ 2005; 330 doi: 10.1136/bmj.330.7490.506 (Published 3 March 2005) Cite this as: BMJ 2005;330:506