Upgrade to Pro — share decks privately, control downloads, hide ads and more …

Risk: a statistician's viewpoint

Risk: a statistician's viewpoint

Presented at the SCTS Annual Meeting 2018, Glasgow, UK

Avatar for Graeme Hickey

Graeme Hickey

March 19, 2018
Tweet

More Decks by Graeme Hickey

Other Decks in Research

Transcript

  1. Randomization N = 200 Treatment n = 100 Control n

    = 100 Dead at 30-days n = 30 Alive at 30-days n = 70 Dead at 30-days n = 40 Alive at 30-days n = 60
  2. Treatment Control Total Died within 30-days 30 40 70 Alive

    at 30-days 70 60 130 Total 100 100 N = 200 A 2x2 contingency table + marginal totals
  3. Treatment Control Total Died within 30-days a b a +

    b Alive at 30-days c d c + d Total a + c b + d N = a + b + c + d A 2x2 contingency table + marginal totals
  4. Measure Formula Example Absolute risk in treatment group (ARtreat )

    = " " + $ 30 100 = 0.3 Absolute risk in control group (ARcontrol ) = ) ) + * 40 100 = 0.4 Absolute risk reduction (ARR) = ARcontrol − ARtreat 0.4 − 0.3 = 0.1
  5. Measure Formula Example Absolute risk in treatment group (ARtreat )

    = " " + $ 30 100 = 30% Absolute risk in control group (ARcontrol ) = ) ) + * 40 100 = 40% Absolute risk reduction (ARR) = ARcontrol − ARtreat 40% − 30% = 10%
  6. Measure Formula Example Number needed to treat (NNT) = 1

    ARR 1 0.1 = 10 Equivalent to the average number of patients who need to be treated to prevent one additional event
  7. Measure Formula Example Relative risk (RR) = ARtreat ARcontrol 0.3

    0.4 = 0.75 Relative risk reduction (RRR) = 1 − RR 1 − 0.75 = 0.25
  8. 0 0.05 0.1 0.15 0.2 0.25 0.3 0.35 0.4 0.45

    High risk Intermediate risk Low risk Results from 3 hypothetical RCTs of the same treatment Control Treatment 30-day mortality proportion ARR = 0.1 (or 10%) ARR = 0.05 (or 5%) ARR = 0.01 (or 1%) 0.1 0.05 0.01 NNT = 10 ARR = 20 ARR = 100 RRR = 0.25 (or 25%) RRR = 0.25 (or 25%) RRR = 0.25 (or 25%) High risk Intermediate risk Low risk
  9. Measure Formula Example Relative risk (RR) = !(# + %)

    #(! + ') = 0.75 Odds ratio (OR) = odds01230 odds4560157 = 8 ! ' # % 18 28 = 0.64
  10. low baseline risk RR = OR 1 − AR'()*+(, +

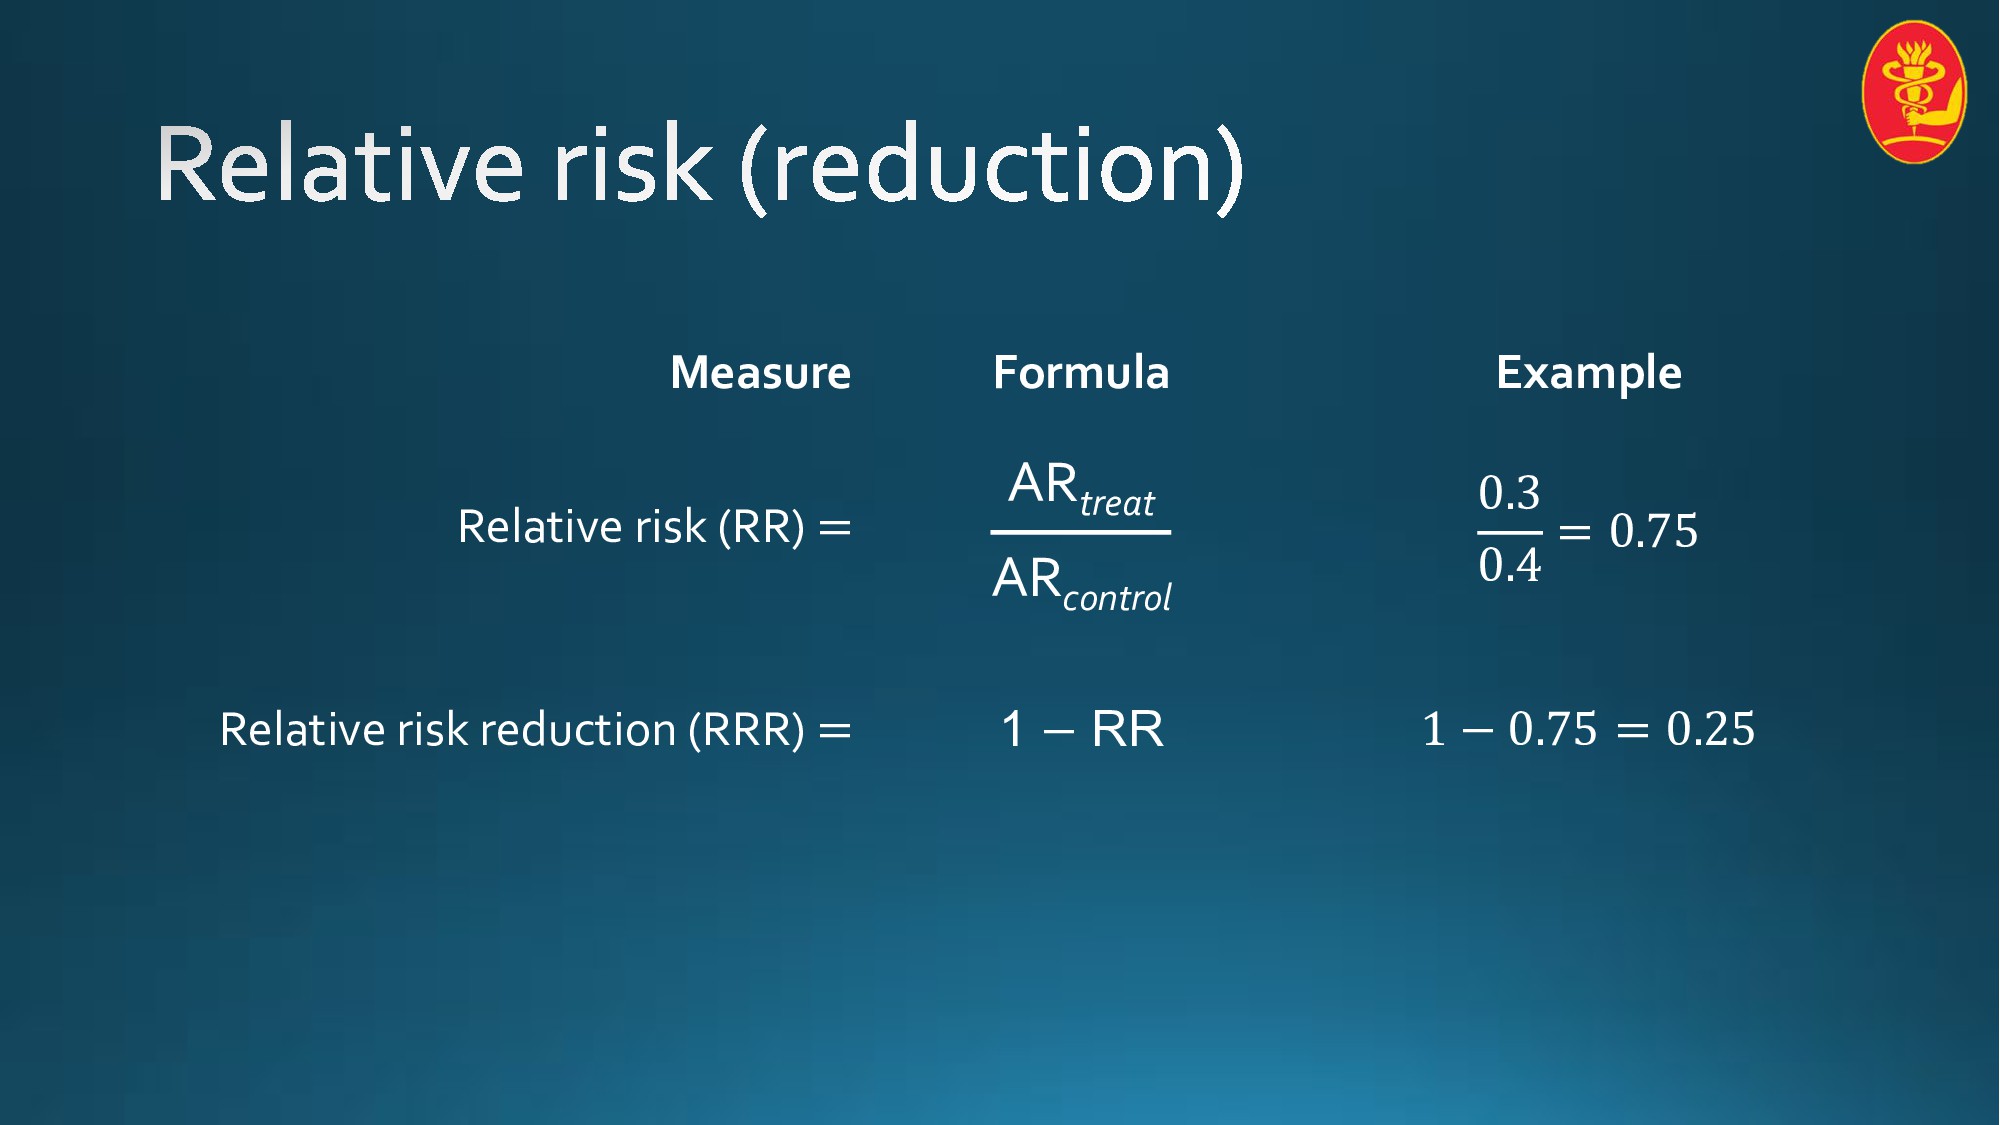
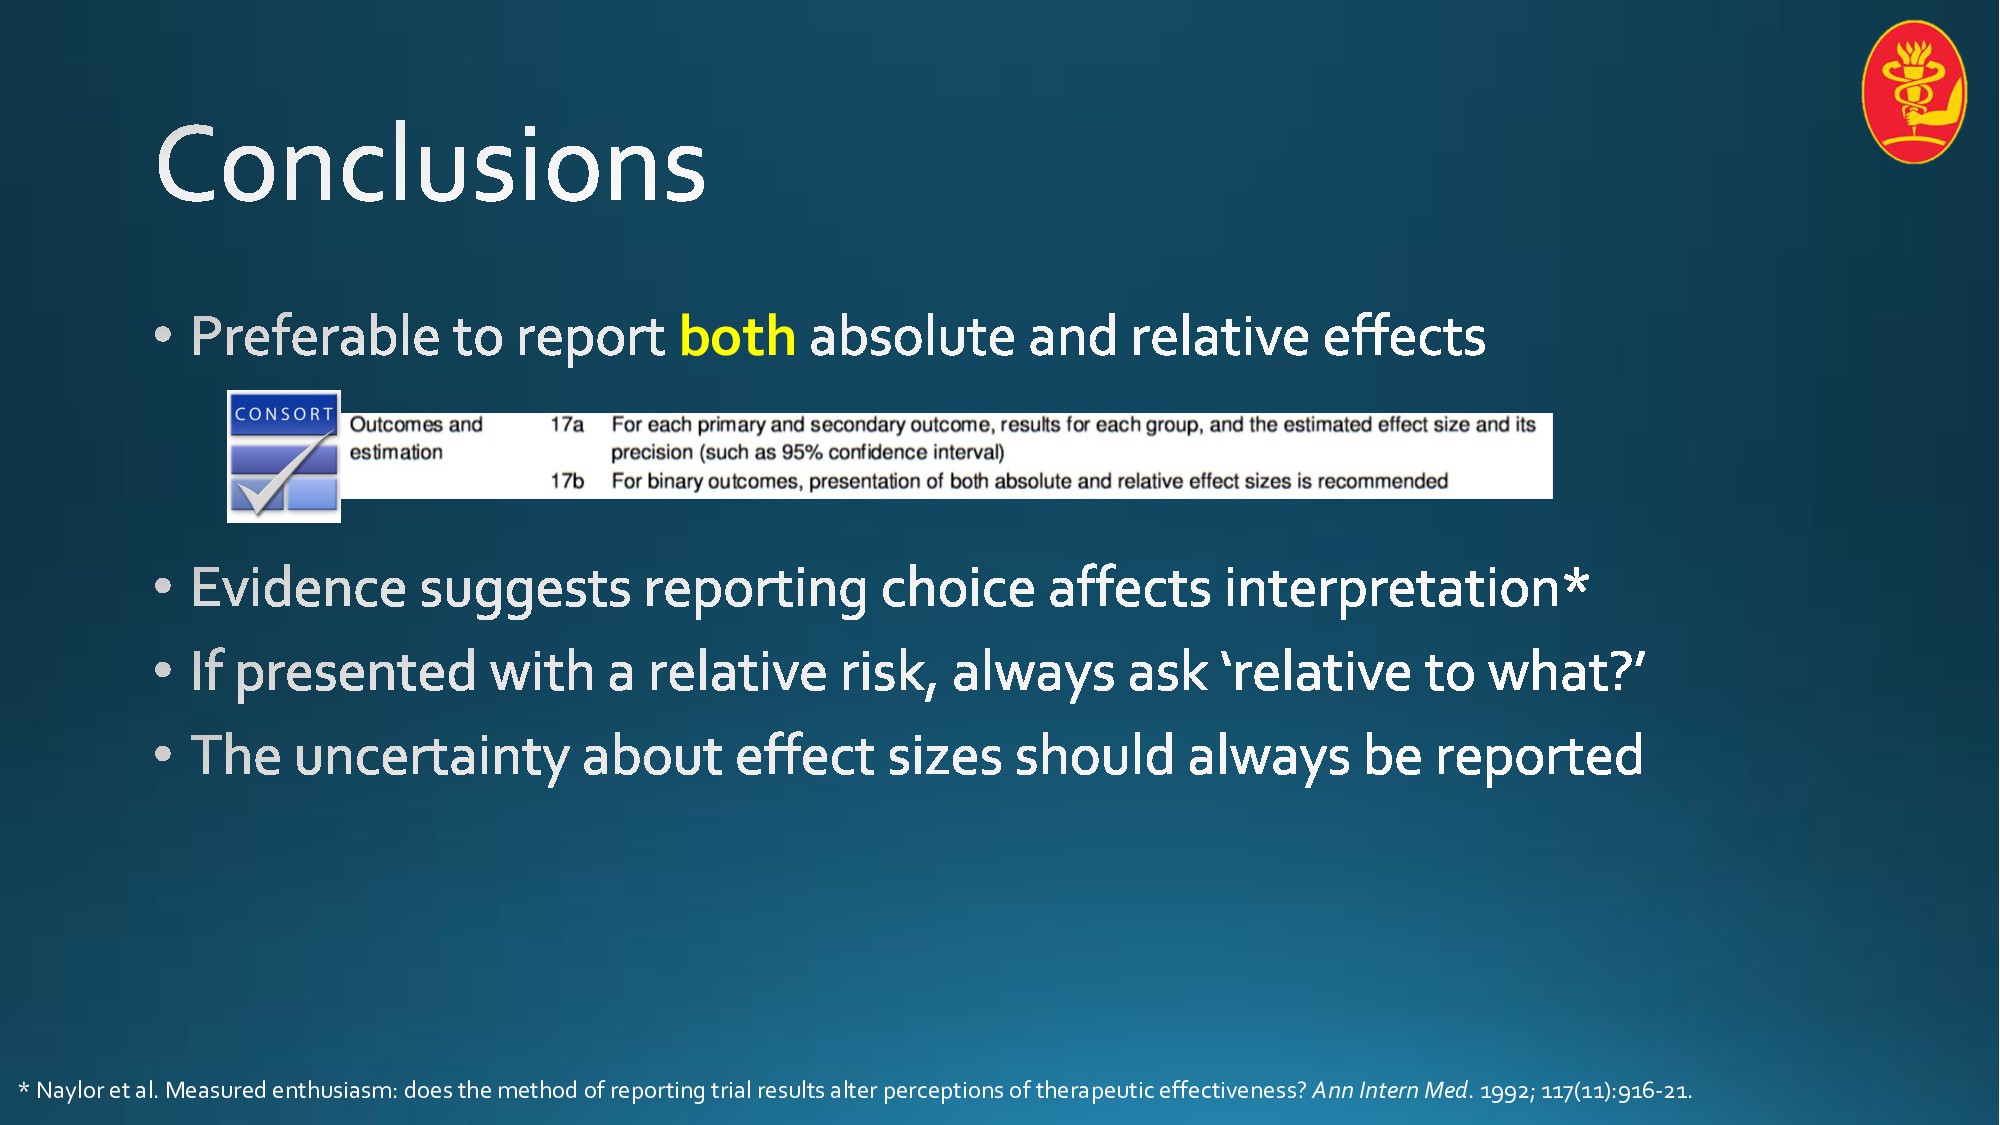
    1 − AR'()*+(, OR Source: Grant, R. L. (2014). Converting an odds ratio to a range of plausible relative risks for better communication of research findings. BMJ, 348(4), f7450.
  11. Relative effect: HR = 0.55 Absolute effect: ARR(12-months) = 20.0%

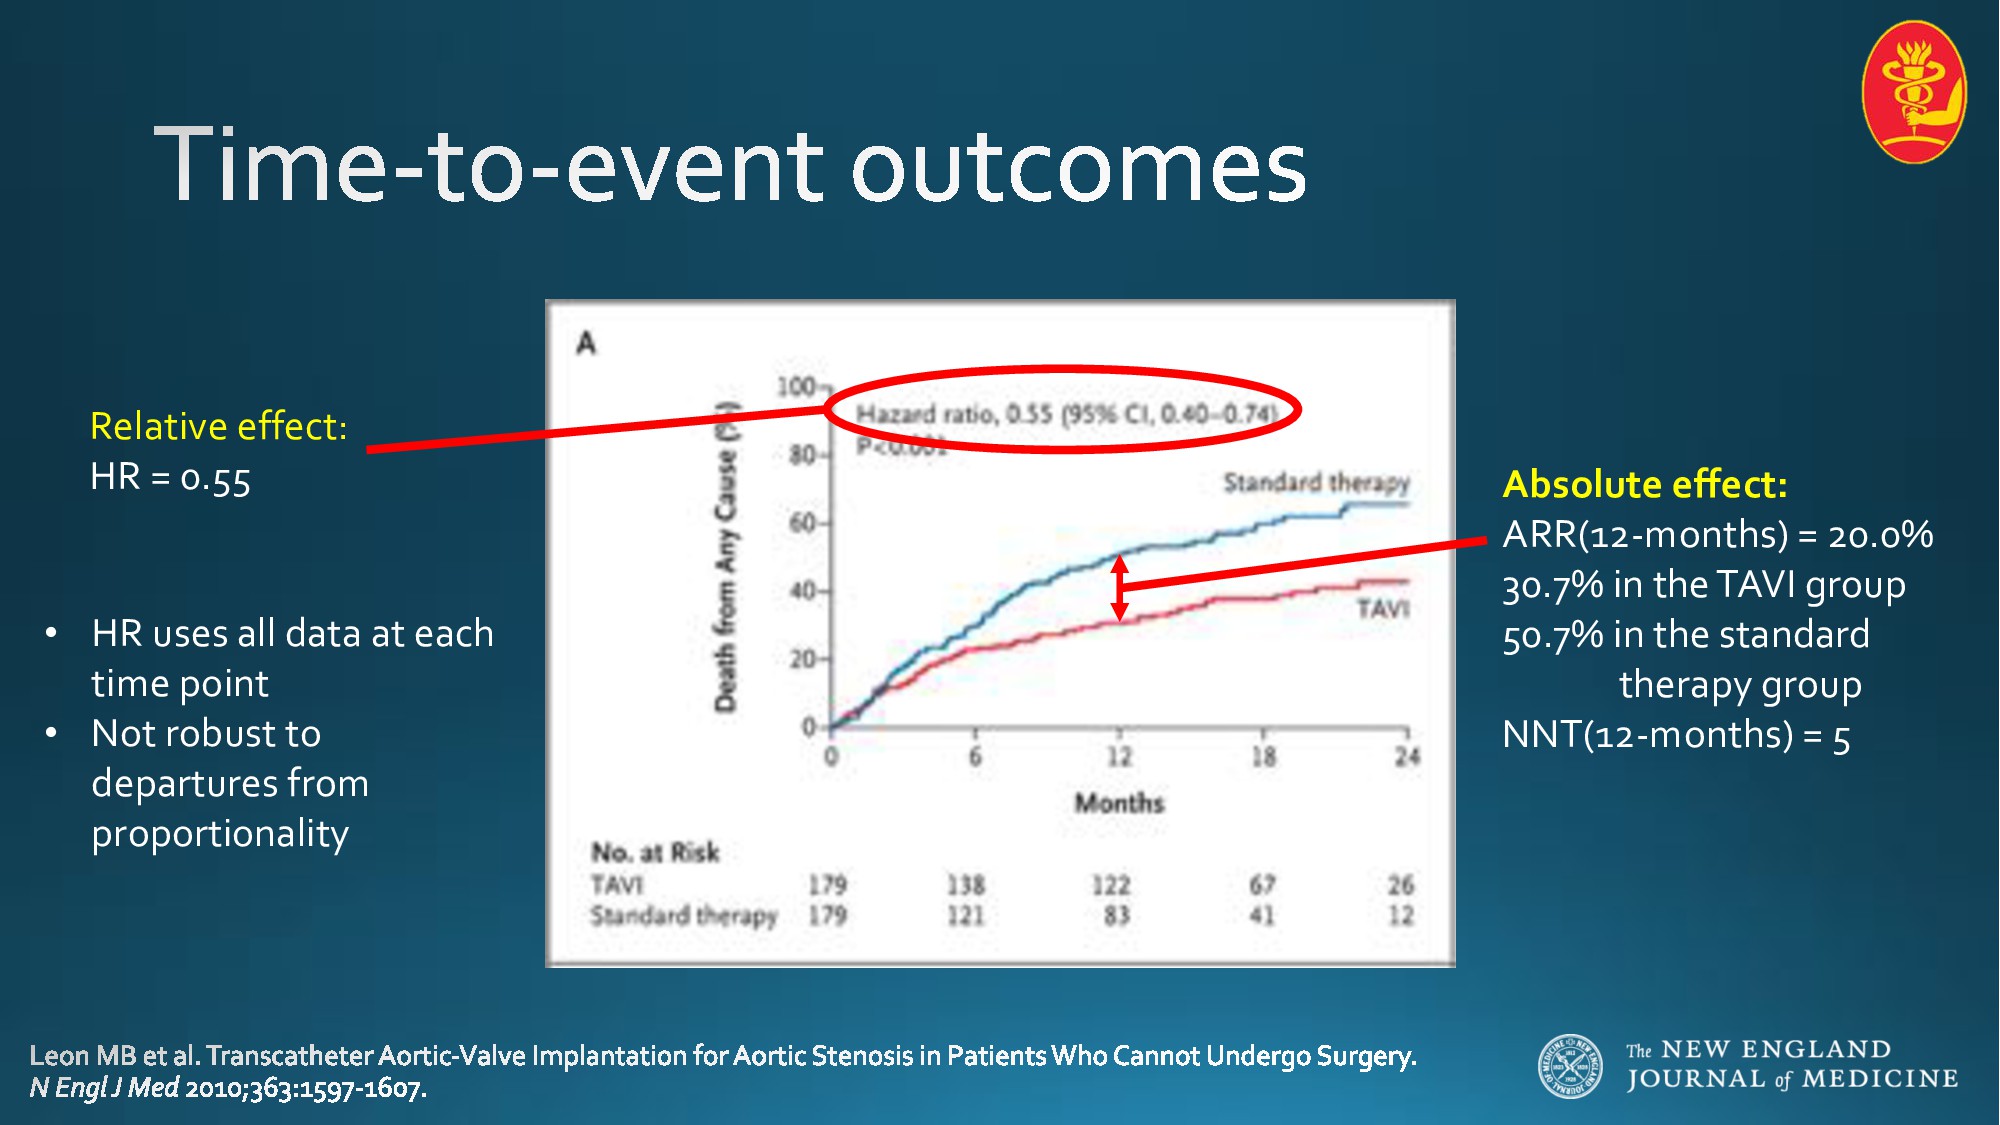
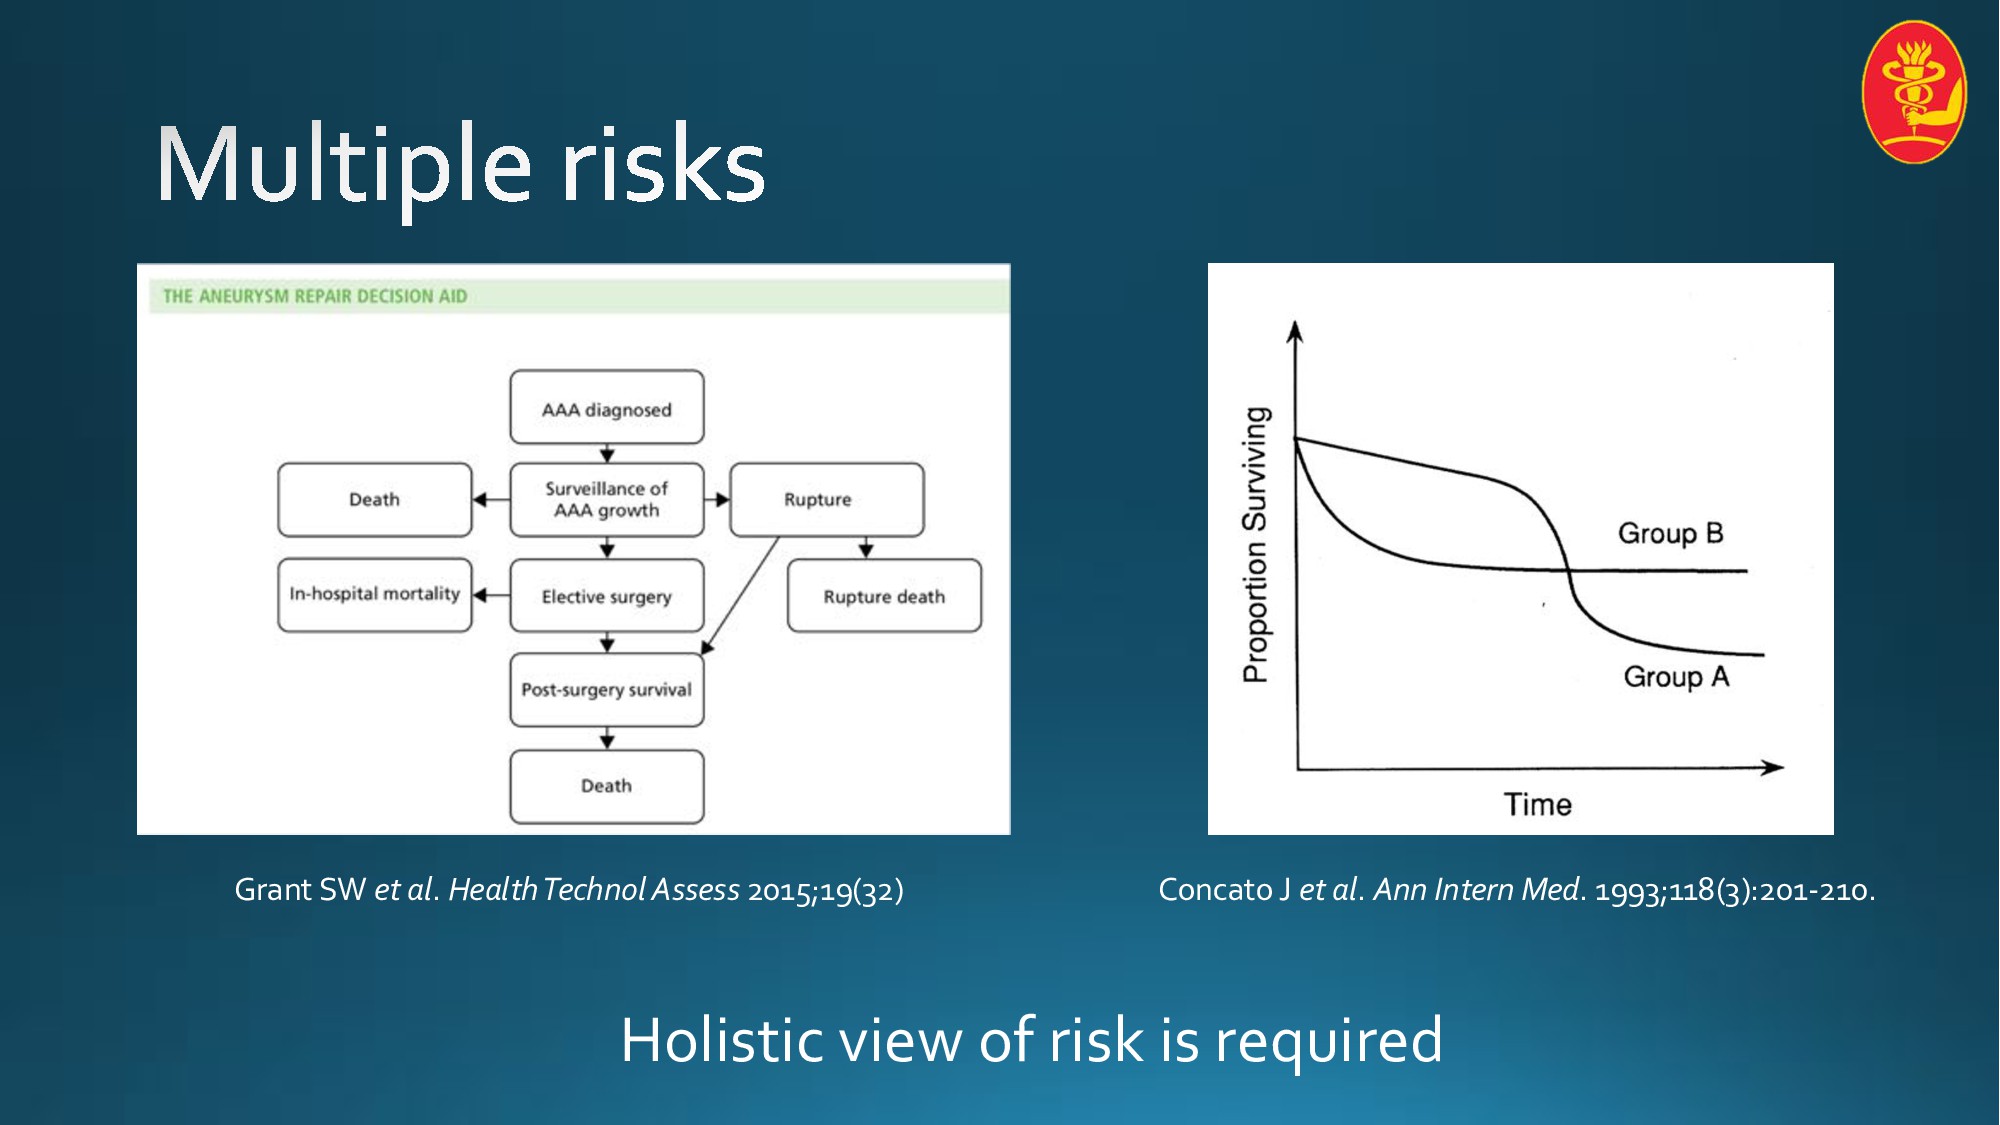
    30.7% in the TAVI group 50.7% in the standard therapy group NNT(12-months) = 5 • HR uses all data at each time point • Not robust to departures from proportionality
  12. instantaneous rate ! " ≤ $ < " + '"

    $ ≥ "] proportional hazards reference
  13. Survival Survival HR = 3 HR = 1.5 1 2

    Treatment A B Treatment A B Treatment arm Panel 1 (HR = 3) Panel 2 (HR = 1.5) A 1 1 B 0.9 0.5 Median survival times (years) Spruance SL et al. Hazard ratio in clinical trials. AntimicrobAgents Chemother 2004;48:2787–92.
  14. Grant SW et al. Health Technol Assess 2015;19(32) Holistic view

    of risk is required Concato J et al. Ann Intern Med. 1993;118(3):201-210.
  15. both * Naylor et al. Measured enthusiasm: does the method

    of reporting trial results alter perceptions of therapeutic effectiveness? Ann Intern Med. 1992; 117(11):916-21.