Upgrade to Pro — share decks privately, control downloads, hide ads and more …

Search-Based Scheduling of Experiments in Continuous Deployment

gschermann
September 28, 2018

Search-Based Scheduling of Experiments in Continuous Deployment

gschermann

September 28, 2018
Tweet

Other Decks in Research

Transcript

  1. Search-Based Scheduling of Experiments in Continuous Deployment Gerald Schermann, Philipp

    Leitner software evolution & architecture lab schermann@ifi.uzh.ch @sh3llcat
  2. Continuous Experimentation 97% 3% v1 v2 Monitoring data Successful experimentation

    requires… collecting enough data careful user assignments to avoid overlapping experiments dealing with uncertainty Experiment cancellation, re-iteration, rescheduling releasing resources for other experiments starting experiments as soon as possible for every experiment Variants of the application !3
  3. Continuous Experimentation Successful experimentation requires… collecting enough data careful user

    assignments to avoid overlapping experiments dealing with uncertainty Experiment cancellation, re-iteration, rescheduling releasing resources for other experiments starting experiments as soon as possible for every experiment 97% 3% v1 v2 Monitoring data Variants of the application Optimization Problem Goal: Identifying a valid schedule for executing multiple experiments with maximal fitness !4
  4. Problem Representation Experiment: { "id": 4, "type": "REGRESSION", "baseType": "GradualExperiment",

    "minDuration": 168, “sampleSize": 1000000, "priority": 8, "preferredUserGroup": [ "group3", "group5" ] } regression or business constant or gradual unique interactions !6
  5. Problem Representation Traffic Consumption in % 5 10 15 20

    25 30 Time in Hours 0 5 10 15 constant gradual Experiment: { "id": 4, "type": "REGRESSION", "baseType": "GradualExperiment", "minDuration": 168, “sampleSize": 1000000, "priority": 8, "preferredUserGroup": [ "group3", "group5" ] } regression or business constant or gradual unique interactions !6
  6. Problem Representation Experiment: { "id": 4, "type": "REGRESSION", "baseType": "GradualExperiment",

    "minDuration": 168, “sampleSize": 1000000, "priority": 8, "preferredUserGroup": [ "group3", "group5" ] } regression or business constant or gradual unique interactions !6
  7. Problem Representation Experiment: { "id": 4, "type": "REGRESSION", "baseType": "GradualExperiment",

    "minDuration": 168, “sampleSize": 1000000, "priority": 8, "preferredUserGroup": [ "group3", "group5" ] } regression or business constant or gradual unique interactions Schedule: Schedule Traffic Assignment for Hour 2 of Experiment 4 Execution Plan for Experiment 4 Start Slot ! A 1 A 2 A 3 A N 24 4 % 2 % 0 % UG 1 UG 2 UG 3 0 % UG N … … Exec.Plan Exp 1 Exec.Plan Exp 2 Exec.Plan Exp 3 Exec.Plan Exp 4 Exec.Plan Exp N-1 Exec.Plan Exp N … !7
  8. Problem Representation Experiment: { "id": 4, "type": "REGRESSION", "baseType": "GradualExperiment",

    "minDuration": 168, “sampleSize": 1000000, "priority": 8, "preferredUserGroup": [ "group3", "group5" ] } regression or business constant or gradual unique interactions Schedule: Schedule Traffic Assignment for Hour 2 of Experiment 4 Execution Plan for Experiment 4 Start Slot ! A 1 A 2 A 3 A N 24 4 % 2 % 0 % UG 1 UG 2 UG 3 0 % UG N … … Exec.Plan Exp 1 Exec.Plan Exp 2 Exec.Plan Exp 3 Exec.Plan Exp 4 Exec.Plan Exp N-1 Exec.Plan Exp N … Constraints: same user groups during all time slots [business experiments only] sufficient data points for every time slot non-interrupted experiments sufficient traffic available for every time slot 1 2 3 4 !8
  9. Problem Representation Experiment: { "id": 4, "type": "REGRESSION", "baseType": "GradualExperiment",

    "minDuration": 168, “sampleSize": 1000000, "priority": 8, "preferredUserGroup": [ "group3", "group5" ] } regression or business constant or gradual unique interactions Schedule: dsi = minDuration scheduledDuration ssi = 1 τ usi = ∑d 1 coverage(Ai ) scheduledDuration f = wss * ∑n 1 ssi * pi ∑n 1 pi + wds * ∑n 1 dsi * pi ∑n 1 pi + wus * n ∑ 1 usi * pi Schedule Traffic Assignment for Hour 2 of Experiment 4 Execution Plan for Experiment 4 Start Slot ! A 1 A 2 A 3 A N 24 4 % 2 % 0 % UG 1 UG 2 UG 3 0 % UG N … … Exec.Plan Exp 1 Exec.Plan Exp 2 Exec.Plan Exp 3 Exec.Plan Exp 4 Exec.Plan Exp N-1 Exec.Plan Exp N … Constraints: same user groups during all time slots [business experiments only] sufficient data points for every time slot non-interrupted experiments sufficient traffic available for every time slot 1 2 3 4 1 2 3 Start score: Duration score: User group score: Combined Fitness Score: weighting Start Duration User Group Fitness [weighted-sum strategy]: !9
  10. Problem Representation Constraints: same user groups during all time slots

    [business experiments only] sufficient data points for every time slot non-interrupted experiments sufficient traffic available for every time slot 1 2 3 4 Fitness [weighted-sum strategy]: priority of experiment i Experiment: { "id": 4, "type": "REGRESSION", "baseType": "GradualExperiment", "minDuration": 168, “sampleSize": 1000000, "priority": 8, "preferredUserGroup": [ "group3", "group5" ] } regression or business constant or gradual unique interactions Schedule: Schedule Traffic Assignment for Hour 2 of Experiment 4 Execution Plan for Experiment 4 Start Slot ! A 1 A 2 A 3 A N 24 4 % 2 % 0 % UG 1 UG 2 UG 3 0 % UG N … … Exec.Plan Exp 1 Exec.Plan Exp 2 Exec.Plan Exp 3 Exec.Plan Exp 4 Exec.Plan Exp N-1 Exec.Plan Exp N … dsi = minDuration scheduledDuration ssi = 1 τ usi = ∑d 1 coverage(Ai ) scheduledDuration f = wss * ∑n 1 ssi * pi ∑n 1 pi + wds * ∑n 1 dsi * pi ∑n 1 pi + wus * n ∑ 1 usi * pi 1 2 3 Start score: Duration score: User group score: Combined Fitness Score: Start Duration User Group !10
  11. Approach Genetic Algorithm Random Sampling Local Search Simulated Annealing 1

    2 3 4 Genetic Algorithm: Mimics evolutionary process Reproduction steps within each generation: 1 2 3 4 Parent selection [Fitness Proportionate Selection] Crossover Offspring mutation Fitness and validity evaluation Next generation selection 5 Initial population created using random sampling Chromosome representation: Chromosome Traffic Assignment for Hour 2 of Experiment 4 Execution Plan for Experiment 4 Start Slot ! A 1 A 2 A 3 A N 24 4 % 2 % 0 % UG 1 UG 2 UG 3 0 % UG N … … Exec.Plan Exp 1 Exec.Plan Exp 2 Exec.Plan Exp 3 Exec.Plan Exp 4 Exec.Plan Exp N-1 Exec.Plan Exp N … !11
  12. Approach Crossover: Genetic Algorithm Crossover Offspring mutation Random Sampling Local

    Search Simulated Annealing 1 2 3 4 1 2 0.70 1.00 0.05 0.81 0.22 0.90 Exec.Plan Exp 1 Exec.Plan Exp 2 Exec.Plan Exp 3 Exec.Plan Exp 4 Exec.Plan Exp 5 Exec.Plan Exp 6 0.43 Exec.Plan Exp 4 Exec.Plan Exp 7 0.18 0.71 0.95 0.38 0.20 0.67 0.88 0.55 0.23 Parent A Parent B Offspring 1.00 0.81 0.71 0.38 0.67 0.55 0.90 0.23 Fitness Take generated offspring, randomly apply mutation operations: 1 2 3 4 Pre- or postpone execution of an experiment Shorten / Extend experiment duration Flip user group [entire plan or subset] Add / Remove user group [entire plan or subset] Mutation: !12
  13. Approach Random Sampling: Genetic Algorithm Random Sampling Local Search Simulated

    Annealing 1 2 3 4 Find valid solutions by creating individuals by chance Fitness function for assessing the individuals Constraints for checking individual’s validity Created starting population for GA, local search, and simulated annealing Local Search: Pick best individual of starting population Apply mutation operations of genetic algorithm If resulting fitness score higher, then replace current solution Repeat for multiple iterations Simulated Annealing: Similar to local search Take solutions with worse fitness with a certain probability Escape local optima !13
  14. Evaluation Genetic Algorithm Random Sampling Local Search Simulated Annealing 1

    2 3 4 Evaluation in 3 aspects: 1 2 3 Maximum fitness scored Handling an increasing number of experiments Reevaluating existing schedules !14
  15. { ... "minDuration": 168, “sampleSize": 1000000, ... } Evaluation Setup

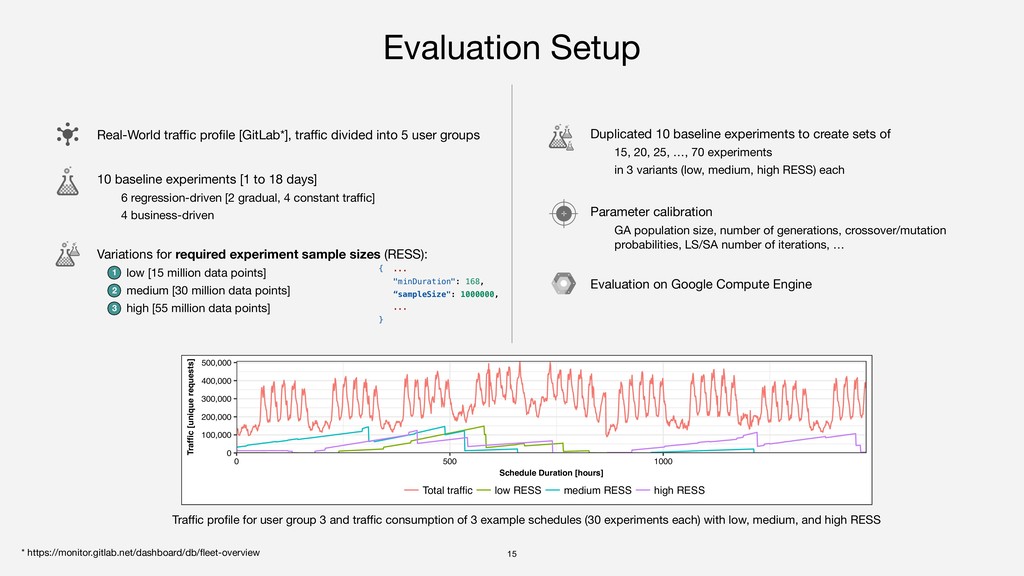
    Real-World traffic profile [GitLab*], traffic divided into 5 user groups * https://monitor.gitlab.net/dashboard/db/fleet-overview Variations for required experiment sample sizes (RESS): low [15 million data points] medium [30 million data points] high [55 million data points] 10 baseline experiments [1 to 18 days] 6 regression-driven [2 gradual, 4 constant traffic] 4 business-driven 1 2 3 Duplicated 10 baseline experiments to create sets of 15, 20, 25, …, 70 experiments in 3 variants (low, medium, high RESS) each Parameter calibration GA population size, number of generations, crossover/mutation probabilities, LS/SA number of iterations, … Evaluation on Google Compute Engine 0 100,000 200,000 300,000 400,000 500,000 0 500 1000 Schedule Duration [hours] Traffic [unique requests] Total traffic low RESS medium RESS high RESS Traffic profile for user group 3 and traffic consumption of 3 example schedules (30 experiments each) with low, medium, and high RESS !15
  16. Scheduling an increasing number of experiments 1 2 3 Scheduling

    10 to 70 experiments Increase by 5 experiments per step 5 runs per step for every algorithm (RS, GA, LS, SA) Every run in 3 variations: low, medium, high RESS 4 • • • • • • • • 0.3 0.4 0.5 0.6 0.7 0.8 0.9 1.0 10 15 20 25 30 35 40 45 Experiments Fitness • random sampling genetic local search SA Number of Experiments Stat. 10 15 20 25 30 35 40 45 RS low Mean 0.1 0.7 1.6 3.7 6.6 16.4 18.1 42.5 low SD 0.0 0.0 0.1 0.4 0.6 3.4 0.9 14.4 high Mean 0.2 1.1 2.3 5.0 9.4 14.5 25.7 43.9 high SD 0.0 0.1 0.1 0.3 0.4 1.0 3.4 14.3 GA low Mean 2.9 9.5 14.2 26.4 36.9 69.7 74.4 129.1 low SD 0.2 1.2 0.5 1.4 2.3 10.6 5.0 23.9 high Mean 5.5 14.5 24.3 45.4 60.6 86.1 110.5 178.5 high SD 0.7 0.9 1.6 1.6 4.8 6.6 6.8 21.0 LS low Mean 3.9 14.9 32.0 54.9 93.9 168.4 204.3 517.2 low SD 0.7 1.7 3.4 5.0 6.7 18.0 13.1 321.6 high Mean 6.6 20.9 47.6 103.2 153.0 194.3 280.2 416.5 high SD 1.3 3.4 8.2 10.6 28.2 28.2 38.3 46.7 SA low Mean 3.9 13.8 32.4 57.6 92.6 169.9 204.7 586.2 low SD 0.6 1.4 1.2 2.8 4.3 7.9 22.4 355.6 high Mean 7.7 21.1 49.9 104.2 159.2 200.0 273.7 453.8 high SD 2.5 3.0 9.7 16.2 34.0 31.3 27.1 126.3 Execution times in minutes for scheduling X experiments with low and high required experimentation sample sizes (RESS) Fitness scores obtained for different algorithms (low, medium, high RESS runs combined) !16
  17. Number of Experiments Stat. 10 15 20 25 30 35

    40 45 RS low Mean 0.1 0.7 1.6 3.7 6.6 16.4 18.1 42.5 low SD 0.0 0.0 0.1 0.4 0.6 3.4 0.9 14.4 high Mean 0.2 1.1 2.3 5.0 9.4 14.5 25.7 43.9 high SD 0.0 0.1 0.1 0.3 0.4 1.0 3.4 14.3 GA low Mean 2.9 9.5 14.2 26.4 36.9 69.7 74.4 129.1 low SD 0.2 1.2 0.5 1.4 2.3 10.6 5.0 23.9 high Mean 5.5 14.5 24.3 45.4 60.6 86.1 110.5 178.5 high SD 0.7 0.9 1.6 1.6 4.8 6.6 6.8 21.0 LS low Mean 3.9 14.9 32.0 54.9 93.9 168.4 204.3 517.2 low SD 0.7 1.7 3.4 5.0 6.7 18.0 13.1 321.6 high Mean 6.6 20.9 47.6 103.2 153.0 194.3 280.2 416.5 high SD 1.3 3.4 8.2 10.6 28.2 28.2 38.3 46.7 SA low Mean 3.9 13.8 32.4 57.6 92.6 169.9 204.7 586.2 low SD 0.6 1.4 1.2 2.8 4.3 7.9 22.4 355.6 high Mean 7.7 21.1 49.9 104.2 159.2 200.0 273.7 453.8 high SD 2.5 3.0 9.7 16.2 34.0 31.3 27.1 126.3 Scheduling an increasing number of experiments 1 2 3 Scheduling 10 to 70 experiments Increase by 5 experiments per step 5 runs per step for every algorithm (RS, GA, LS, SA) Every run in 3 variations: low, medium, high RESS 4 • • • • • • • • 0.3 0.4 0.5 0.6 0.7 0.8 0.9 1.0 10 15 20 25 30 35 40 45 Experiments Fitness • random sampling genetic local search SA Execution times in minutes for scheduling X experiments with low and high required experimentation sample sizes (RESS) Fitness scores obtained for different algorithms (low, medium, high RESS runs combined) !17
  18. Reevaluating existing schedules Fitness scores obtained for different algorithms (reevaluating

    schedule for 30 experiments after 72 hours) Reevaluation takes into account finished, canceled, newly added experiments Reevaluation adjusts (required) sample sizes of running experiments => actual traffic profile vs. estimation => adapt schedules based on gained knowledge Evaluation setup: Select best schedule of GA (74%) for 30 experiments with medium RESS Conduct reevaluation after 72 hours: 3 canceled experiments 3 finished experiments within 72 hours 5 new experiments with medium RESS added 1 2 10 runs in total for every approach • • • • 0.55 0.60 0.65 0.70 0.75 Random Sampling Genetic Local Search Simulated Annealing Fitness Reevaluation Score 30 Exp. Average Genetic Algorithm 73% 68% Local Search 69% 50% Simulated Annealing 67% 51% 1 2 Smaller gap between fitness scores of approaches [mean fitness] Execution times on similar level !18
  19. Discussion Scheduling as part of a release pipeline Promising results

    even on simple cloud instances Further parallelization possible Importance of calibration Fine-tuning of parameters for different numbers of experiments Weighting of objectives (start score, duration score, user group score) Crossover Current “greedy” crossover leads to many invalid schedules Space for improvement taking validity constraints better into account !19
  20. Resources Online Appendix: Source code + build instructions Run instructions

    Replication package including all scripts and sample experiments @sh3llcat schermann@ifi.uzh.ch https://github.com/sealuzh/icsme18-fenrir !20