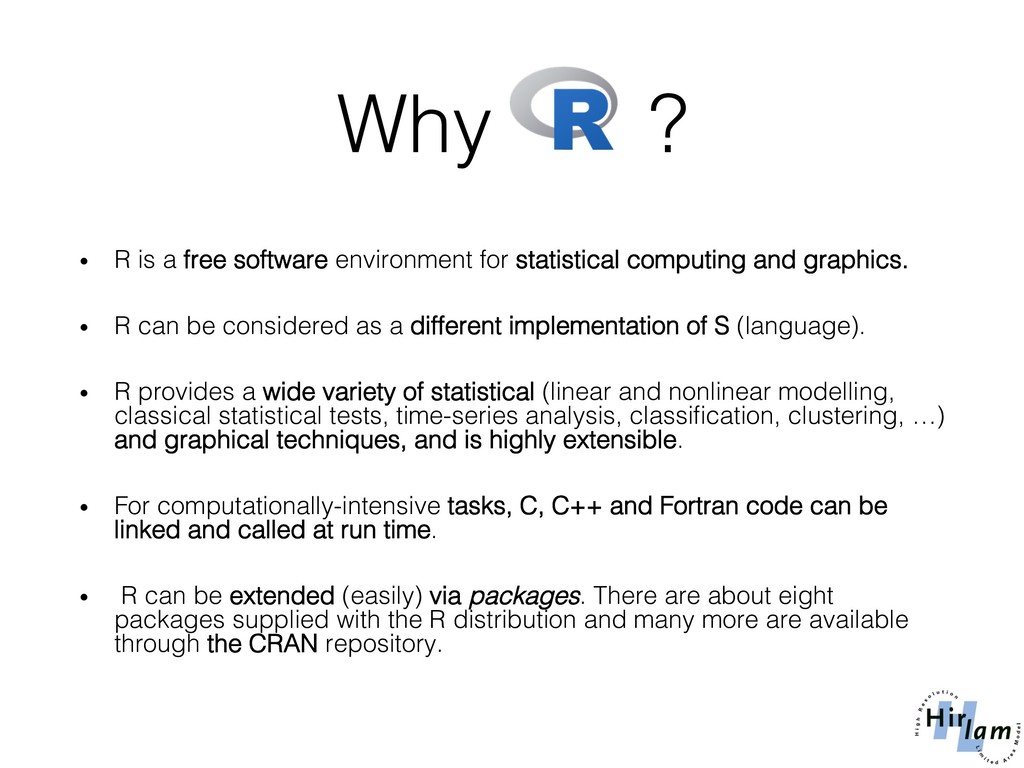
statistical computing and graphics.! • R can be considered as a different implementation of S (language).! • R provides a wide variety of statistical (linear and nonlinear modelling, classical statistical tests, time-series analysis, classification, clustering, …) and graphical techniques, and is highly extensible.! • For computationally-intensive tasks, C, C++ and Fortran code can be linked and called at run time.! • R can be extended (easily) via packages. There are about eight packages supplied with the R distribution and many more are available through the CRAN repository.!
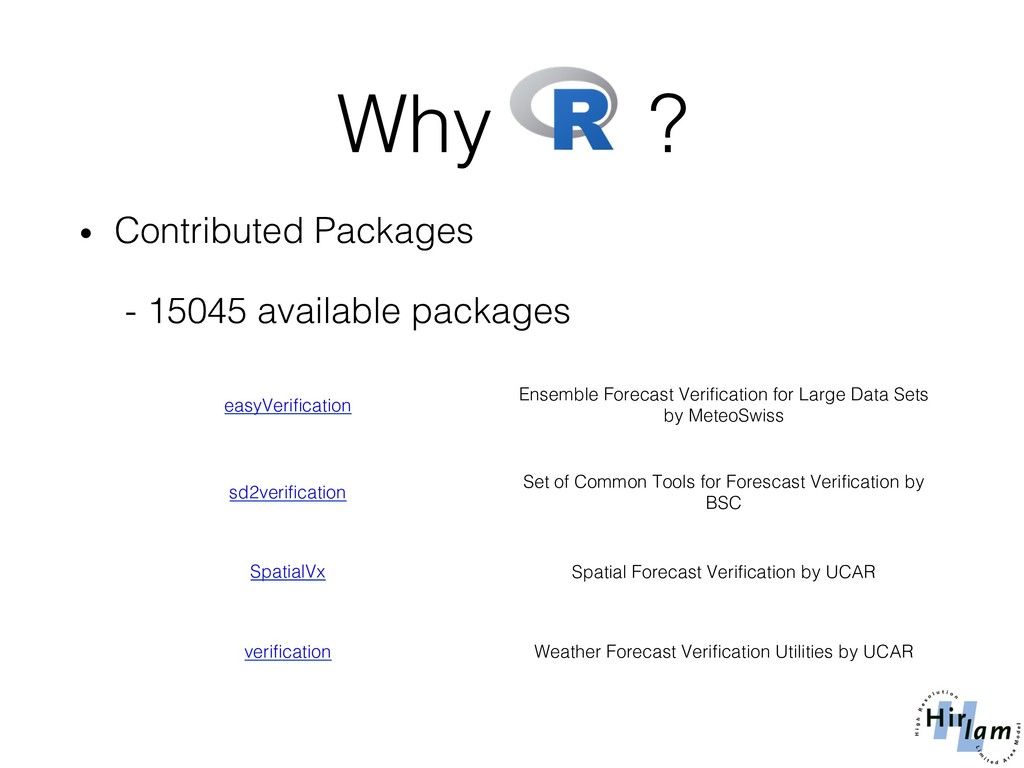
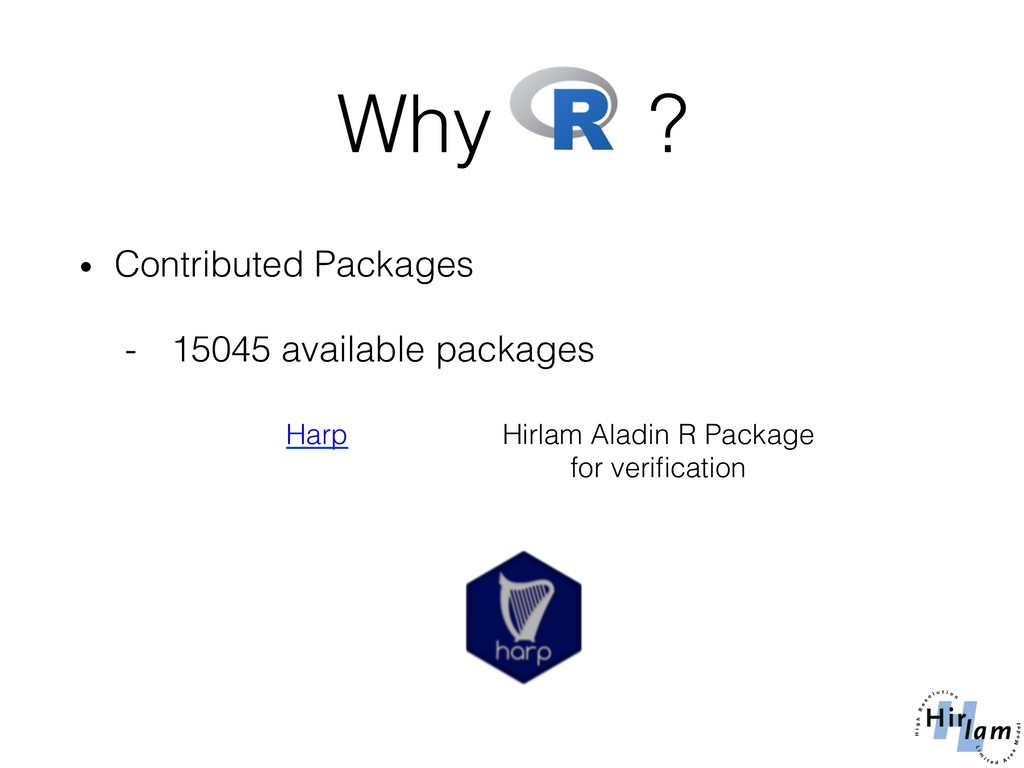
easyVerification! Ensemble Forecast Verification for Large Data Sets by MeteoSwiss! sd2verification! Set of Common Tools for Forescast Verification by BSC! ! SpatialVx! ! Spatial Forecast Verification by UCAR! verification ! Weather Forecast Verification Utilities by UCAR!
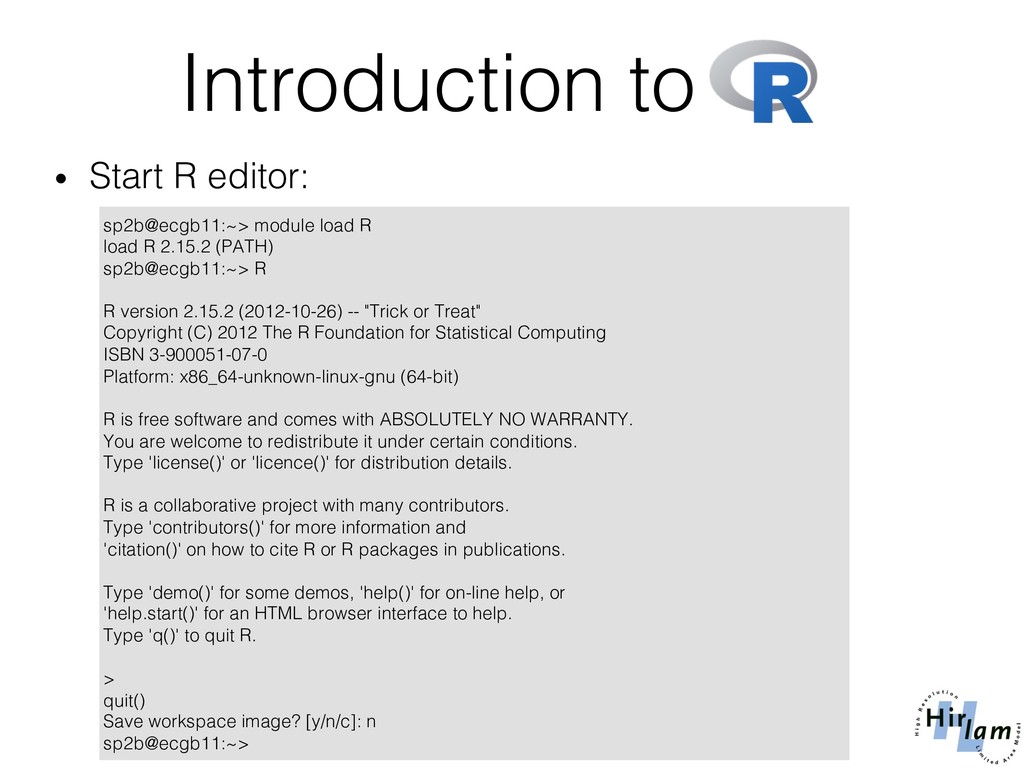
load R 2.15.2 (PATH)! sp2b@ecgb11:~> R! ! R version 2.15.2 (2012-10-26) -- "Trick or Treat"! Copyright (C) 2012 The R Foundation for Statistical Computing! ISBN 3-900051-07-0! Platform: x86_64-unknown-linux-gnu (64-bit)! ! R is free software and comes with ABSOLUTELY NO WARRANTY.! You are welcome to redistribute it under certain conditions.! Type 'license()' or 'licence()' for distribution details.! ! R is a collaborative project with many contributors.! Type 'contributors()' for more information and! 'citation()' on how to cite R or R packages in publications.! ! Type 'demo()' for some demos, 'help()' for on-line help, or! 'help.start()' for an HTML browser interface to help.! Type 'q()' to quit R.! ! > ! quit()! Save workspace image? [y/n/c]: n! sp2b@ecgb11:~> ! Introduction to !
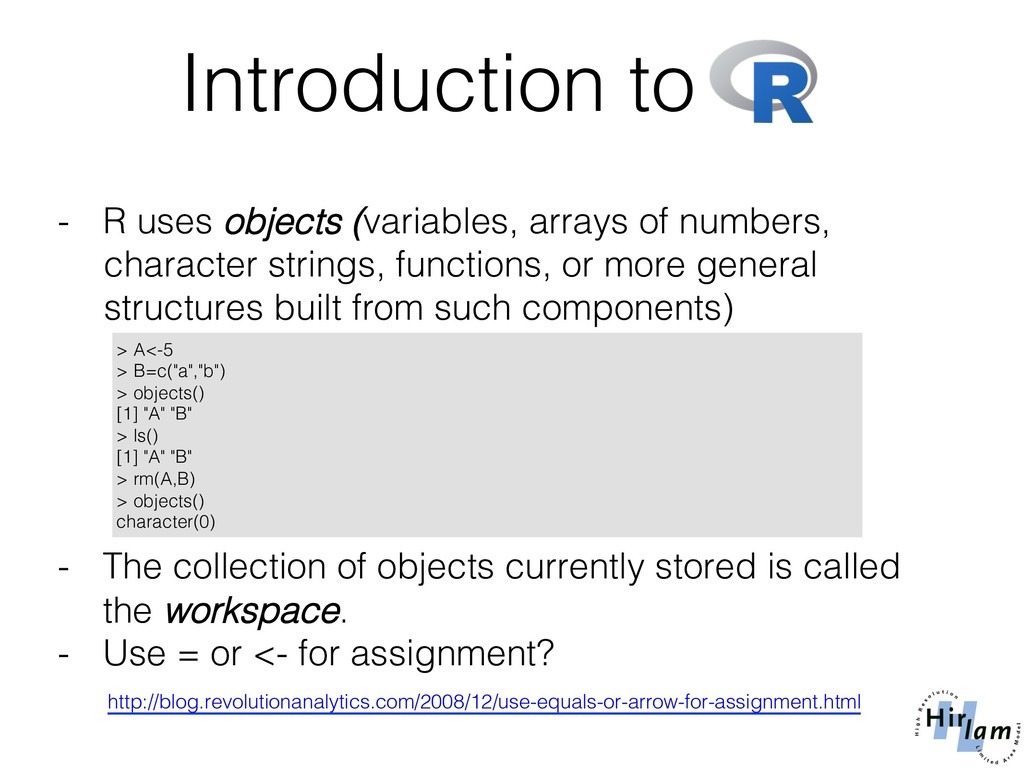
(variables, arrays of numbers, character strings, functions, or more general structures built from such components) ! ! ! ! ! ! - The collection of objects currently stored is called the workspace.! - Use = or <- for assignment?! http://blog.revolutionanalytics.com/2008/12/use-equals-or-arrow-for-assignment.html! ! > A<-5! > B=c("a","b")! > objects()! [1] "A" "B"! > ls()! [1] "A" "B"! > rm(A,B)! > objects()! character(0)!
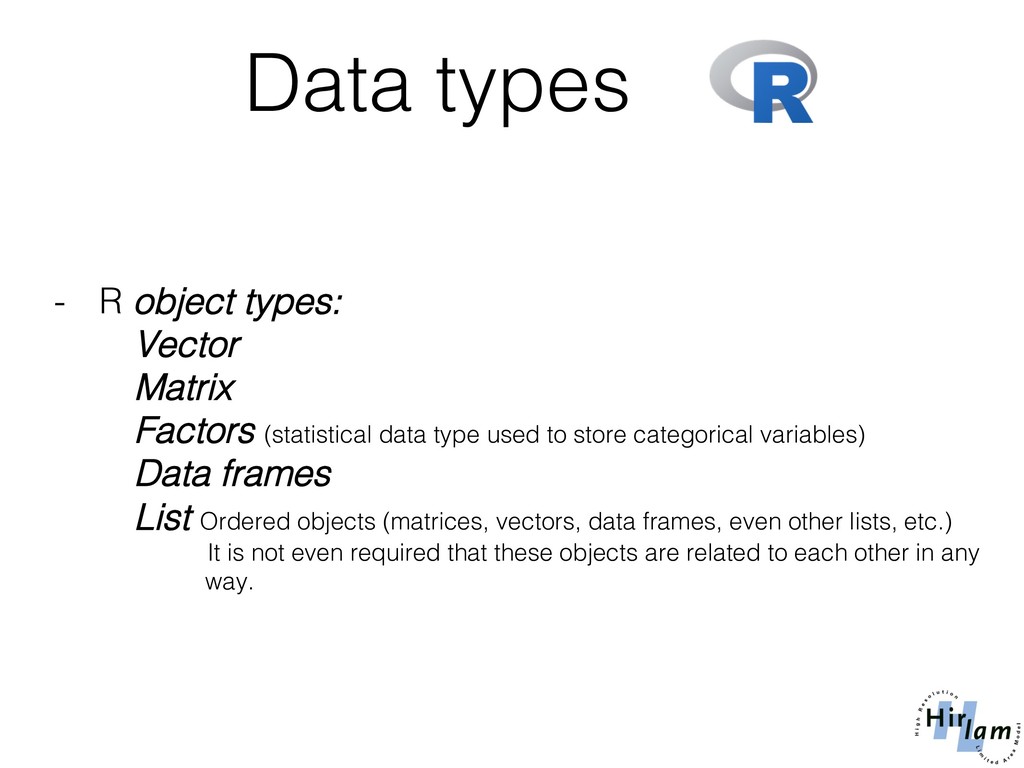
Vector! Matrix! Factors (statistical data type used to store categorical variables)! Data frames! List Ordered objects (matrices, vectors, data frames, even other lists, etc.) ! It is not even required that these objects are related to each other in any ! way.! !
! x[‐n]! all but the nth element ! x[1:n]! first n elements! x[‐(1:n)]! elements from n+1 to end! x[c(1,4,2)] ! specific elements ! x[ʺnameʺ] ! element named "name" ! x[x > 3]! all elements greater than 3 ! x[x > 3 & x < 5] ! all elements between 3 and 5 ! x[x %in% c(ʺaʺ,ʺifʺ)]! elements in the given set! Indexing vectors
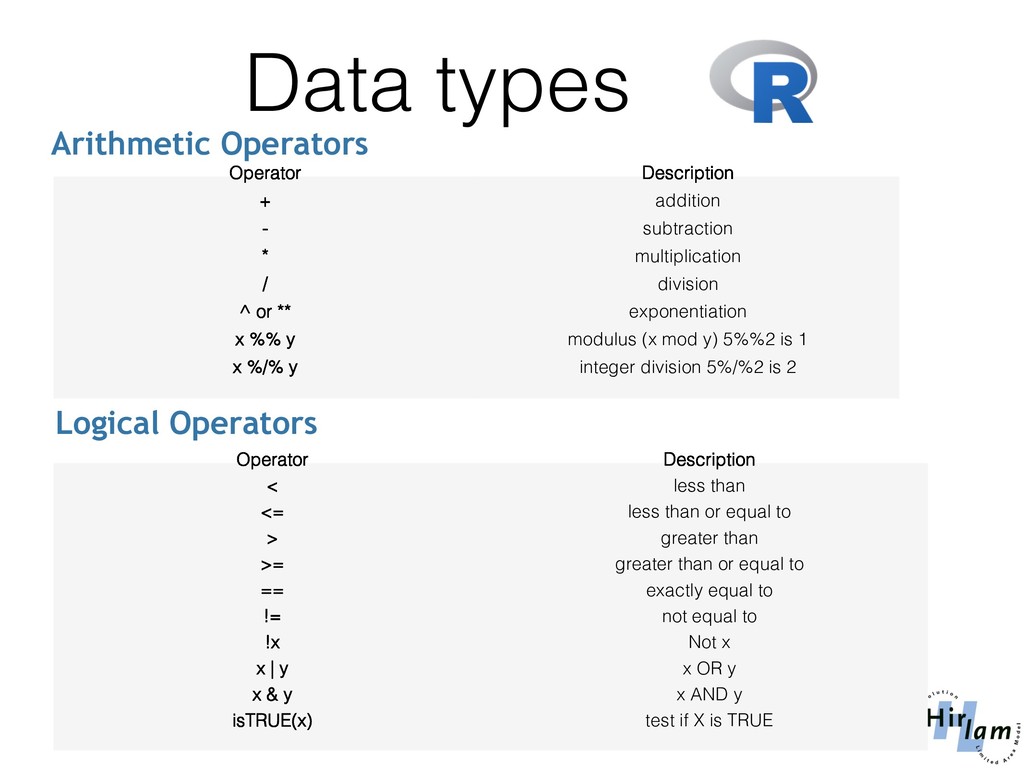
-! subtraction! *! multiplication! /! division! ^ or **! exponentiation! x %% y! modulus (x mod y) 5%%2 is 1! x %/% y! integer division 5%/%2 is 2! Arithmetic Operators Operator! Description! <! less than! <=! less than or equal to! >! greater than! >=! greater than or equal to! ==! exactly equal to! !=! not equal to! !x! Not x! x | y! x OR y! x & y! x AND y! isTRUE(x)! test if X is TRUE! Logical Operators
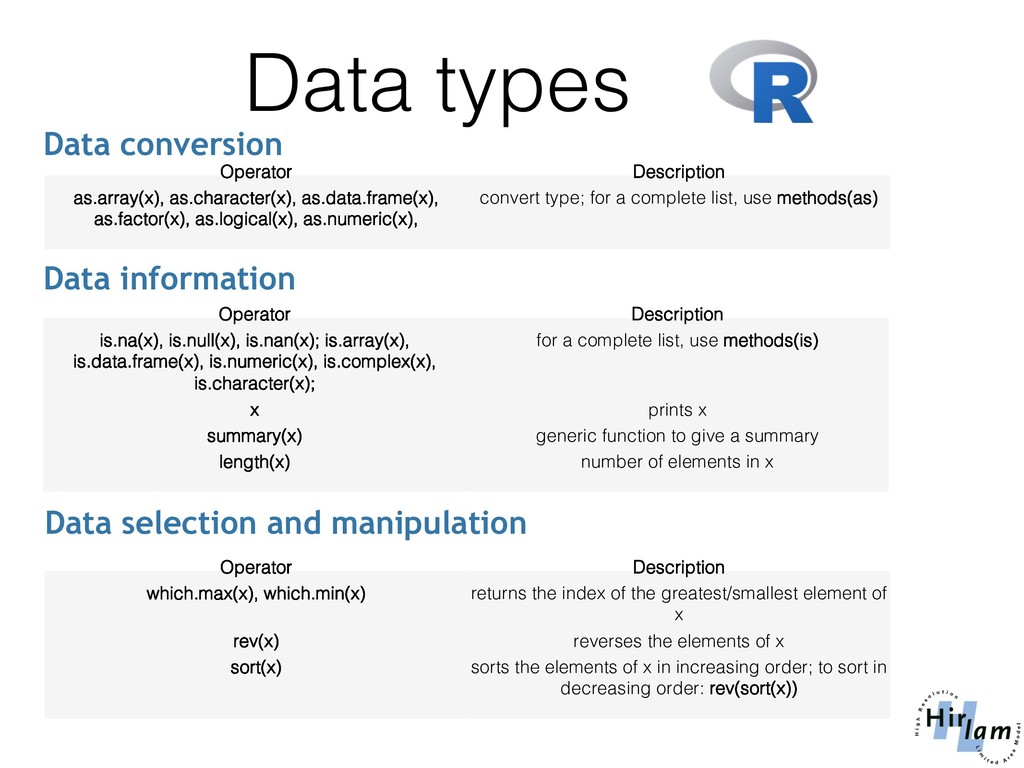
as.factor(x), as.logical(x), as.numeric(x),! convert type; for a complete list, use methods(as)! Data conversion Operator! Description! is.na(x), is.null(x), is.nan(x); is.array(x), is.data.frame(x), is.numeric(x), is.complex(x), is.character(x); ! for a complete list, use methods(is)! x! prints x! summary(x)! generic function to give a summary! length(x)! number of elements in x! Data information ! Operator! Description! which.max(x), which.min(x)! returns the index of the greatest/smallest element of x ! rev(x)! reverses the elements of x ! sort(x)! sorts the elements of x in increasing order; to sort in decreasing order: rev(sort(x))! Data selection and manipulation
k l ! 1 4 7 10 ! > A[,2]! a b c ! 4 5 6 ! > A[1,2]! [1] 4! > A["a",]! i j k l ! 1 4 7 10! >summary(A)! i j k l ! Min. :1.0 Min. :4.0 Min. :7.0 Min. :10.0 ! 1st Qu.:1.5 1st Qu.:4.5 1st Qu.:7.5 1st Qu.:10.5 ! Median :2.0 Median :5.0 Median :8.0 Median :11.0 ! Mean :2.0 Mean :5.0 Mean :8.0 Mean :11.0 ! 3rd Qu.:2.5 3rd Qu.:5.5 3rd Qu.:8.5 3rd Qu.:11.5 ! Max. :3.0 Max. :6.0 Max. :9.0 Max. :12.0! > rowSums(A)! a b c ! 22 26 30 ! > colSums(A)! i j k l ! 6 15 24 33! Matrix
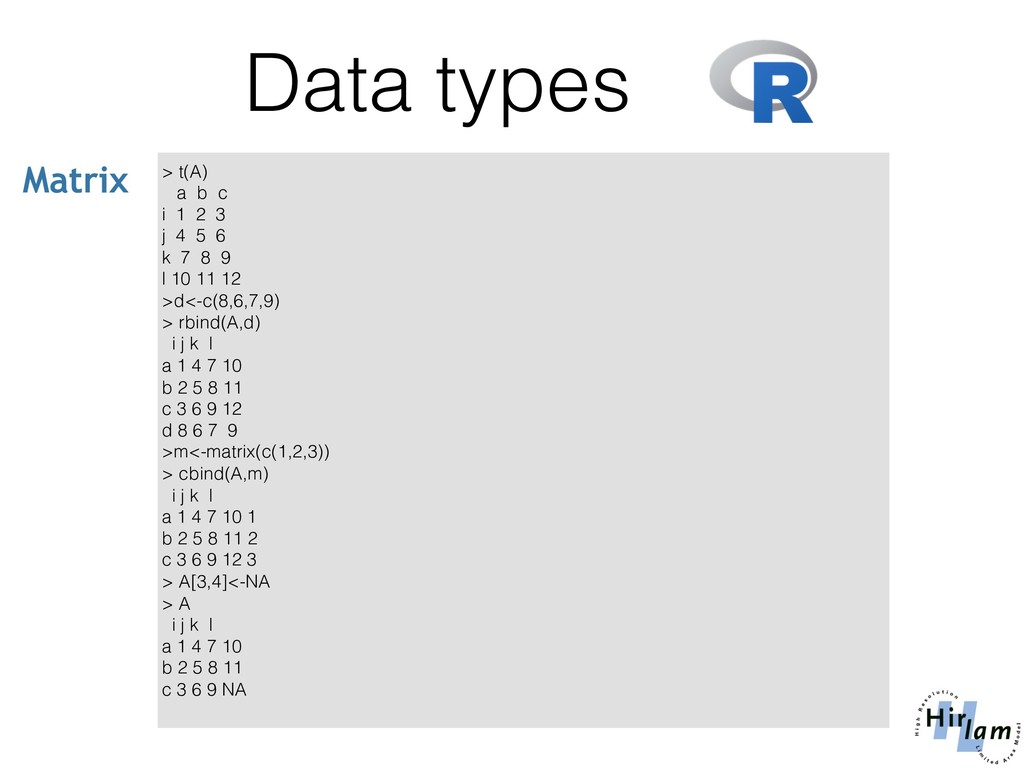
1 2 3! j 4 5 6! k 7 8 9! l 10 11 12! >d<-c(8,6,7,9)! > rbind(A,d)! i j k l! a 1 4 7 10! b 2 5 8 11! c 3 6 9 12! d 8 6 7 9! >m<-matrix(c(1,2,3))! > cbind(A,m)! i j k l ! a 1 4 7 10 1! b 2 5 8 11 2! c 3 6 9 12 3! > A[3,4]<-NA ! > A! i j k l! a 1 4 7 10! b 2 5 8 11! c 3 6 9 NA! ! Matrix
row i, column j ! x[i,]! row i ! x[,j] ! column j! x[,c(1,3)] ! columns 1 and 3 ! x[ʺnameʺ,] ! row named "name" ! Indexing matrices Operator! Description! dim(x)! Retrieve or set the dimension of an object; ! dim(x) <‐ c(3,2)! dimnames(x)! Retrieve or set the dimension names of an object! nrow(x), ncol(x)! ) number of rows/cols;! Data information ! Operator! Description! t(x)! transpose ! rowSums(x), colSum(x) ! sum of rows/cols for a matrix-like object ! rbind(...) , cbind(...)! combines supplied matrices, data frames, etc. by rows or cols ! Matrix operations
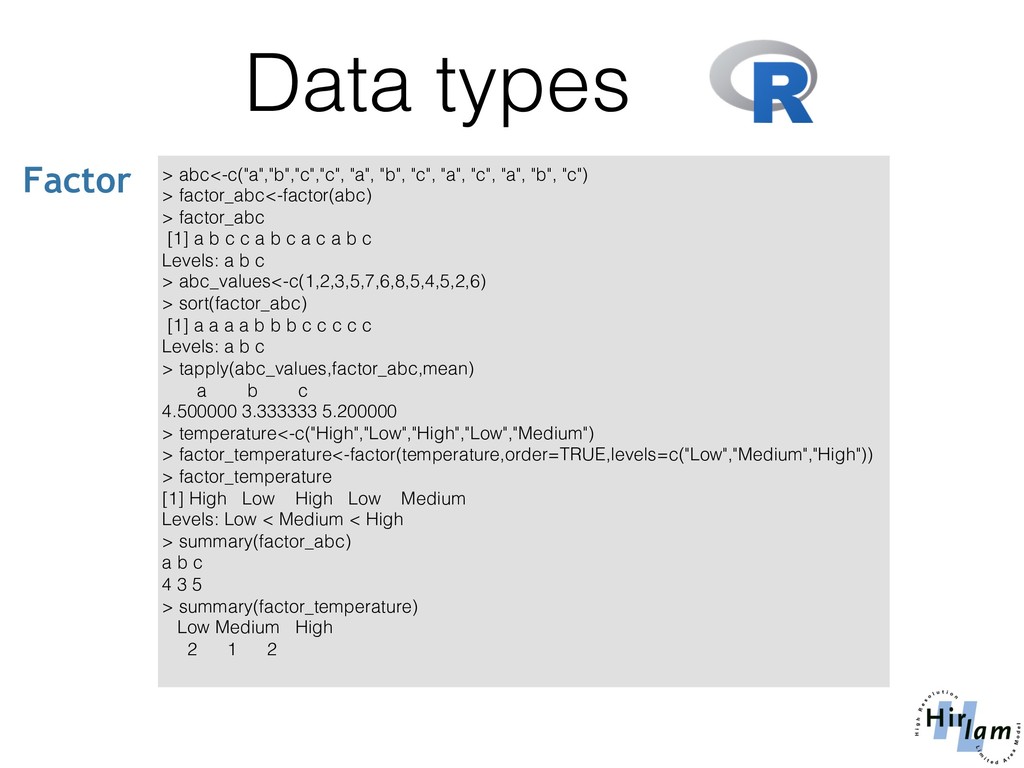
"c", "a", "b", "c")! > factor_abc<-factor(abc)! > factor_abc! [1] a b c c a b c a c a b c! Levels: a b c! > abc_values<-c(1,2,3,5,7,6,8,5,4,5,2,6)! > sort(factor_abc)! [1] a a a a b b b c c c c c! Levels: a b c! > tapply(abc_values,factor_abc,mean)! a b c ! 4.500000 3.333333 5.200000 ! > temperature<-c("High","Low","High","Low","Medium")! > factor_temperature<-factor(temperature,order=TRUE,levels=c("Low","Medium","High"))! > factor_temperature! [1] High Low High Low Medium! Levels: Low < Medium < High! > summary(factor_abc)! a b c ! 4 3 5 ! > summary(factor_temperature)! Low Medium High ! 2 1 2 ! ! Factor
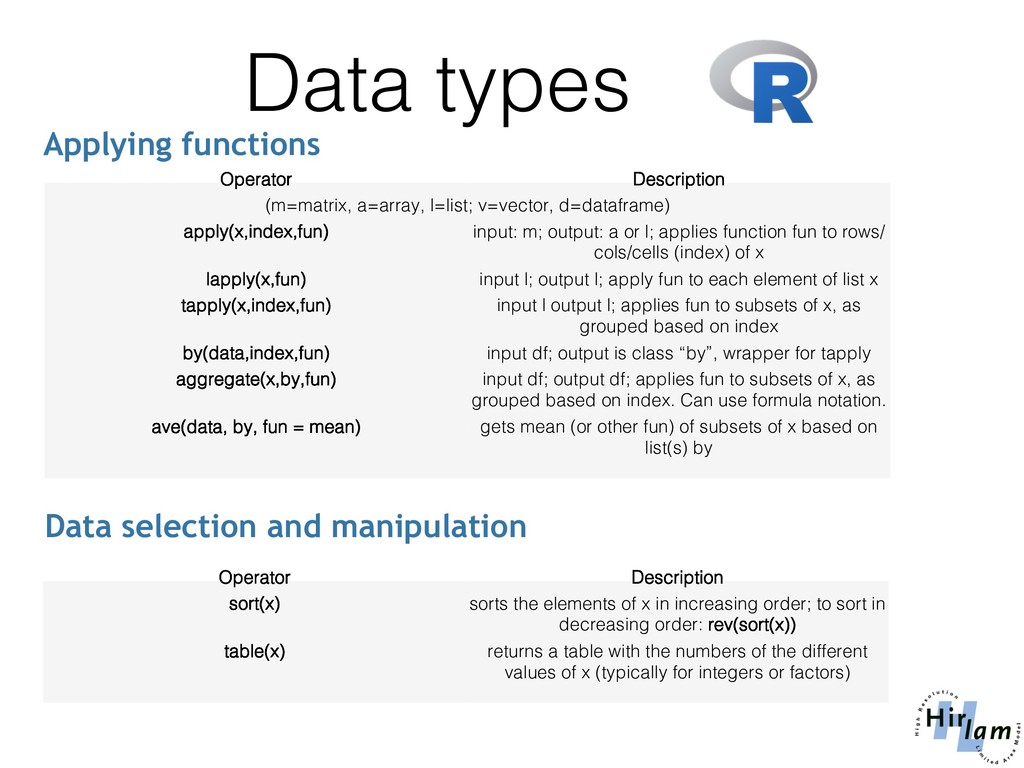
v=vector, d=dataframe)! apply(x,index,fun)! input: m; output: a or l; applies function fun to rows/ cols/cells (index) of x! lapply(x,fun)! input l; output l; apply fun to each element of list x ! tapply(x,index,fun) ! input l output l; applies fun to subsets of x, as grouped based on index ! by(data,index,fun)! input df; output is class “by”, wrapper for tapply! aggregate(x,by,fun) ! input df; output df; applies fun to subsets of x, as grouped based on index. Can use formula notation. ! ave(data, by, fun = mean)! gets mean (or other fun) of subsets of x based on list(s) by! Applying functions ! Operator! Description! sort(x)! sorts the elements of x in increasing order; to sort in decreasing order: rev(sort(x))! table(x)! returns a table with the numbers of the different values of x (typically for integers or factors) ! Data selection and manipulation
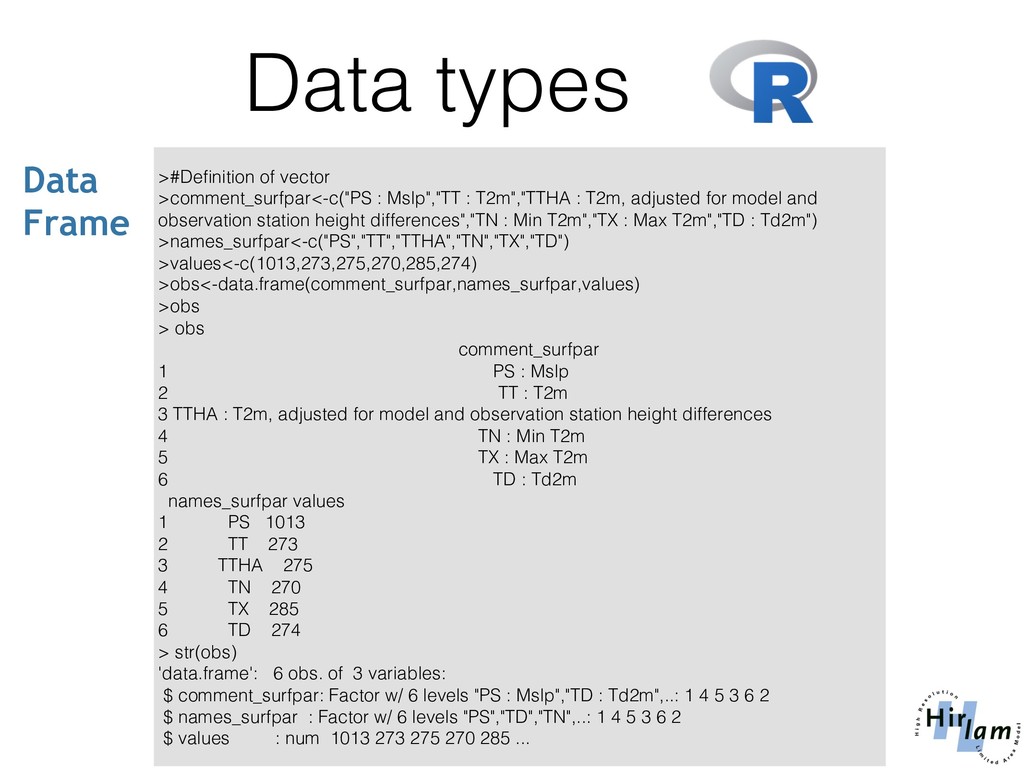
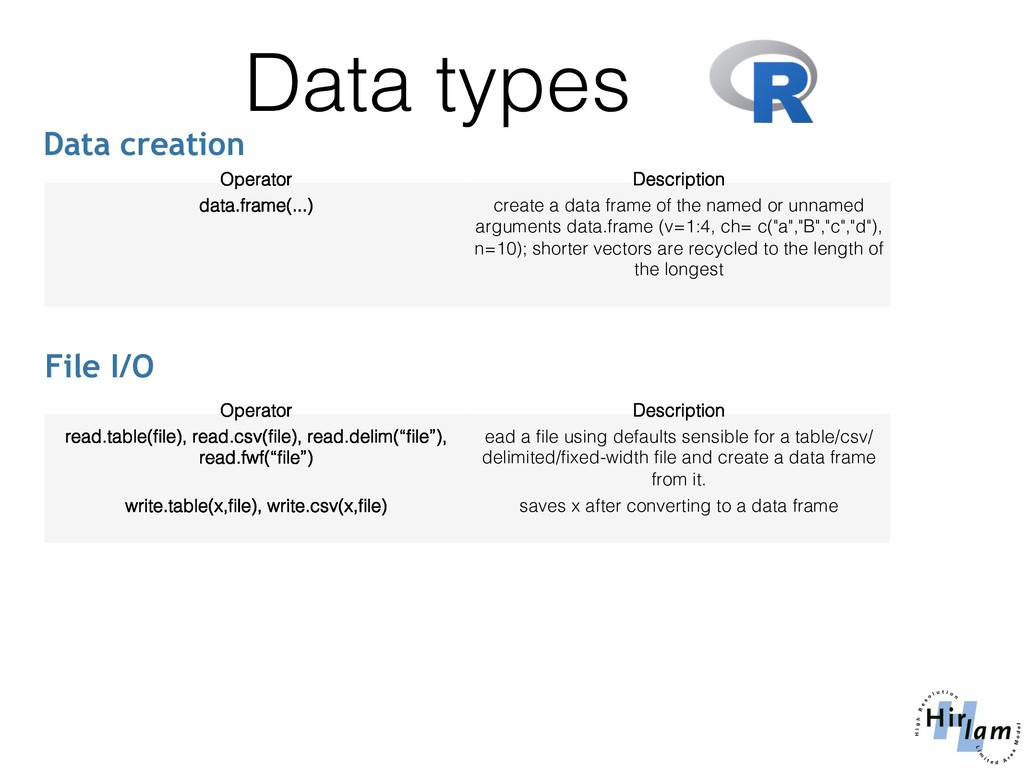
data frame of the named or unnamed arguments data.frame (v=1:4, ch= c("a","B","c","d"), n=10); shorter vectors are recycled to the length of the longest ! Data creation ! Operator! Description! read.table(file), read.csv(file), read.delim(“file”), read.fwf(“file”)! ead a file using defaults sensible for a table/csv/ delimited/fixed-width file and create a data frame from it. ! write.table(x,file), write.csv(x,file)! saves x after converting to a data frame! File I/O
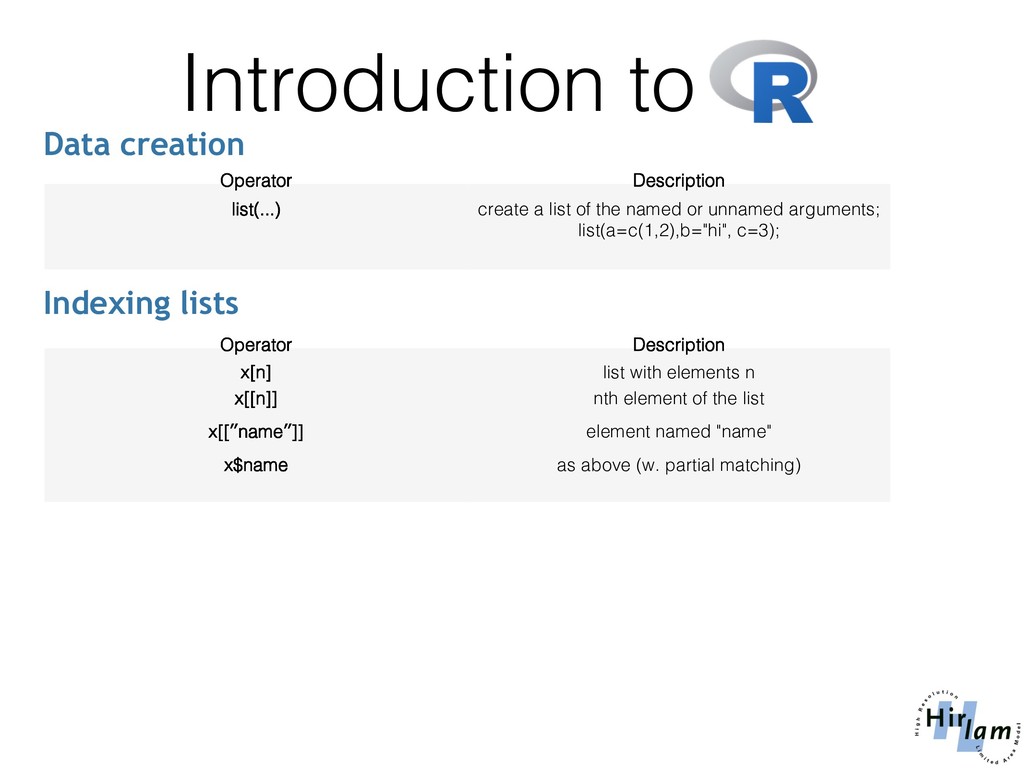
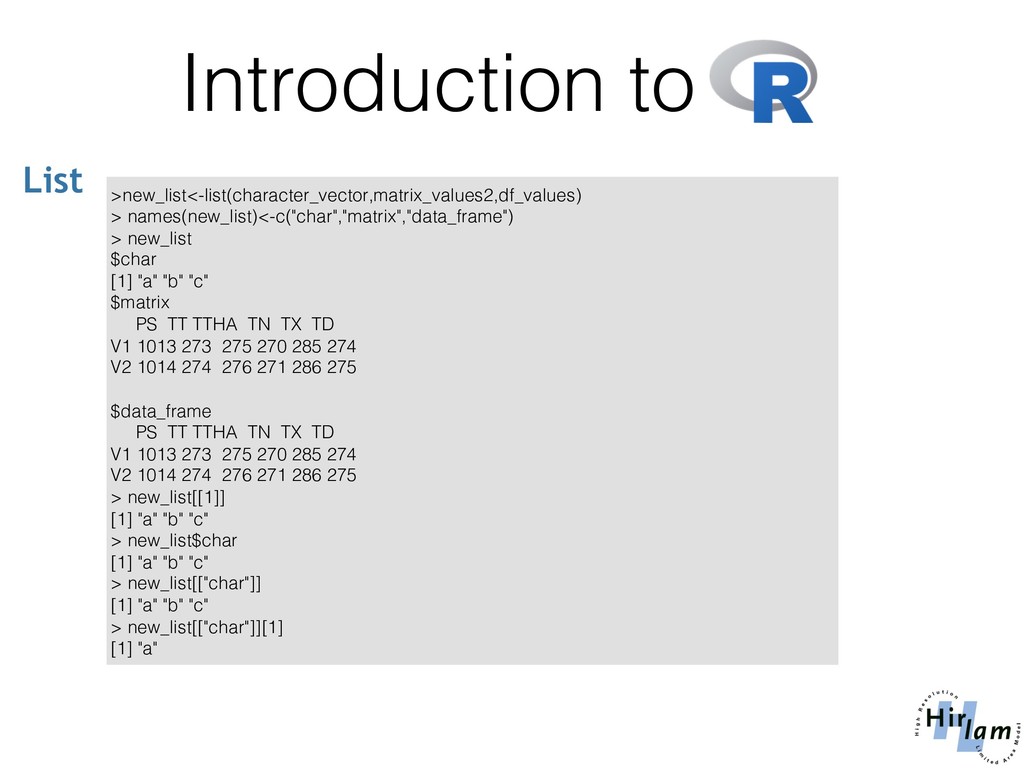
a list of the named or unnamed arguments; list(a=c(1,2),b="hi", c=3); ! Data creation ! Operator! Description! x[n] ! list with elements n ! x[[n]]! nth element of the list! x[[ʺnameʺ]] ! element named "name" ! x$name! as above (w. partial matching) ! Indexing lists
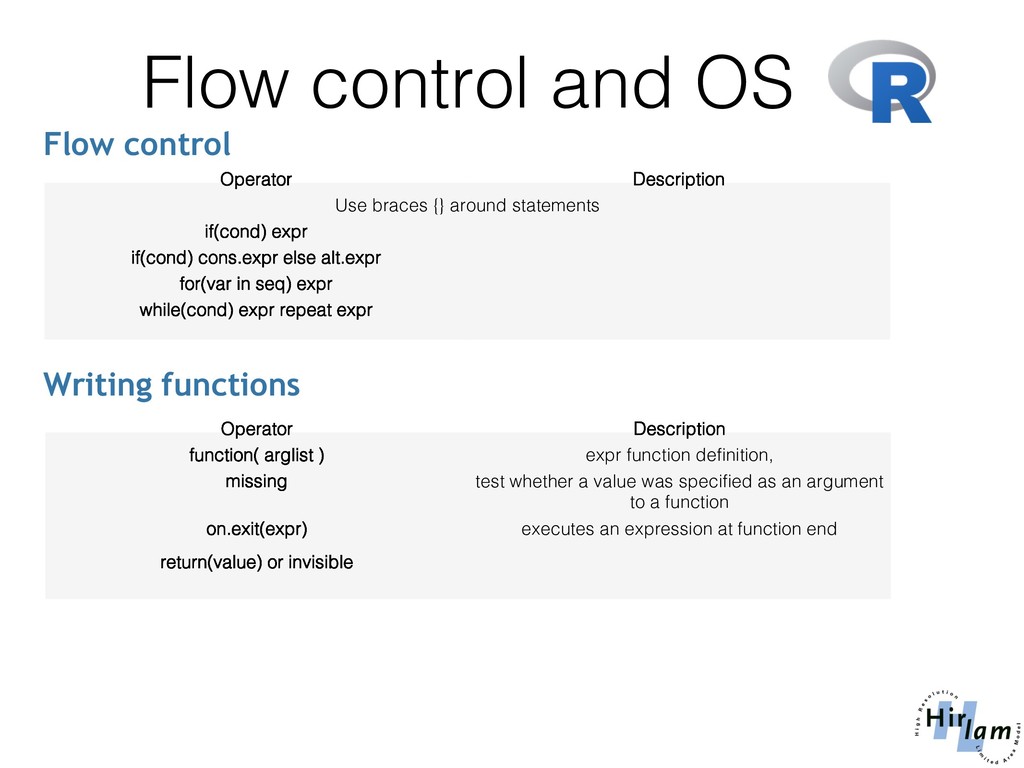
Use braces {} around statements ! if(cond) expr! if(cond) cons.expr else alt.expr! for(var in seq) expr! while(cond) expr repeat expr! Flow control ! Operator! Description! function( arglist ) ! expr function definition, ! missing! ! test whether a value was specified as an argument to a function ! on.exit(expr)! executes an expression at function end! return(value) or invisible! Writing functions
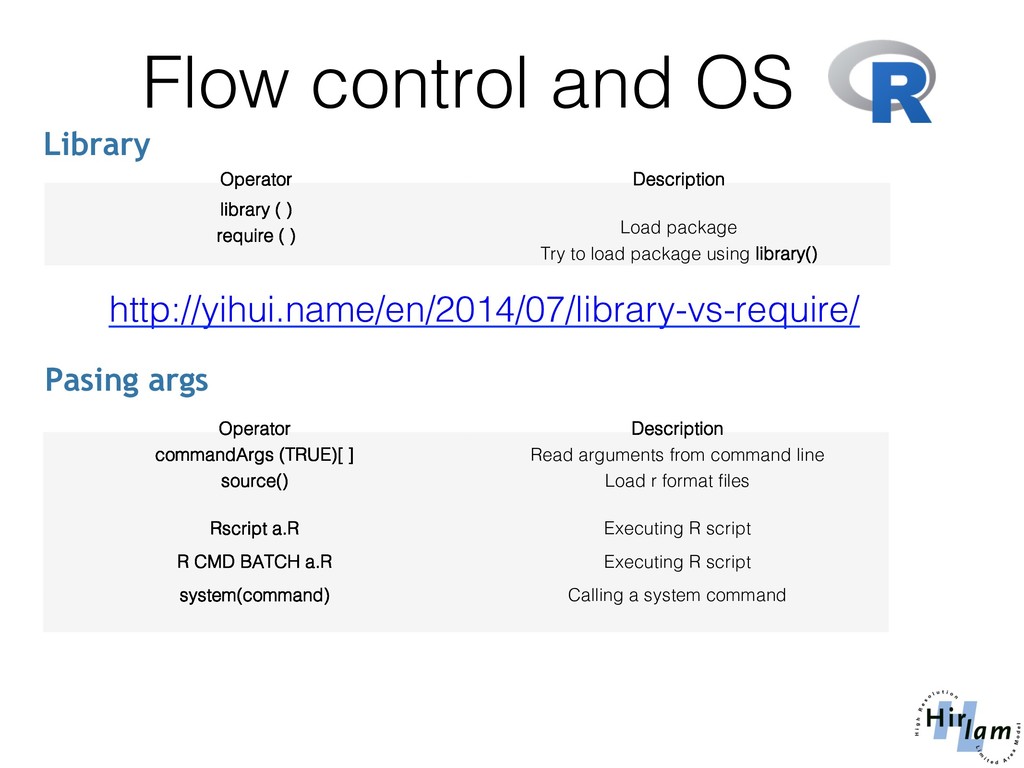
library ( )! Load package ! require ( )! Try to load package using library()! Library ! Operator! Description! commandArgs (TRUE)[ ]! Read arguments from command line ! source()! ! Load r format files ! Rscript a.R! Executing R script! R CMD BATCH a.R! Executing R script! system(command)! Calling a system command! Pasing args http://yihui.name/en/2014/07/library-vs-require/!

 Your Podcast. Everywhere. Effortlessly.


 harp
harp
 naoji_taniguchi_ksk_0827
 drpoonamkc
 signer
 akiraasano
 yoshimura_datam
 mutomasa
 uranoken
 ainischool
 frievea
 pawan_pharm
 bvr7352
 terasawat
 lynnandtonic
 hatefulcrawdad
 marktimemedia
 geshan
 lcolladotor
 raygrieselhuber
 tomoyanonymous
 baasie
 livdayseo
 lindahogenes
 tamaranovitovic
![Daniel Santos ([email protected])! Introduction to R programming](https://files.speakerdeck.com/presentations/41bf798c30654d4f85c8d7971e882f76/slide_0.jpg)
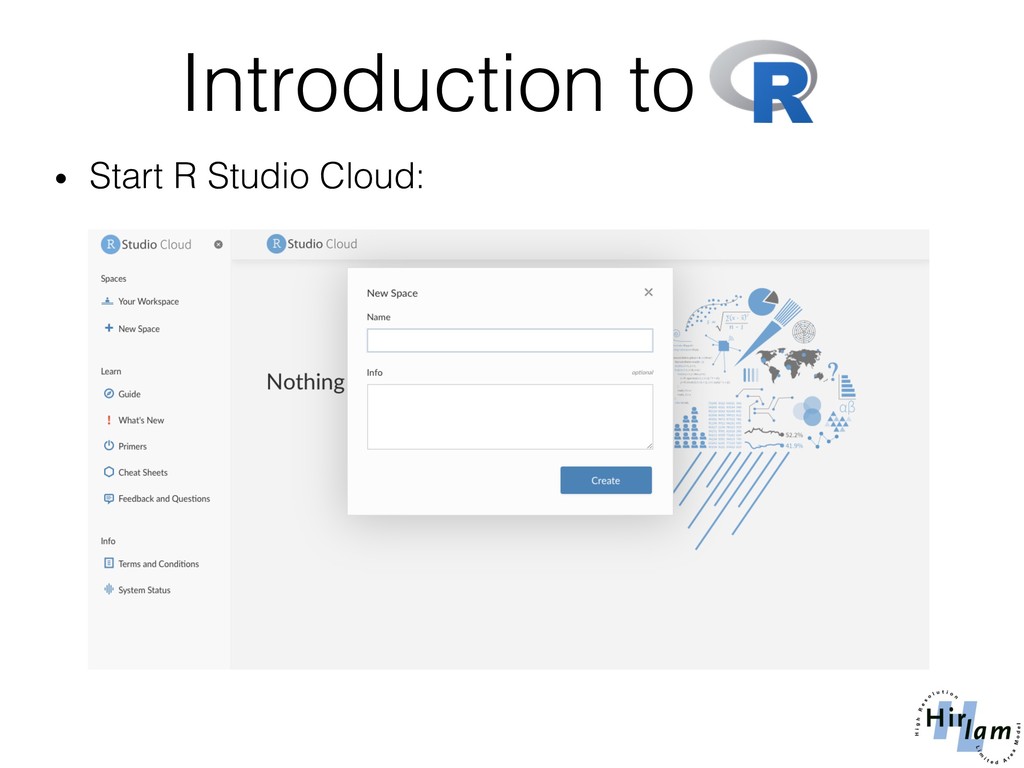
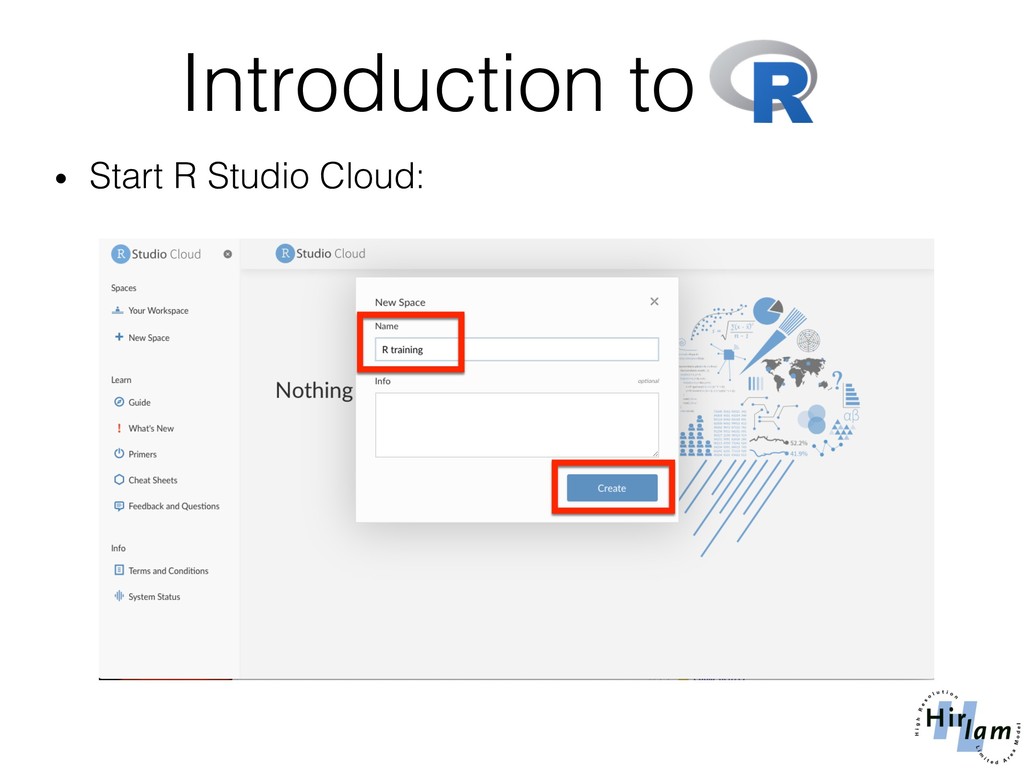
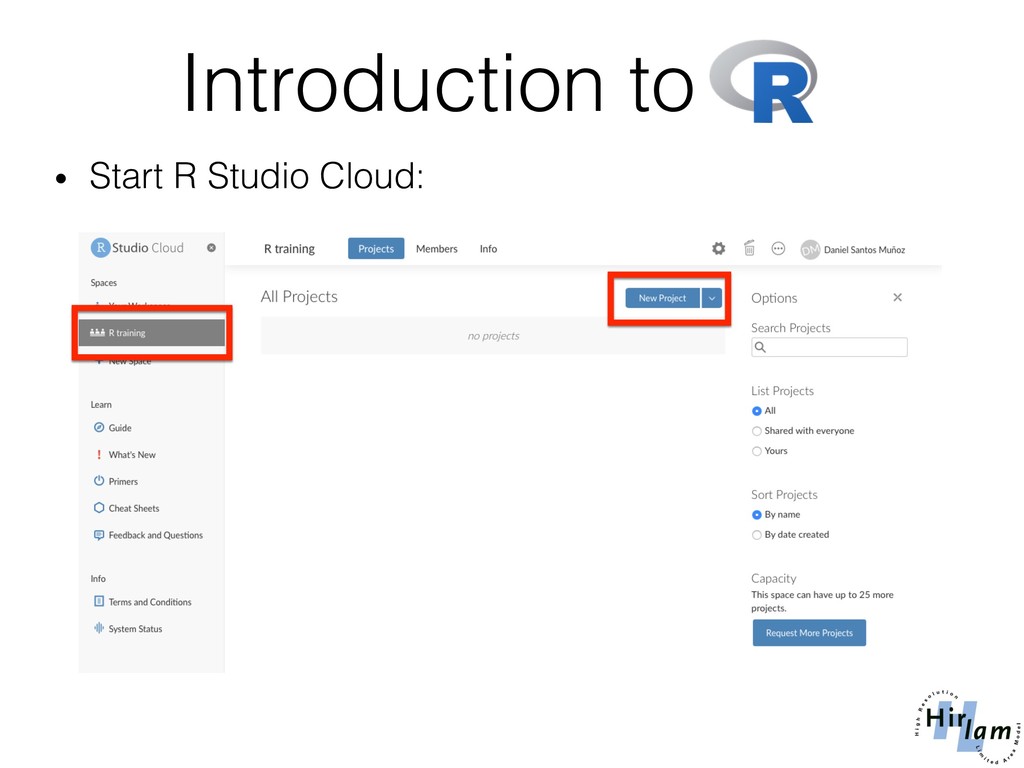
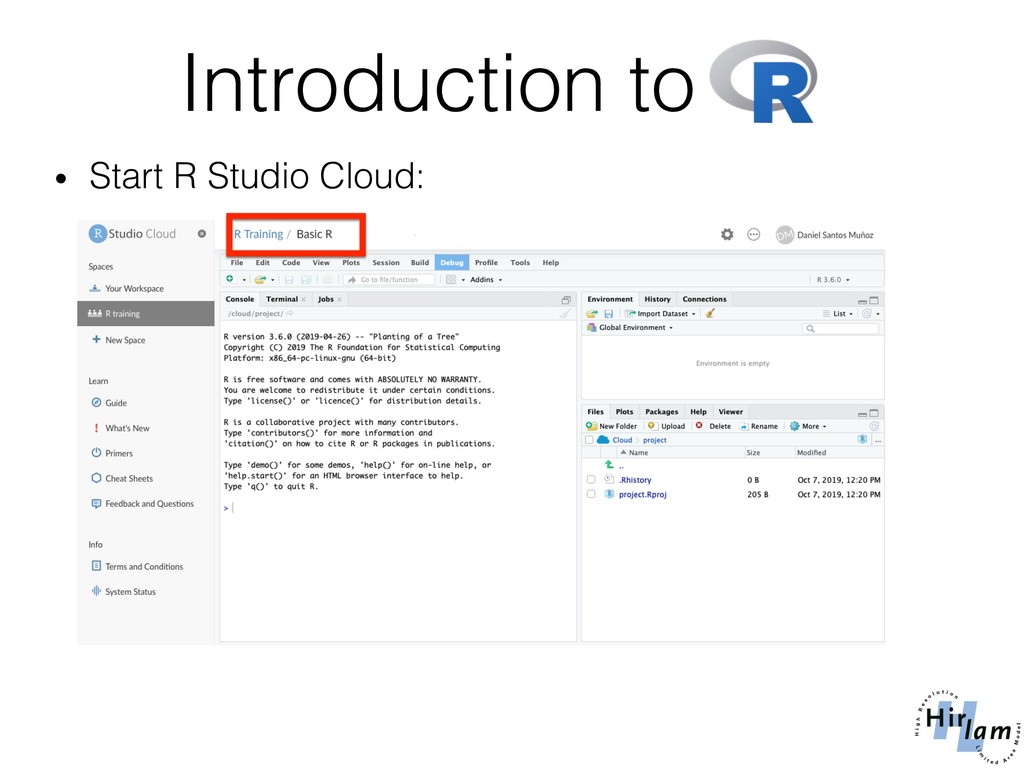
![! ! Data types! > numeric_vector<-c(1,2,3)! > numeric_vector! [1] 1](https://files.speakerdeck.com/presentations/41bf798c30654d4f85c8d7971e882f76/slide_18.jpg)
![! ! Data types! ! Operator! Description! x[n]! nth element](https://files.speakerdeck.com/presentations/41bf798c30654d4f85c8d7971e882f76/slide_19.jpg)
![! ! Data types! > length(numeric_vector)! [1] 3! > summary(numeric_vector)!](https://files.speakerdeck.com/presentations/41bf798c30654d4f85c8d7971e882f76/slide_21.jpg)
![! ! Data types ! > byrow=TRUE,nrow=3)! [,1] [,2] [,](https://files.speakerdeck.com/presentations/41bf798c30654d4f85c8d7971e882f76/slide_23.jpg)
![! ! Data types ! > A[1,] ! i j](https://files.speakerdeck.com/presentations/41bf798c30654d4f85c8d7971e882f76/slide_24.jpg)
![! ! Data types! ! Operator! Description! x[i,j]! element at](https://files.speakerdeck.com/presentations/41bf798c30654d4f85c8d7971e882f76/slide_26.jpg)
![! ! Data types! > obs[1,2]! [1] PS! Levels: PS](https://files.speakerdeck.com/presentations/41bf798c30654d4f85c8d7971e882f76/slide_30.jpg)
![! ! Introduction to ! [1] "a"char"]][! > new_list2<-c(new_list,char2=c("d"))! >](https://files.speakerdeck.com/presentations/41bf798c30654d4f85c8d7971e882f76/slide_33.jpg)