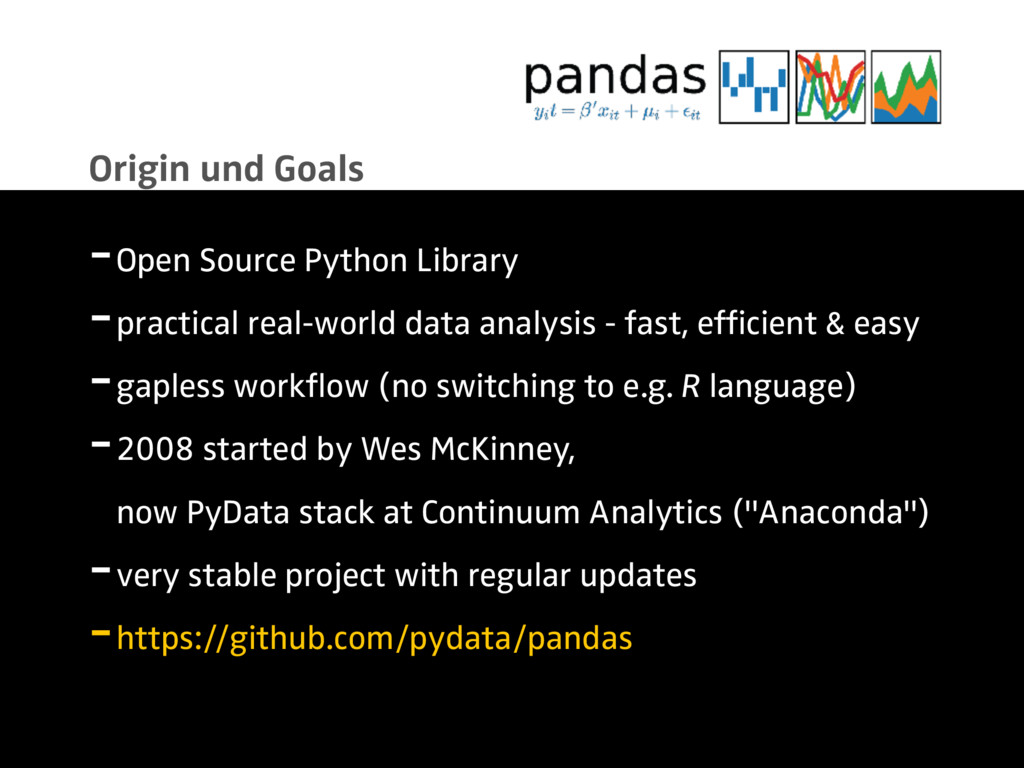
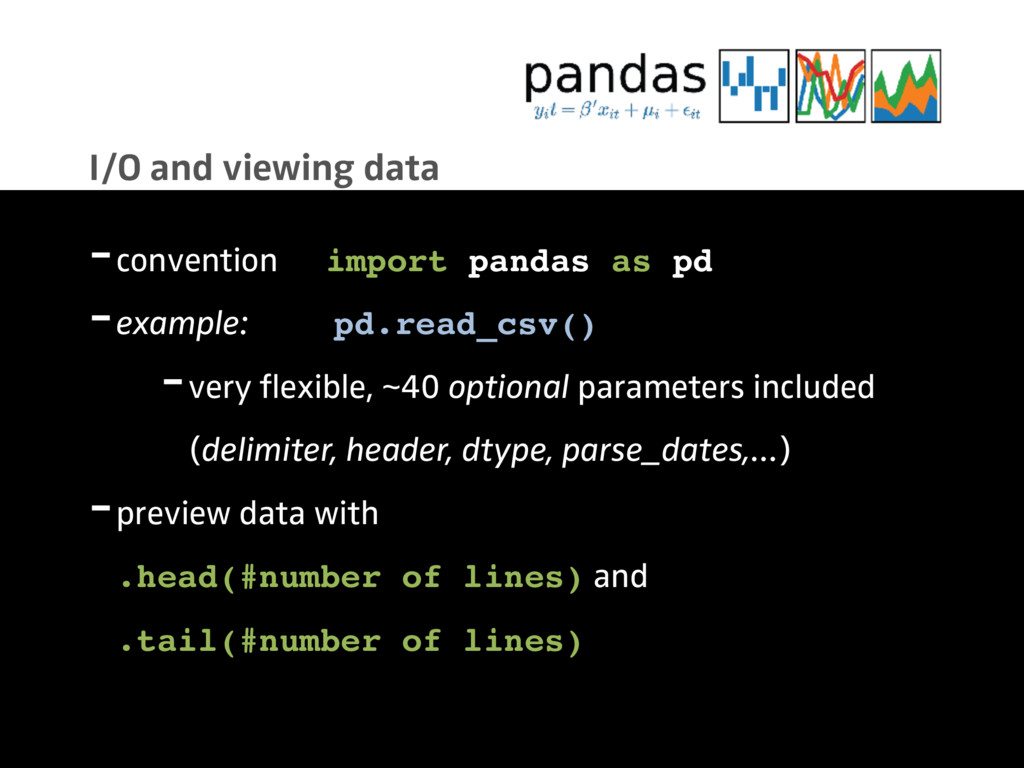
Pandas is the Swiss-Multipurpose Knife for Data Analysis in Python. With Pandas dealing with data-analysis is easy and simple but there are some things you need to get your head around first as Data-Frames and Data-Series.
The first part of talk with provide an introduction to Pandas for beginners, while the second part will focus on Time Series Analysis with Pandas.
part one (~40") Introduction to Pandas
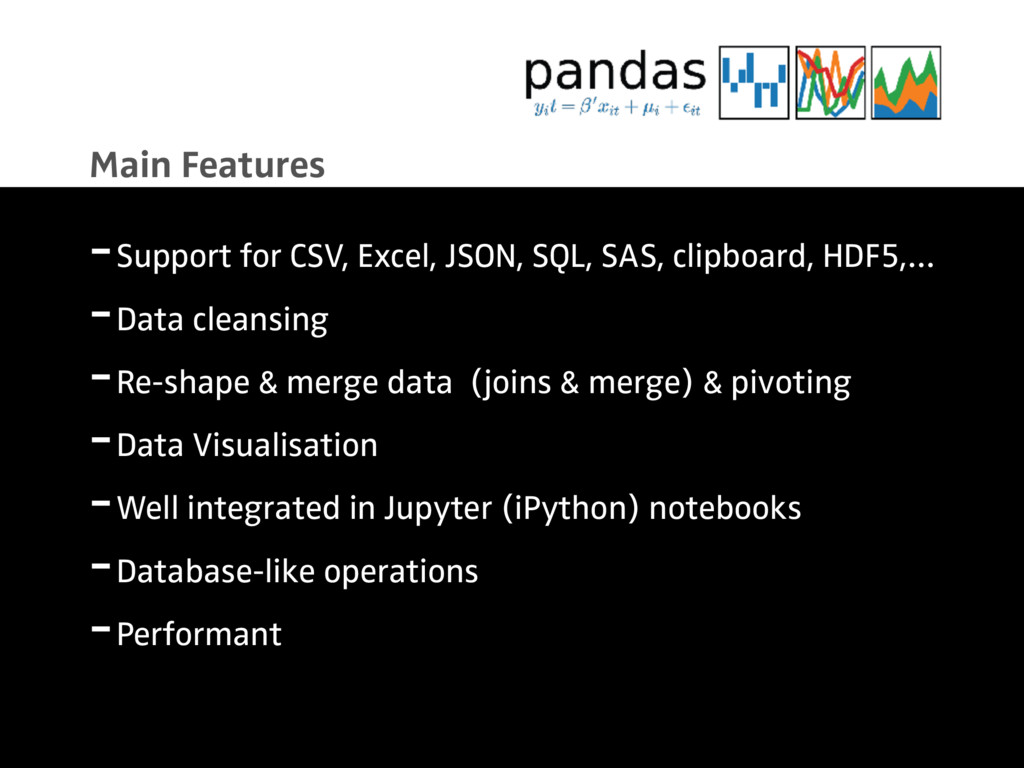
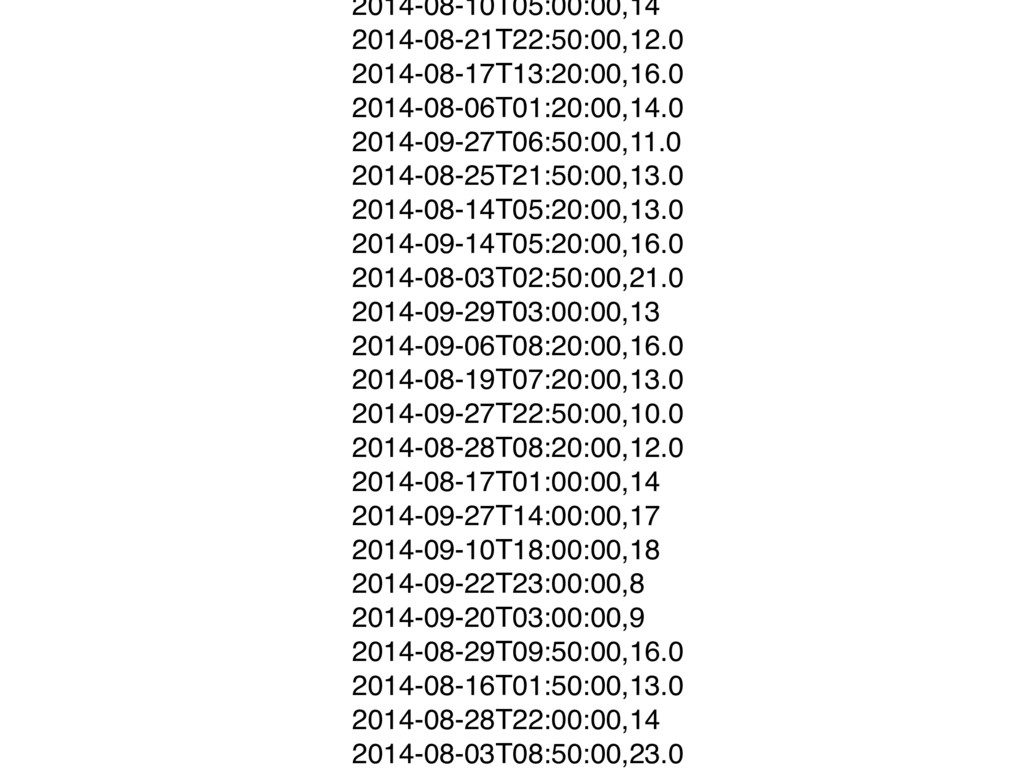
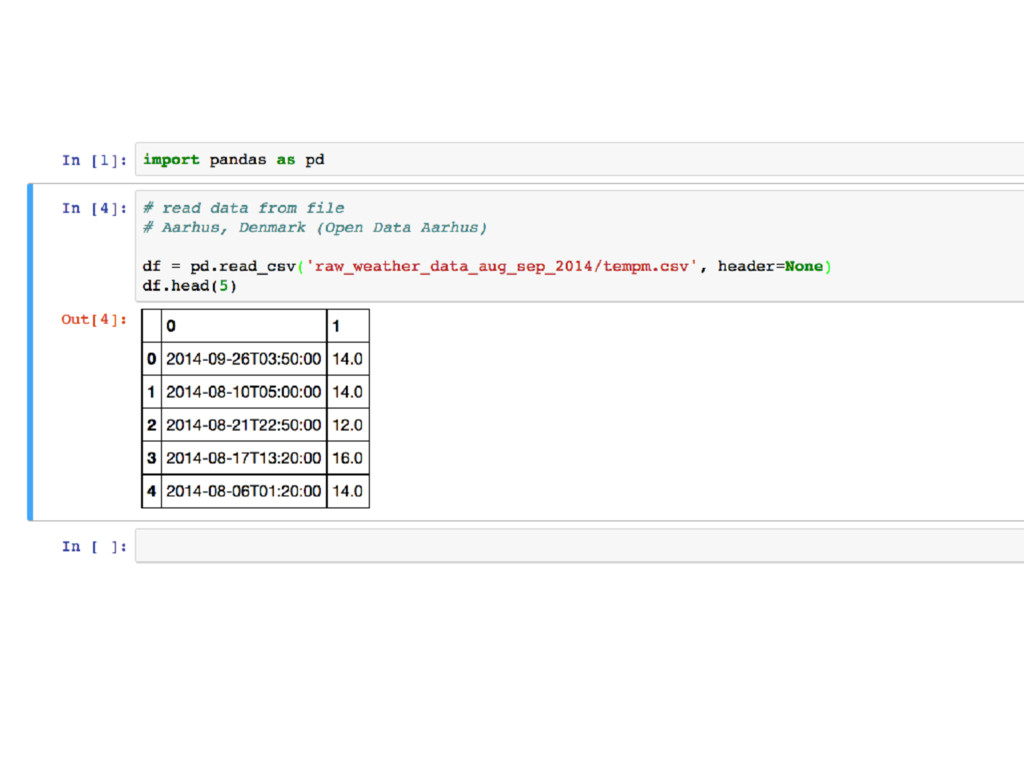
reading and writing data across multiple formats (CSV, Excel, JSON, SQL, HTML,…)
statistical data analysis and aggregation.
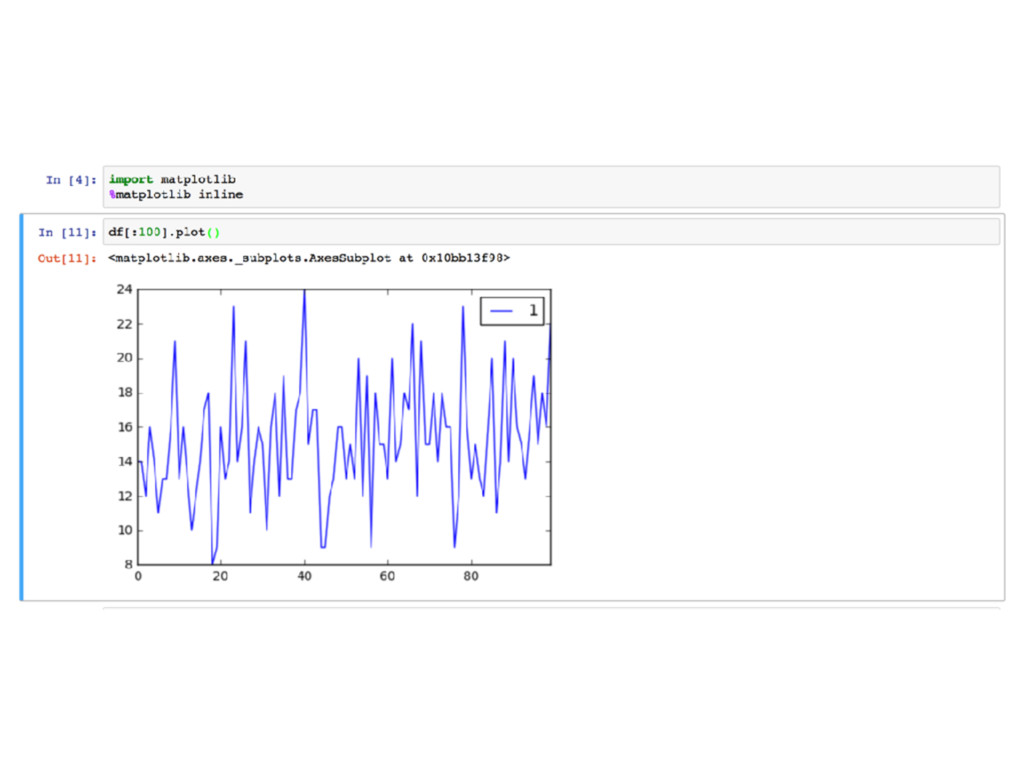
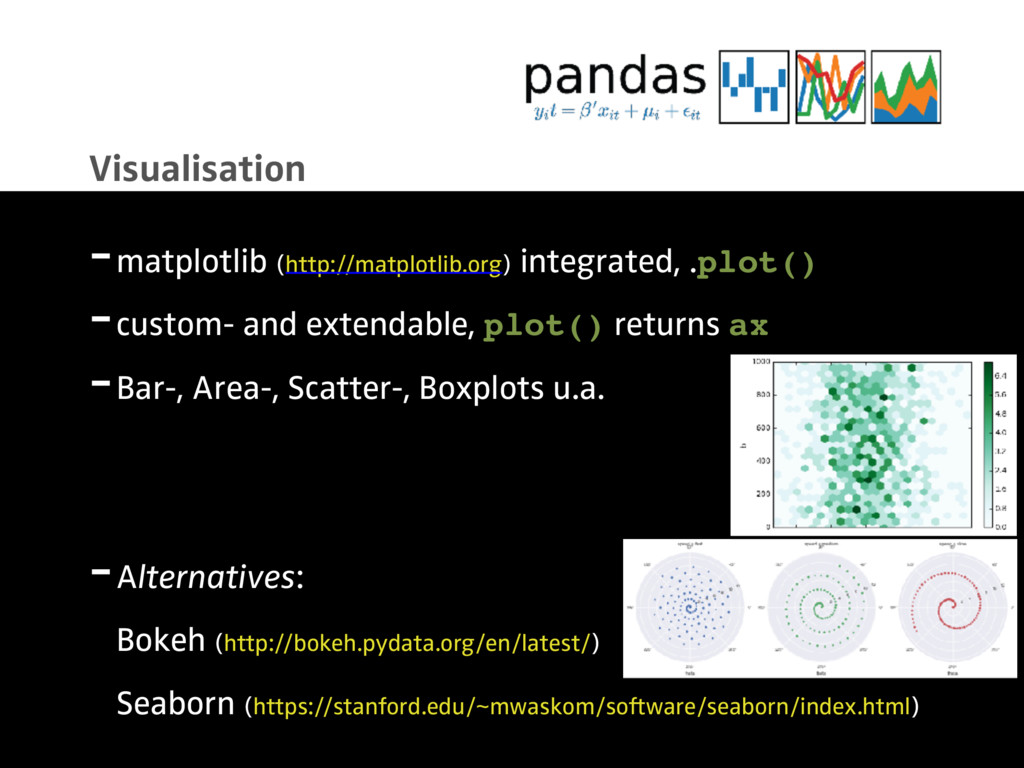
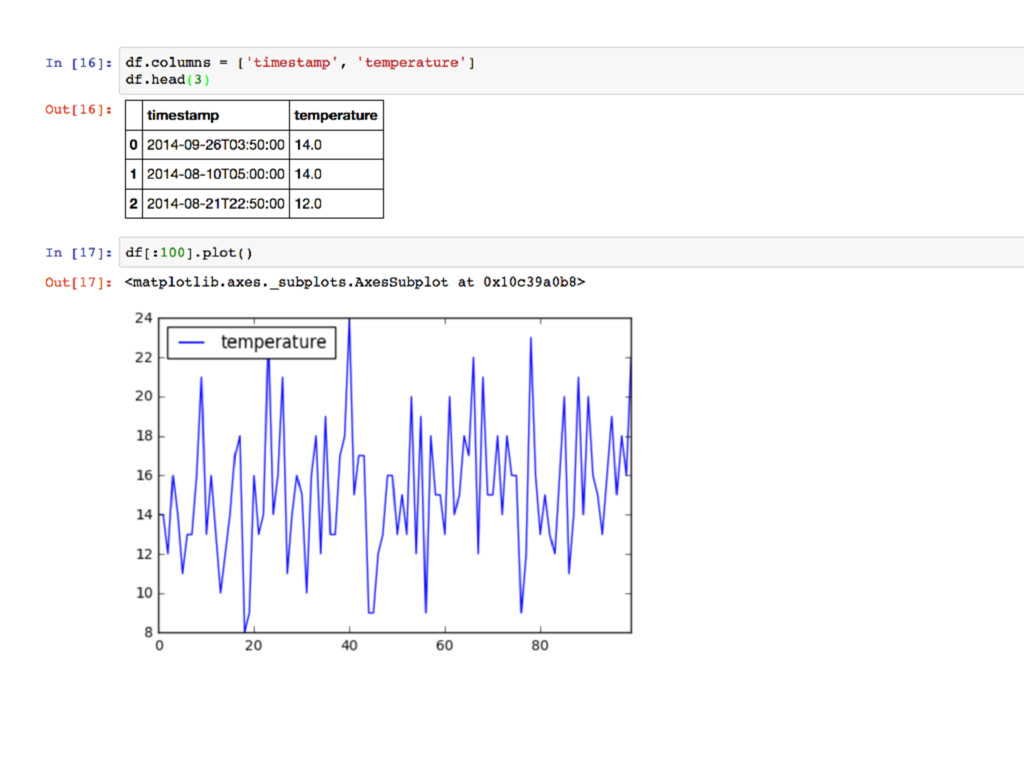
work with built-in data visualisation
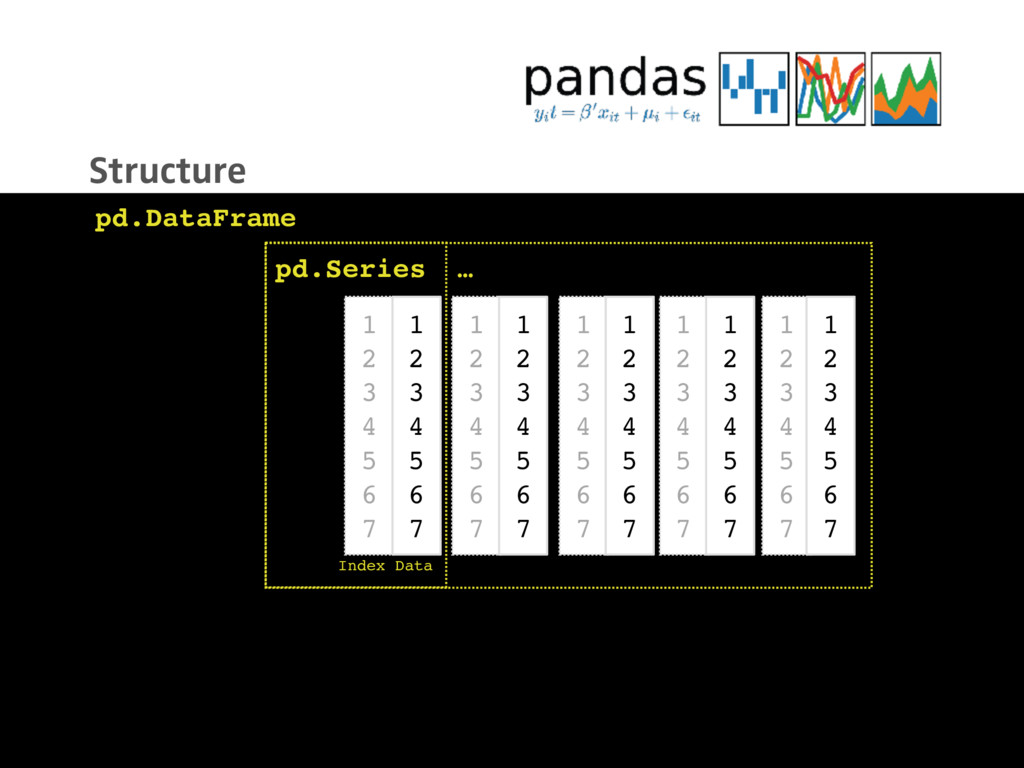
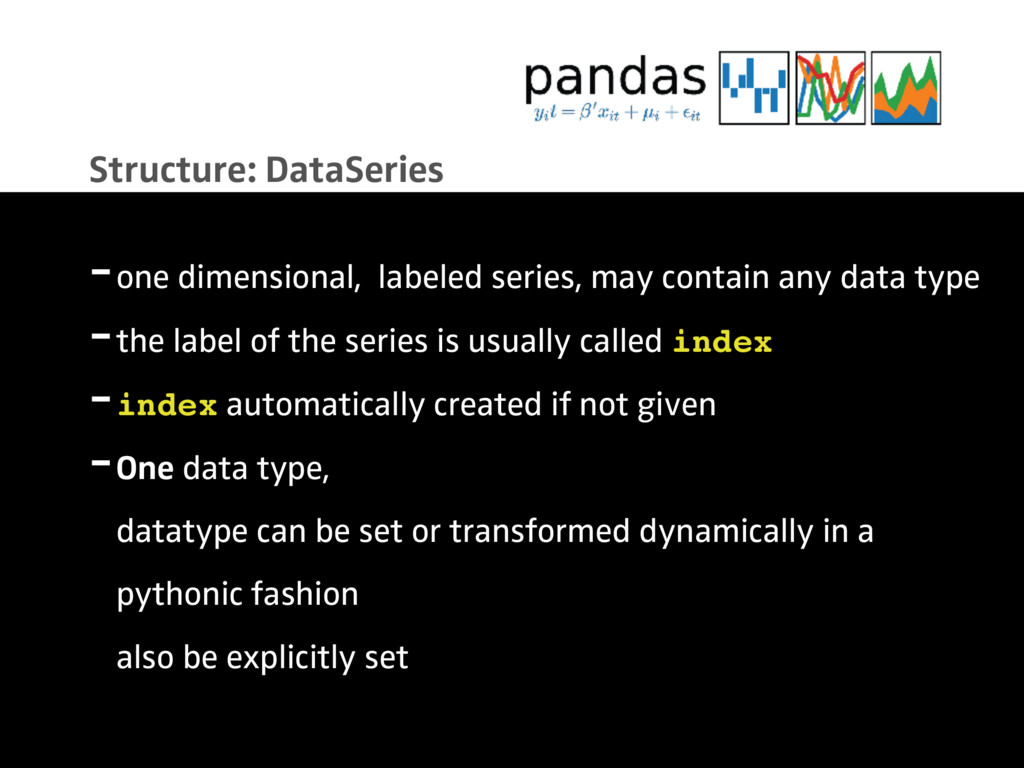
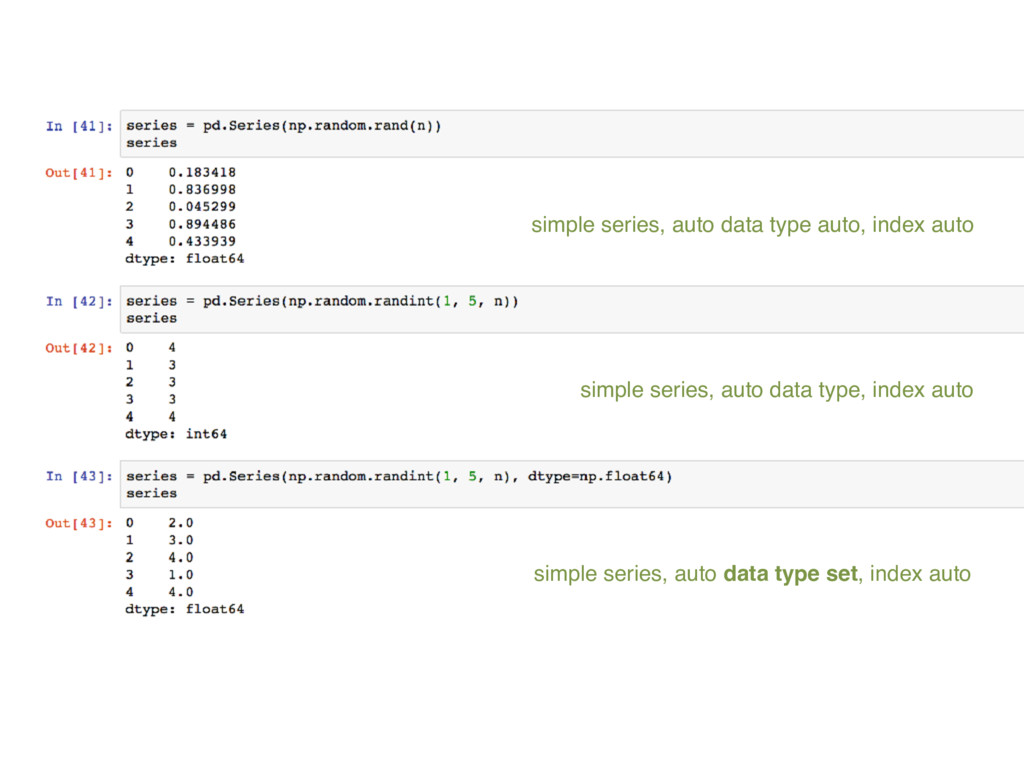
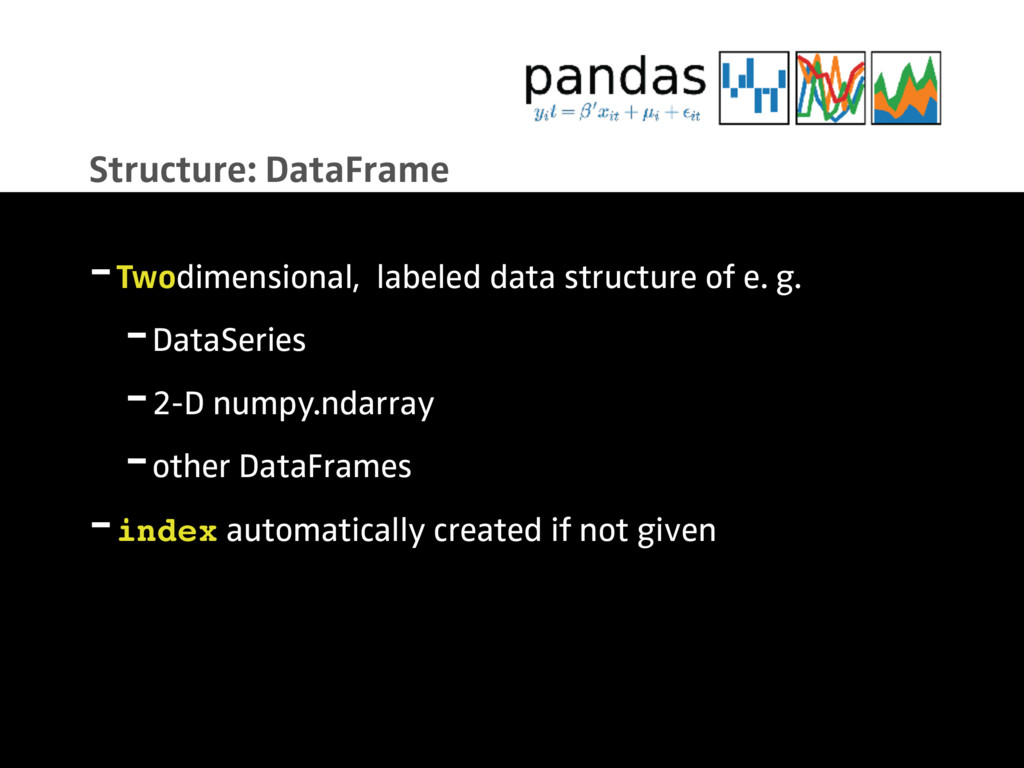
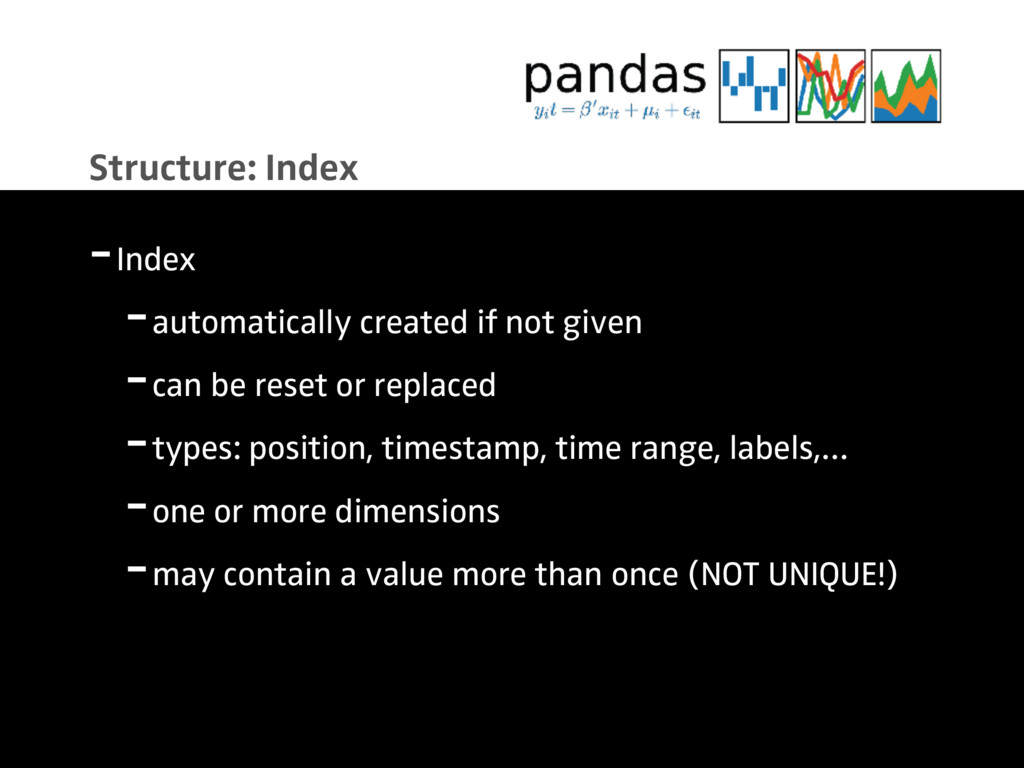
inner-mechanics of Pandas: Data-Frames, Data-Series & Numpy.
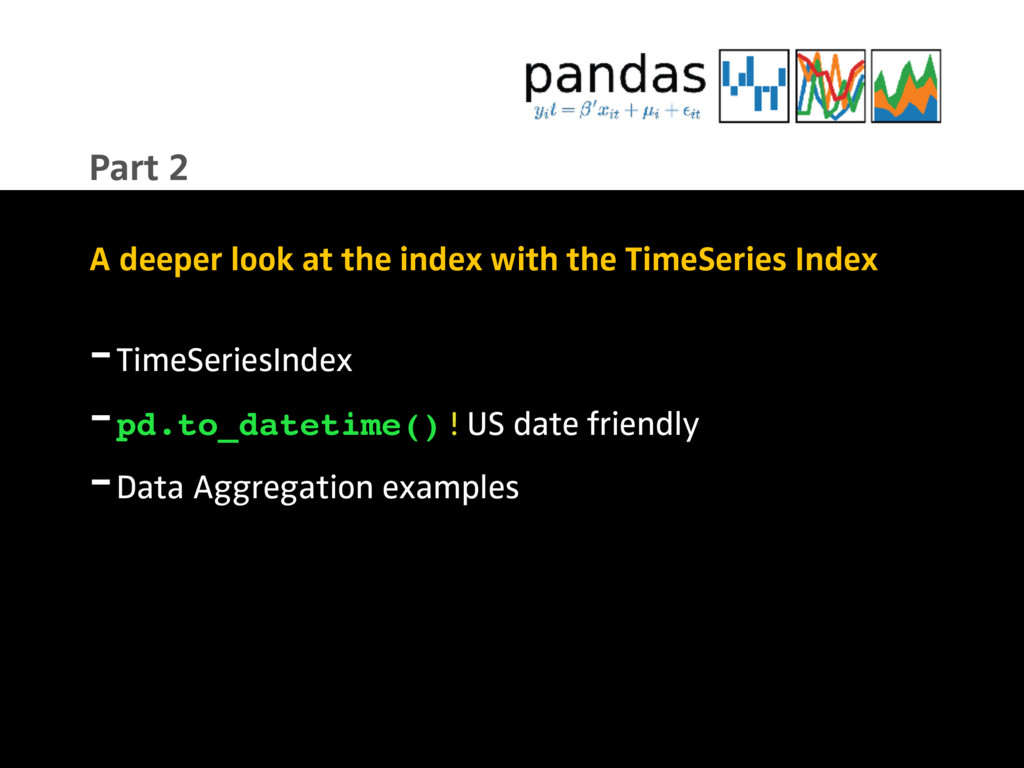
part two (~20") Time Series Analysis
how to analyse periodical data with pandas
how to mangle, reshape and pivot
caveats when working with timed data
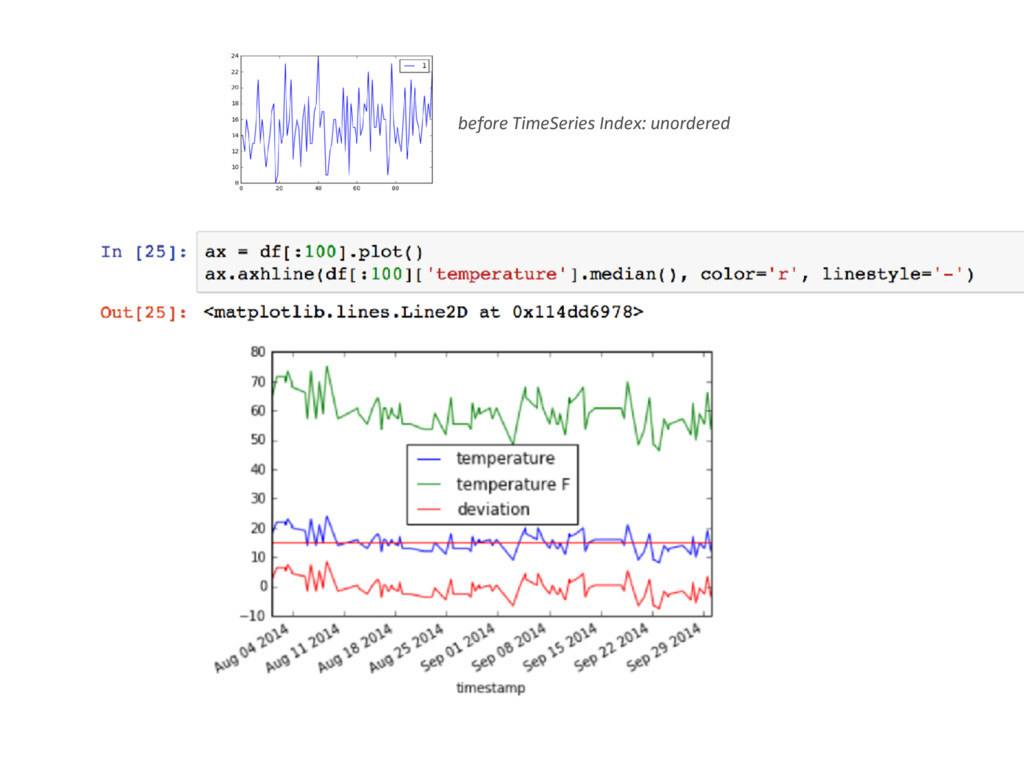
visualize your data on the fly
bonus (if we have time left)
gain insights with statsmodels (e.g. seasonality)
![ax = df[:100].plot() ax.axhline(16, color='r', linestyle='-') df.plot(kind='bar')](https://files.speakerdeck.com/presentations/6bc9c8619d09445480a76f238b964537/slide_9.jpg)
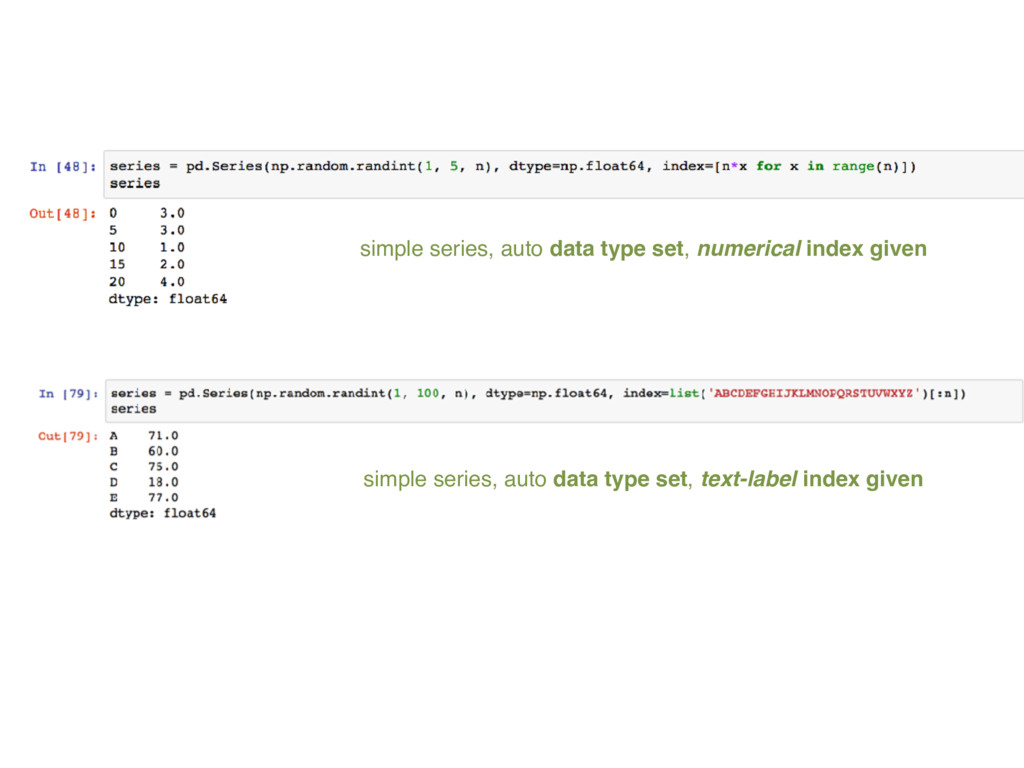
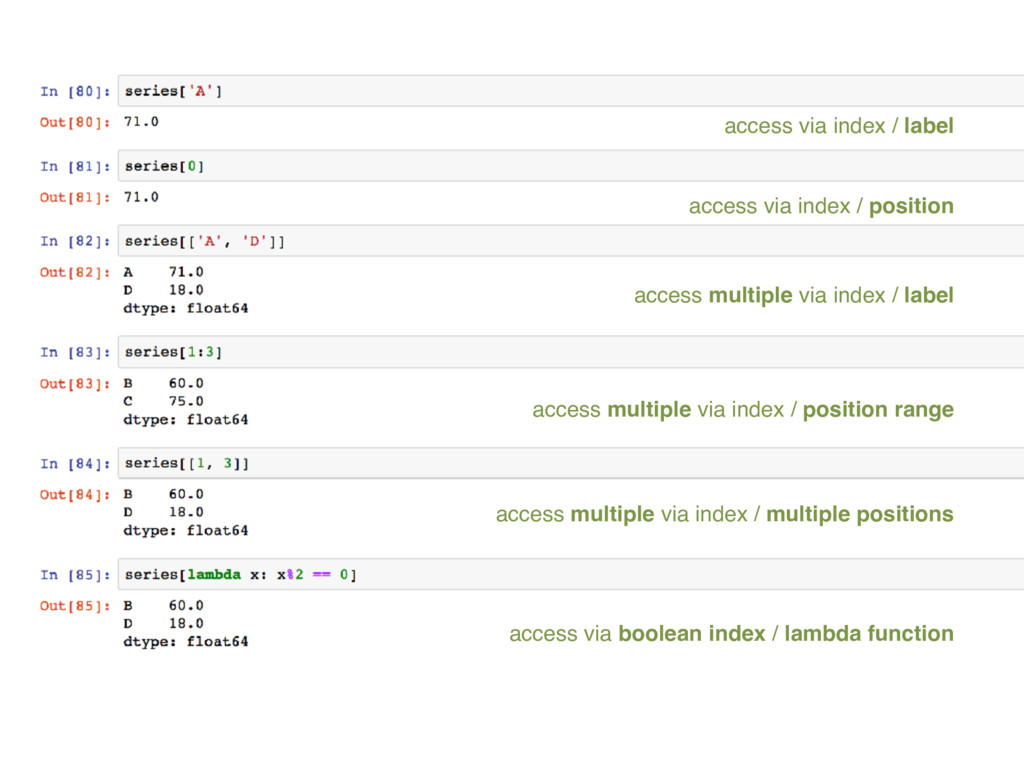
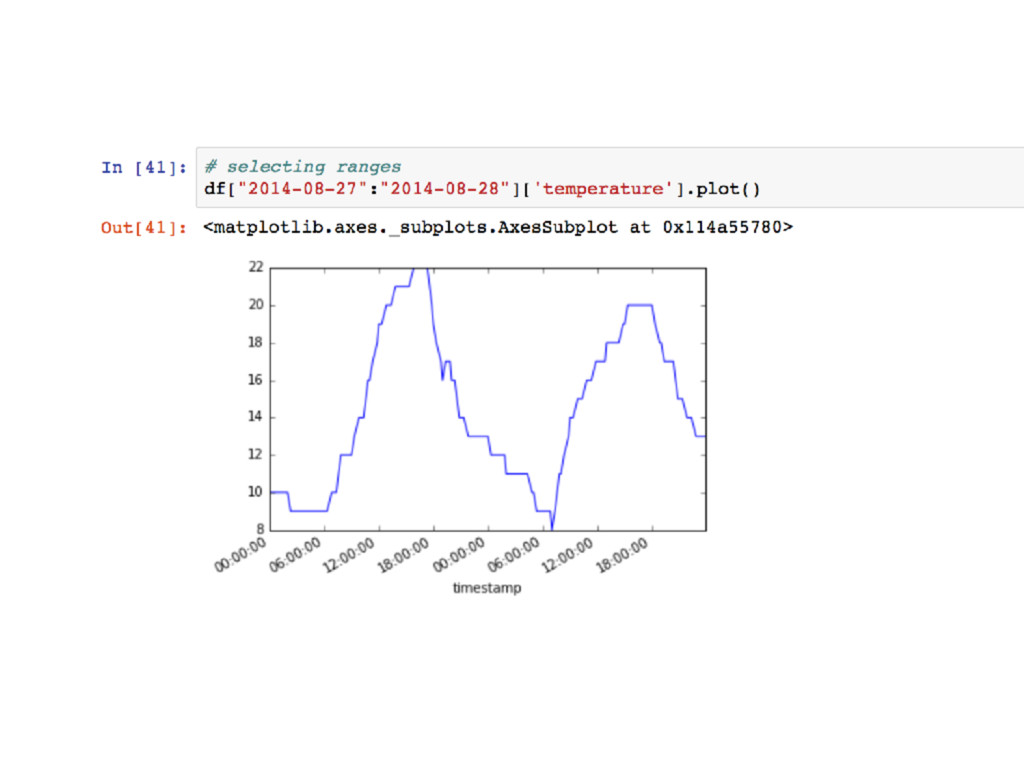
![Selecting Data -Slicing -Boolean indexing series[x], series[[x, y]] series[2], series[[2,](https://files.speakerdeck.com/presentations/6bc9c8619d09445480a76f238b964537/slide_18.jpg)
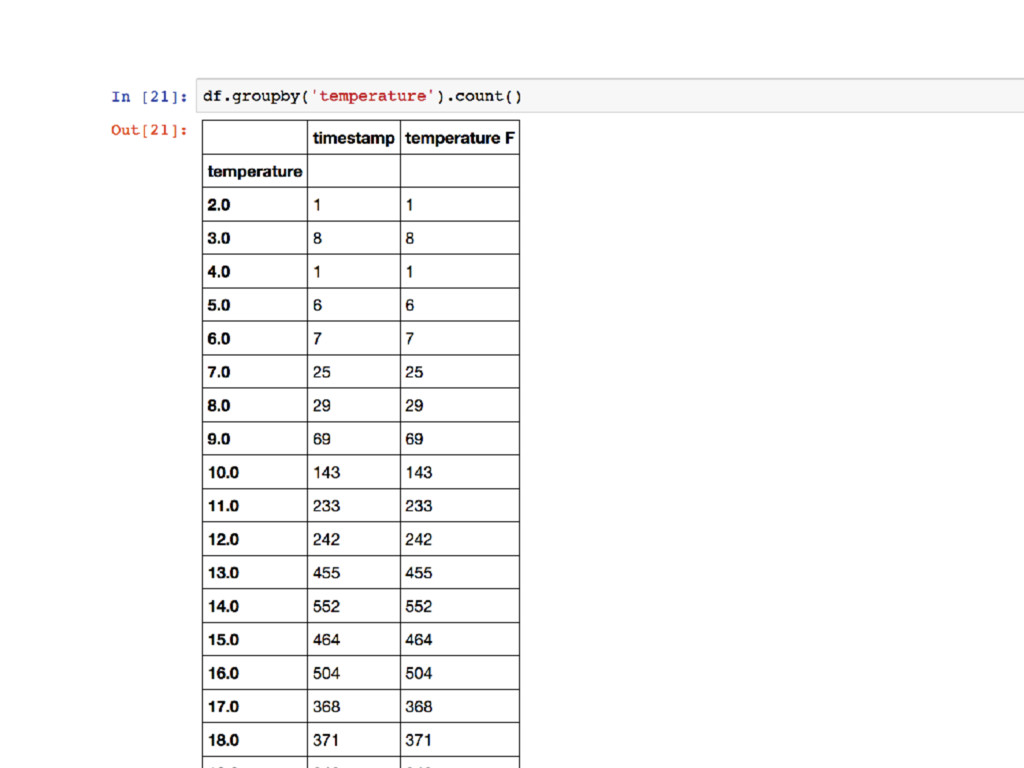
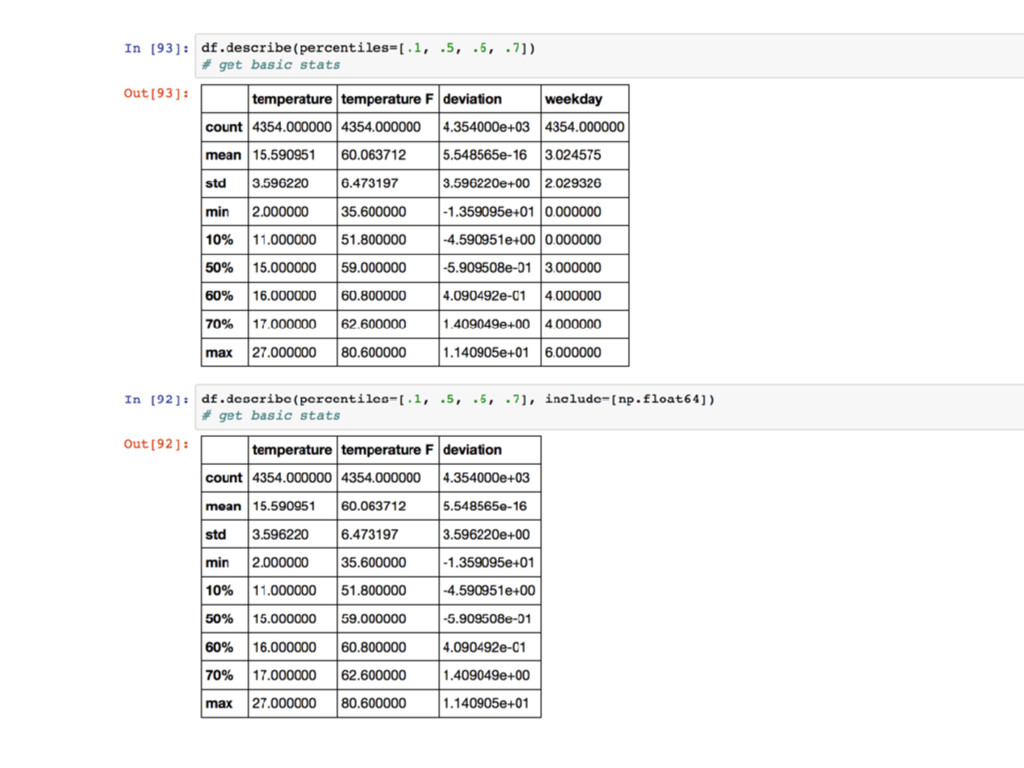
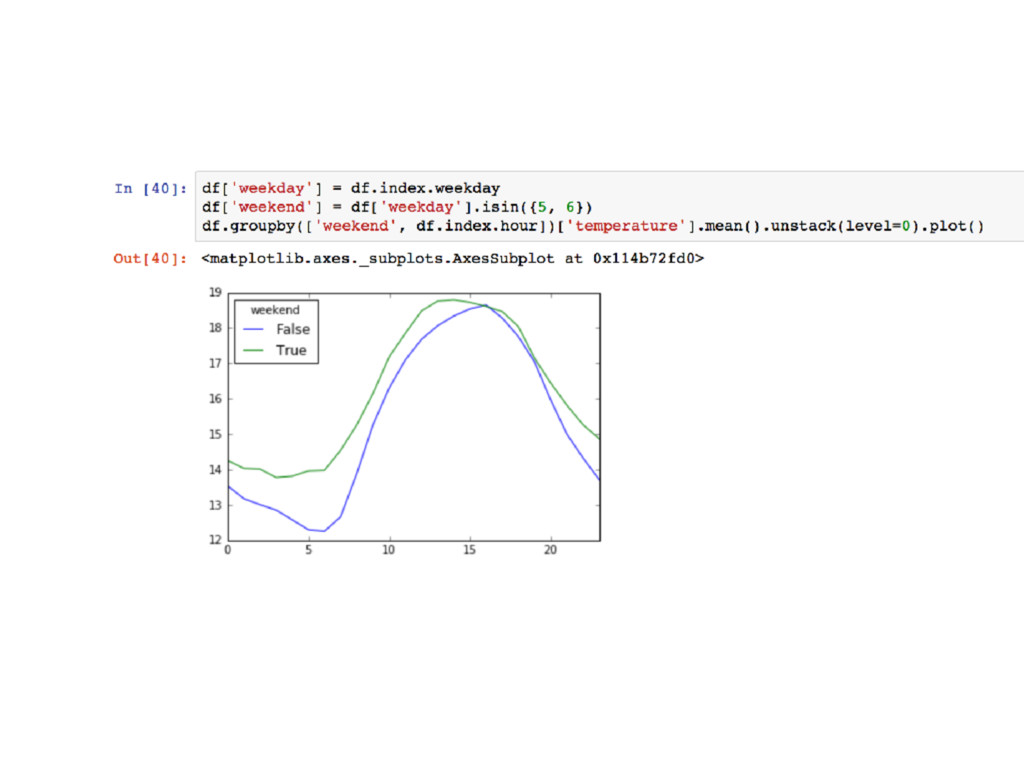
![Data Aggregation -describe() -groupby() -groupby([]) & unstack() -mean(), sum(), median(),…](https://files.speakerdeck.com/presentations/6bc9c8619d09445480a76f238b964537/slide_32.jpg)
![Alexander C. S. Hendorf [email protected] @hendorf Code-Examples https://github.com/Koenigsweg/data-timeseries-analysis- with-pandas](https://files.speakerdeck.com/presentations/6bc9c8619d09445480a76f238b964537/slide_61.jpg)