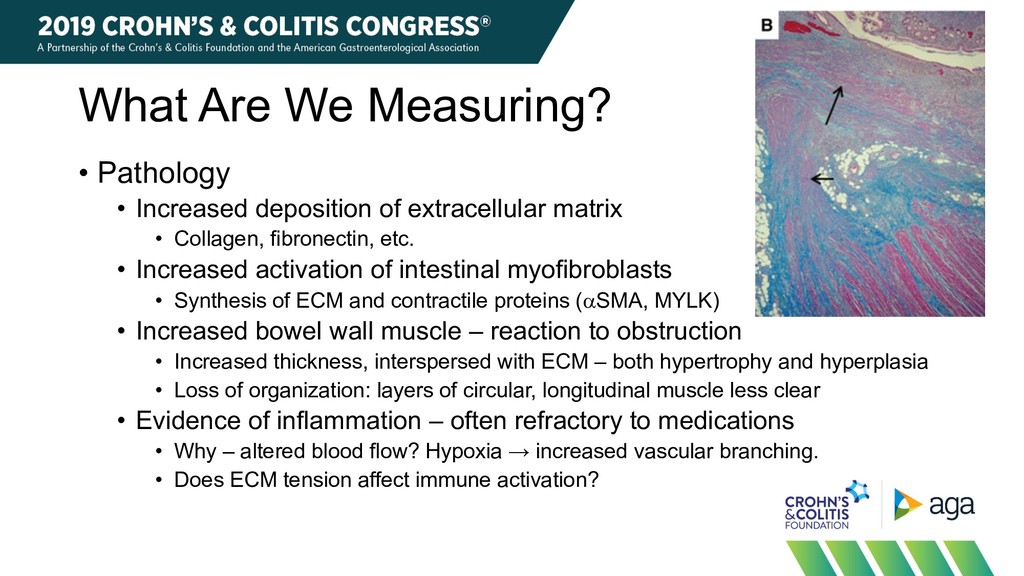
extracellular matrix • Collagen, fibronectin, etc. • Increased activation of intestinal myofibroblasts • Synthesis of ECM and contractile proteins (aSMA, MYLK) • Increased bowel wall muscle – reaction to obstruction • Increased thickness, interspersed with ECM – both hypertrophy and hyperplasia • Loss of organization: layers of circular, longitudinal muscle less clear • Evidence of inflammation – often refractory to medications • Why – altered blood flow? Hypoxia → increased vascular branching. • Does ECM tension affect immune activation?
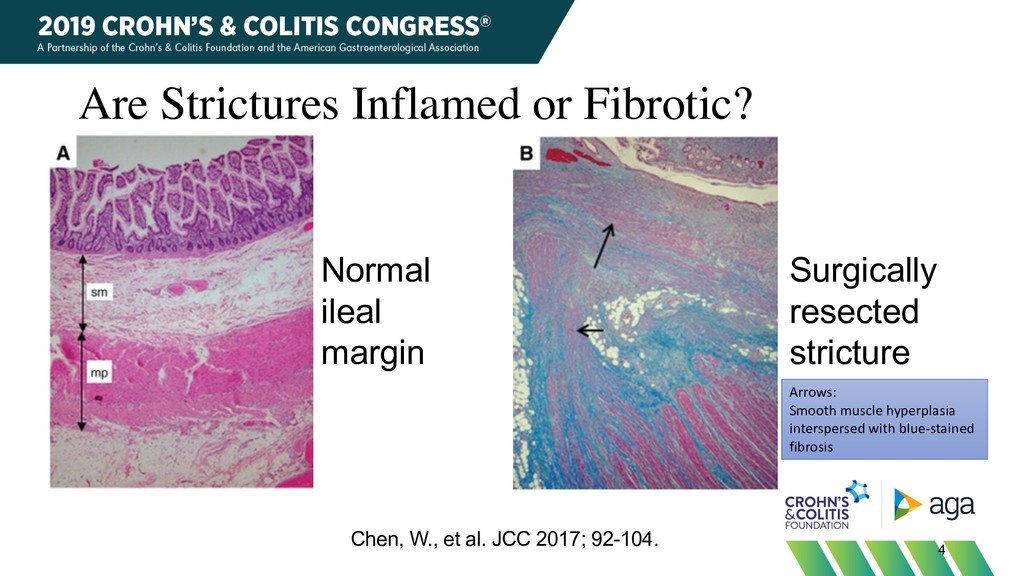
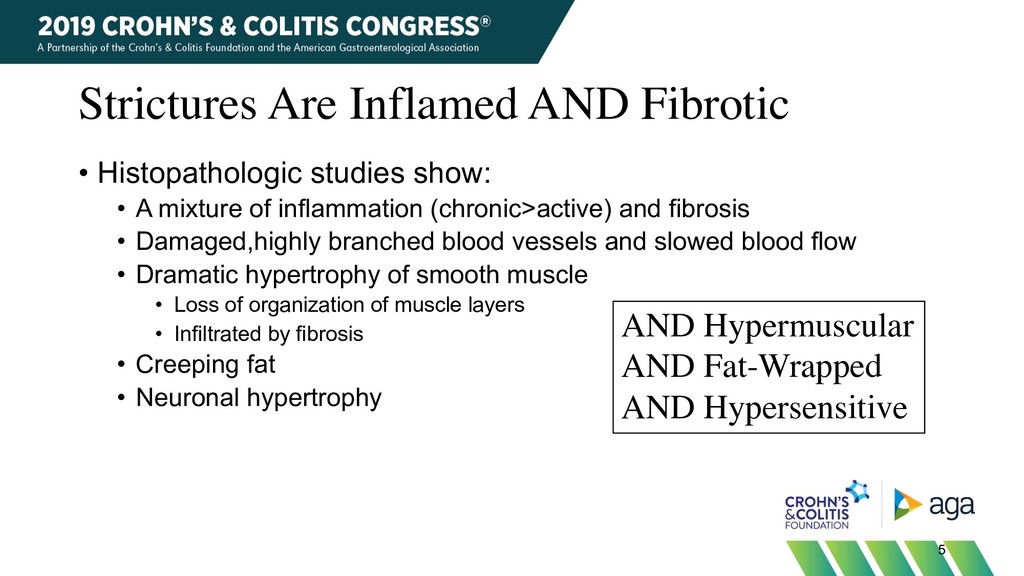
A mixture of inflammation (chronic>active) and fibrosis • Damaged,highly branched blood vessels and slowed blood flow • Dramatic hypertrophy of smooth muscle • Loss of organization of muscle layers • Infiltrated by fibrosis • Creeping fat • Neuronal hypertrophy 5 AND Hypermuscular AND Fat-Wrapped AND Hypersensitive
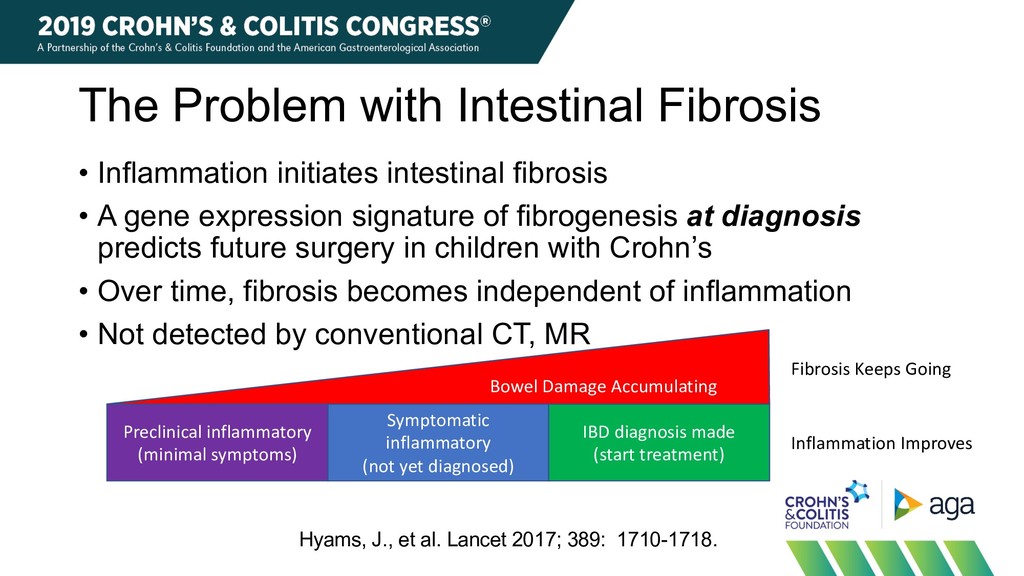
• A gene expression signature of fibrogenesis at diagnosis predicts future surgery in children with Crohn’s • Over time, fibrosis becomes independent of inflammation • Not detected by conventional CT, MR Preclinical inflammatory (minimal symptoms) Symptomatic inflammatory (not yet diagnosed) IBD diagnosis made (start treatment) Bowel Damage Accumulating Inflammation Improves Fibrosis Keeps Going Hyams, J., et al. Lancet 2017; 389: 1710-1718.
identify progression of bowel damage over time. • To determine which patients are unlikely to respond to medical anti-inflammatory therapy and need mechanical therapy. • Endoscopic balloon dilation • Surgery • To determine if medical anti-fibrotic therapies are effective. • Presumes that we can identify and develop effective therapies.
each site • Widely available, low operator-dependence • Can detect/differentiate several levels of progression of fibrosis • None, mild, moderate, severe • Easily integrated into clinical workflow • Low cost • Low invasiveness • Low radiation/toxicity to patient • Accepted by FDA/EMA as a surrogate endpoint
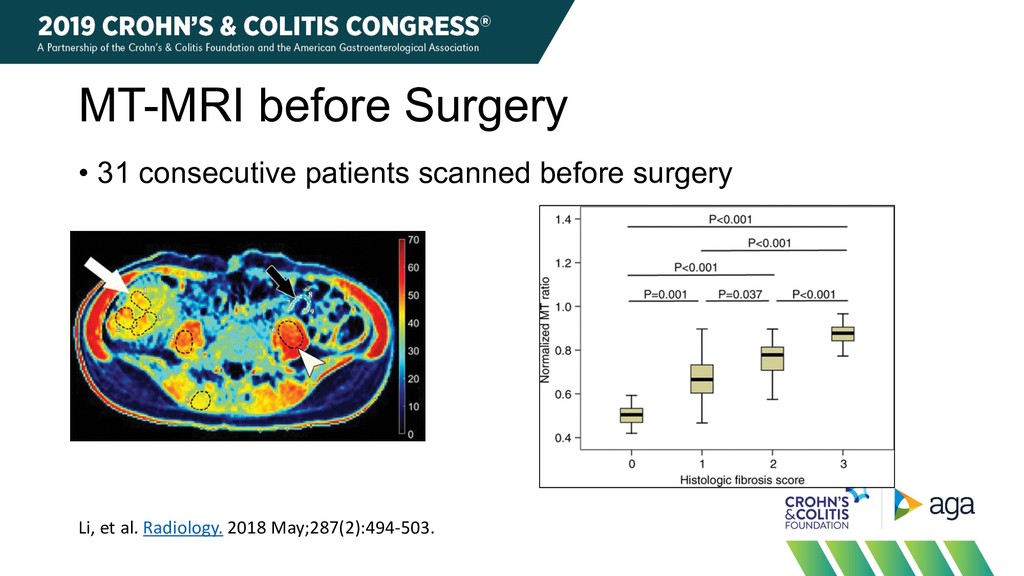
protons in large macromolecules, such as collagen and myosin (quantified using MT ratio [MTR]) • Signal from both fibrosis and accumulated muscle in the bowel wall. Dillman, JR, et al. JMRI 2015;42:801-10.
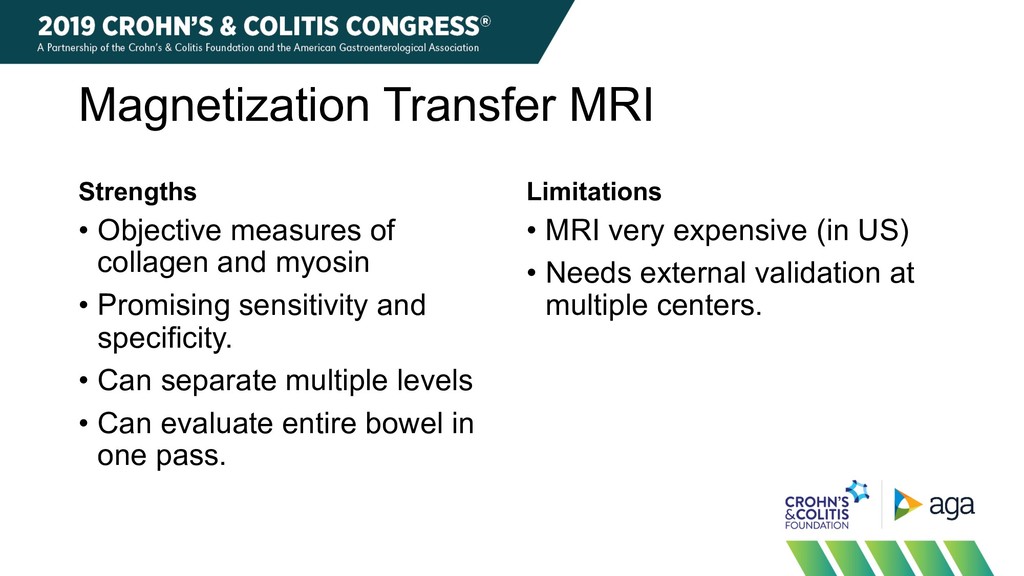
myosin • Promising sensitivity and specificity. • Can separate multiple levels • Can evaluate entire bowel in one pass. Limitations • MRI very expensive (in US) • Needs external validation at multiple centers.
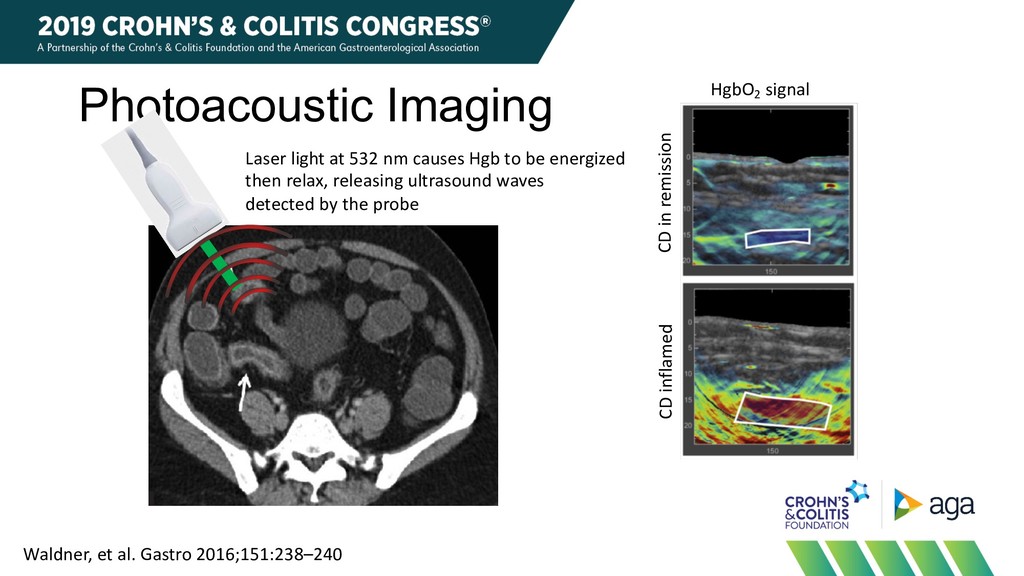
be energized then relax, releasing ultrasound waves detected by the probe CD in remission CD inflamed Waldner, et al. Gastro 2016;151:238–240 HgbO2 signal
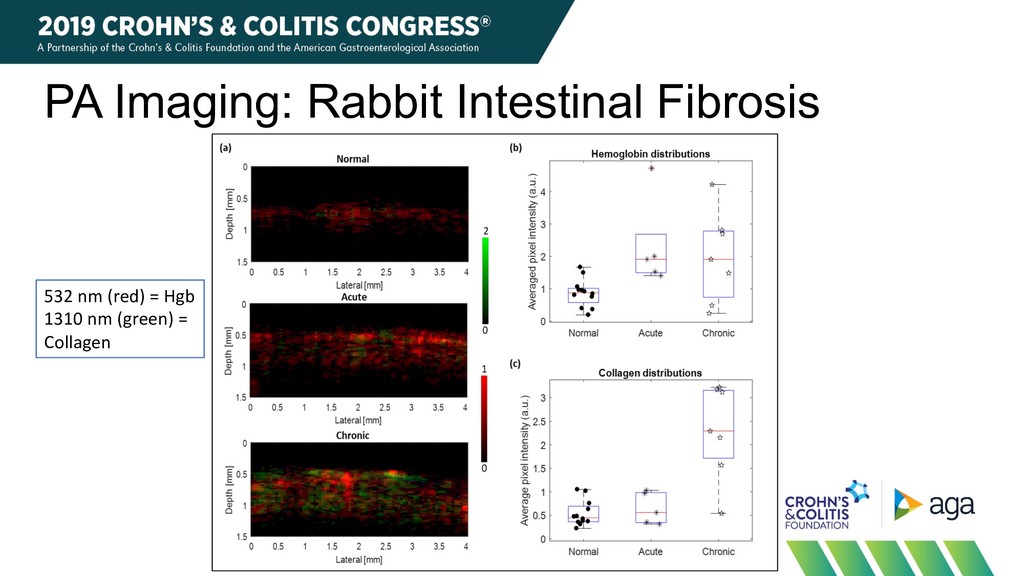
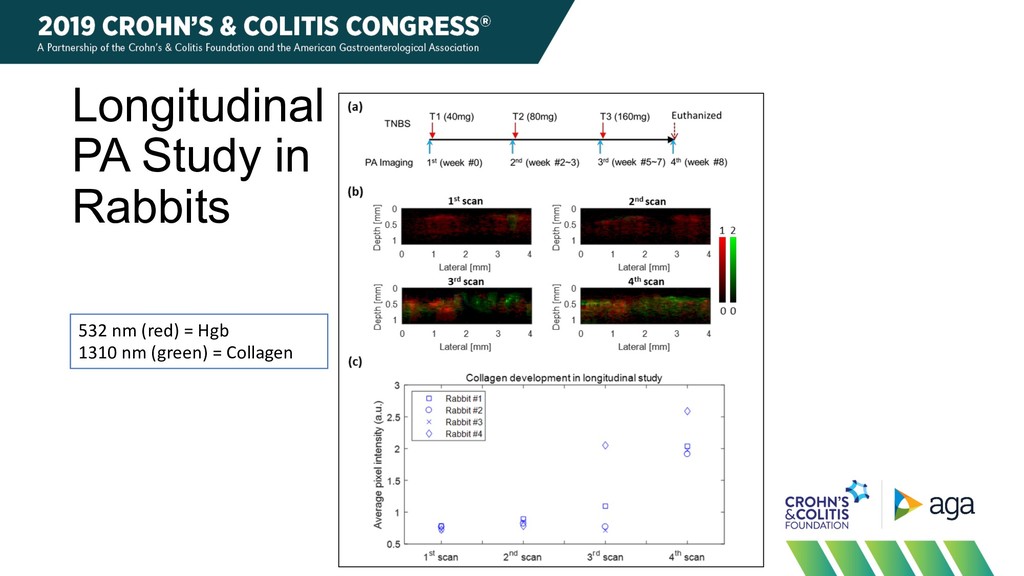
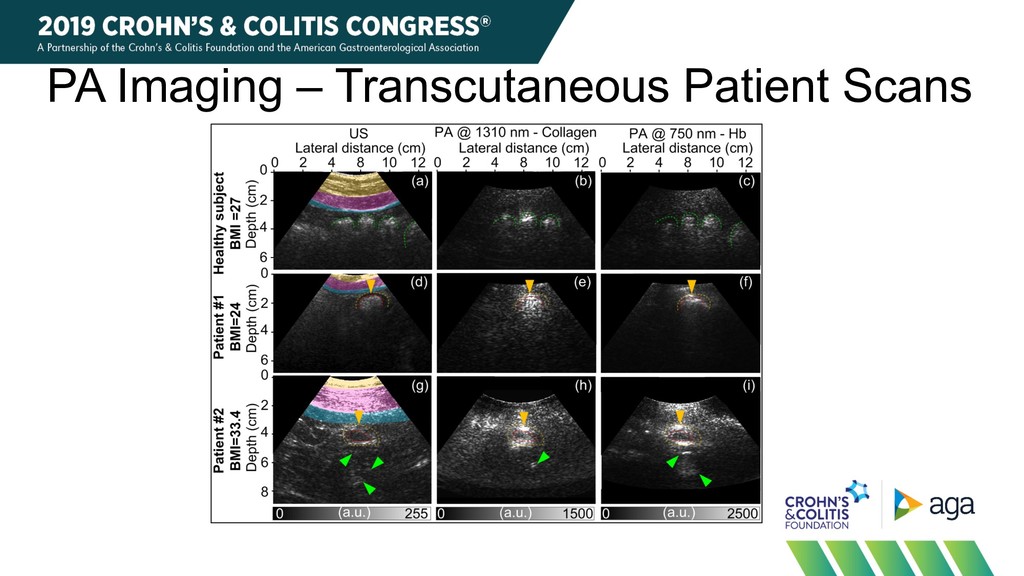
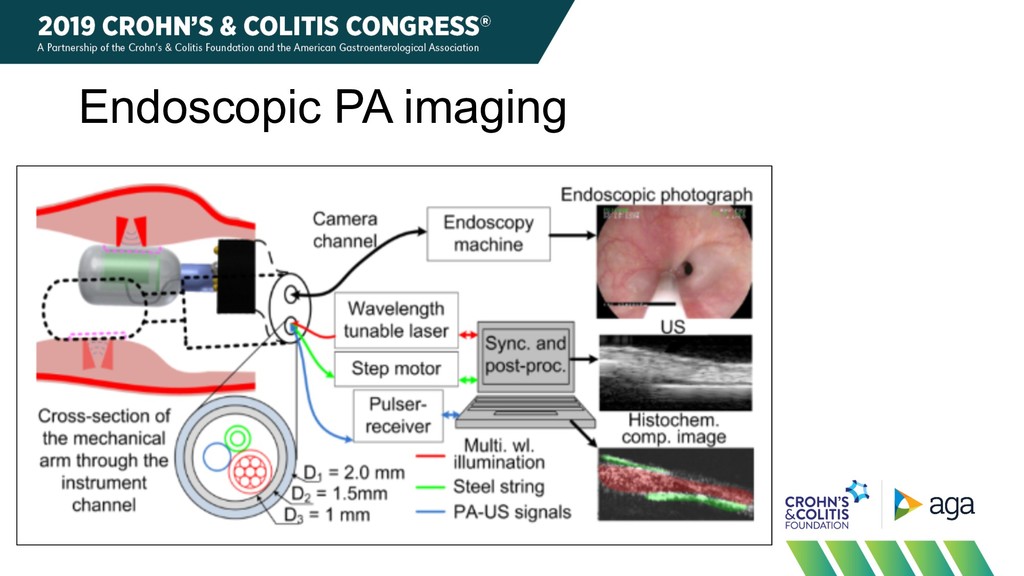
• Detects longitudinal change in rabbit model • Transcutaneous PA imaging is feasible in humans Limitations • Transcutaneous PA imaging limited to BMI < 35 • Endoscopic probe requires invasive scope • Needs external validation • For focal lesions, impractical for entire bowel
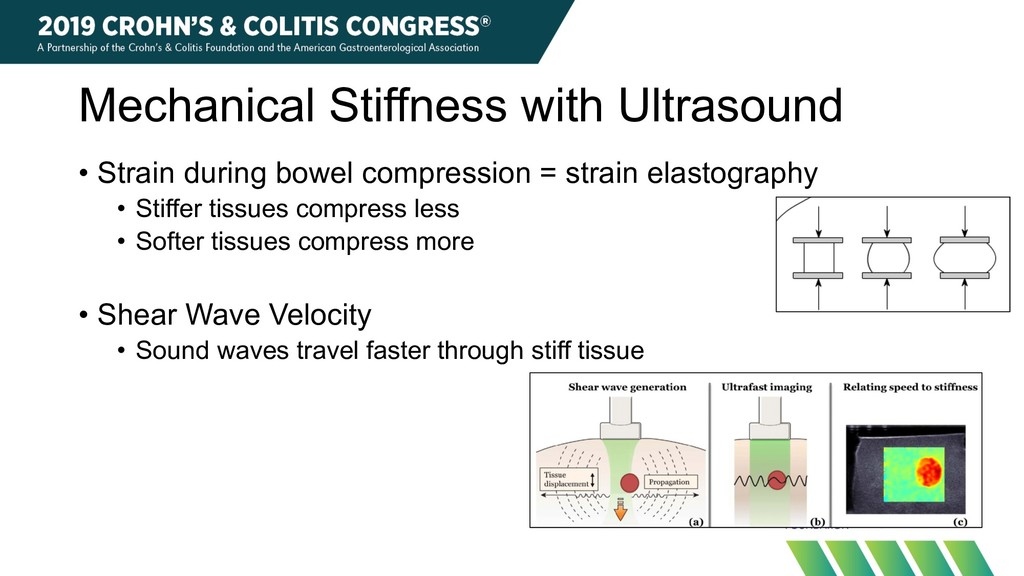
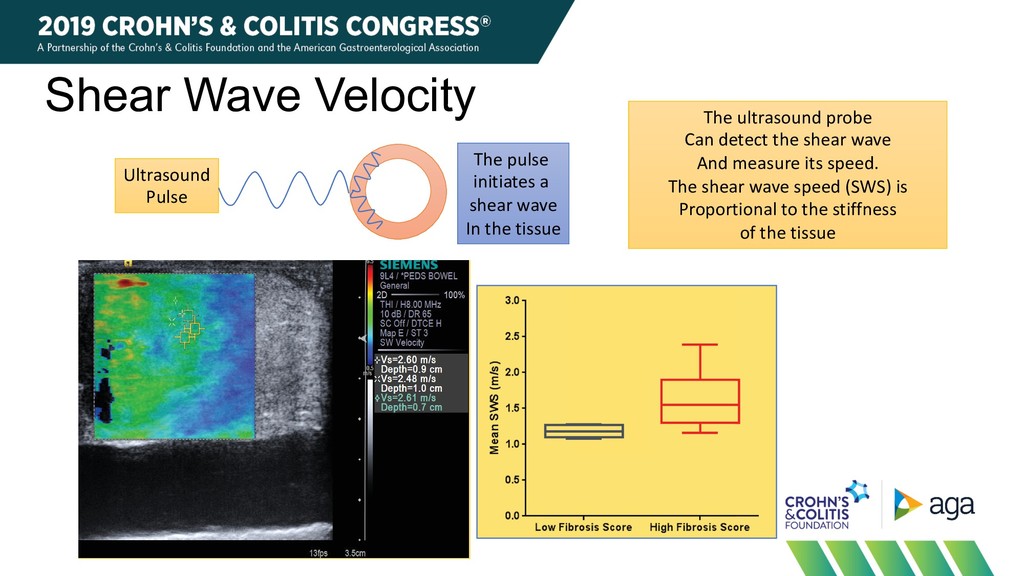
Johnson2, Jonathan M. Rubin1, Peter D. R. Higgins2 Internal Medicine, 3Pathology, Ann Arbor, Michigan, USA FIGURE 3 Mean SWS measurements. Box plots comparing mean SWS measurements for low (0-2) vs. high (3) fi brosis score bowel segments obtained using VTQ shear wave elastography method. Whiskers represent minimum and maximum SWS measurements. *** p <0.001. S (non-fi brotic). Q shear wave elastography of a 20 cting CD. (A) VTQ shear wave elastography 0.91 [95%, 0.67-0.99; p<0.0001 method (area under the curve = 0 FIGURE 5 Relationship between VTQ and VT-IQ measurements. Scatter plot showing relationship Ultrasound Pulse The pulse initiates a shear wave In the tissue The ultrasound probe Can detect the shear wave And measure its speed. The shear wave speed (SWS) is Proportional to the stiffness of the tissue
• Relatively easy to do longitudinally Limitations • Challenging at higher BMI • Concerns about operator dependence, applied pressure • Variation in stricture • How many ROIs needed to measure reliably in one slice? • How many points along the length of a stricture? • For focal lesions, impractical for entire bowel
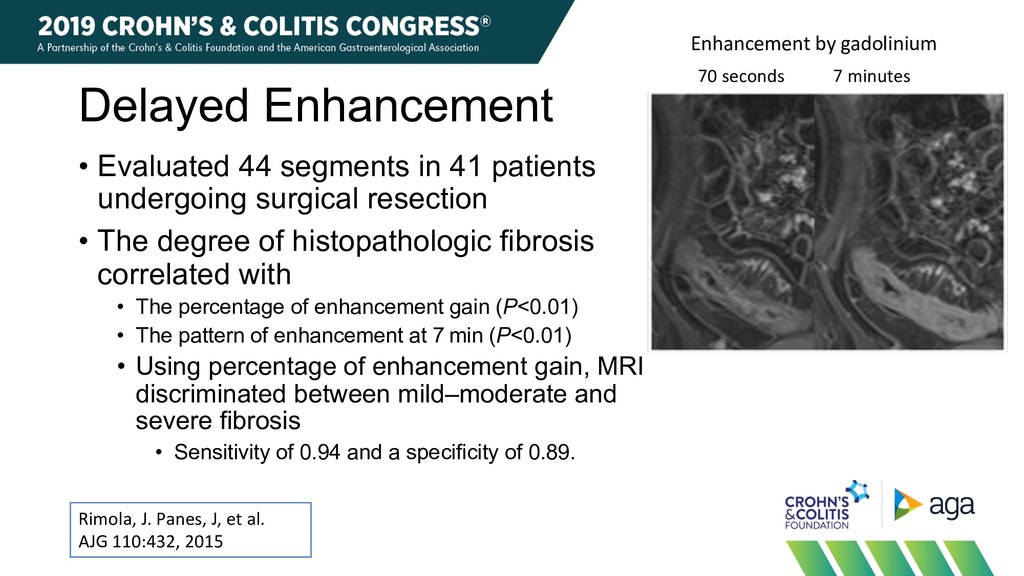
2015 Enhancement by gadolinium 70 seconds 7 minutes • Evaluated 44 segments in 41 patients undergoing surgical resection • The degree of histopathologic fibrosis correlated with • The percentage of enhancement gain (P<0.01) • The pattern of enhancement at 7 min (P<0.01) • Using percentage of enhancement gain, MRI discriminated between mild–moderate and severe fibrosis • Sensitivity of 0.94 and a specificity of 0.89.
in endoscopic remission in 73 segments • Despite endoscopic remission, persistent findings • Wall thickening in 23/72 segments with BWT at baseline • Strictures in 6/8 • Creeping fat in 7/10 • Intramural fat deposits in 20/24 • Despite resolution of inflammation, many lesions consistent with bowel damage persist on MRE Rimola, J. Panes, J, et al. APT 48:1232, 2018
not very helpful • Do not directly measure fibrosis • Can detect residual damage (fat, wall thickness, strictures) • Molecular imaging – MT-MRI, PA imaging promising • Mechanical properties – ultrasound promising for focal lesions, had good features for longitudinal monitoring • MR washout – can detect severe fibrosis • Could be useful for surgical decisions