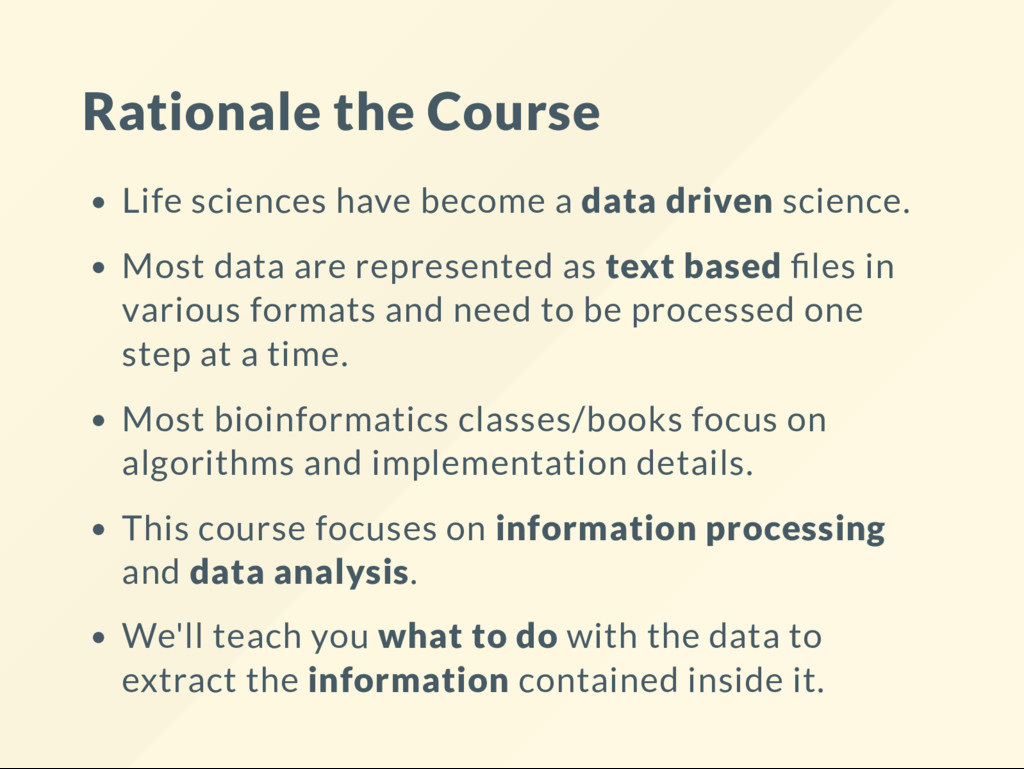
science. Most data are represented as text based les in various formats and need to be processed one step at a time. Most bioinformatics classes/books focus on algorithms and implementation details. This course focuses on information processing and data analysis. We'll teach you what to do with the data to extract the information contained inside it.
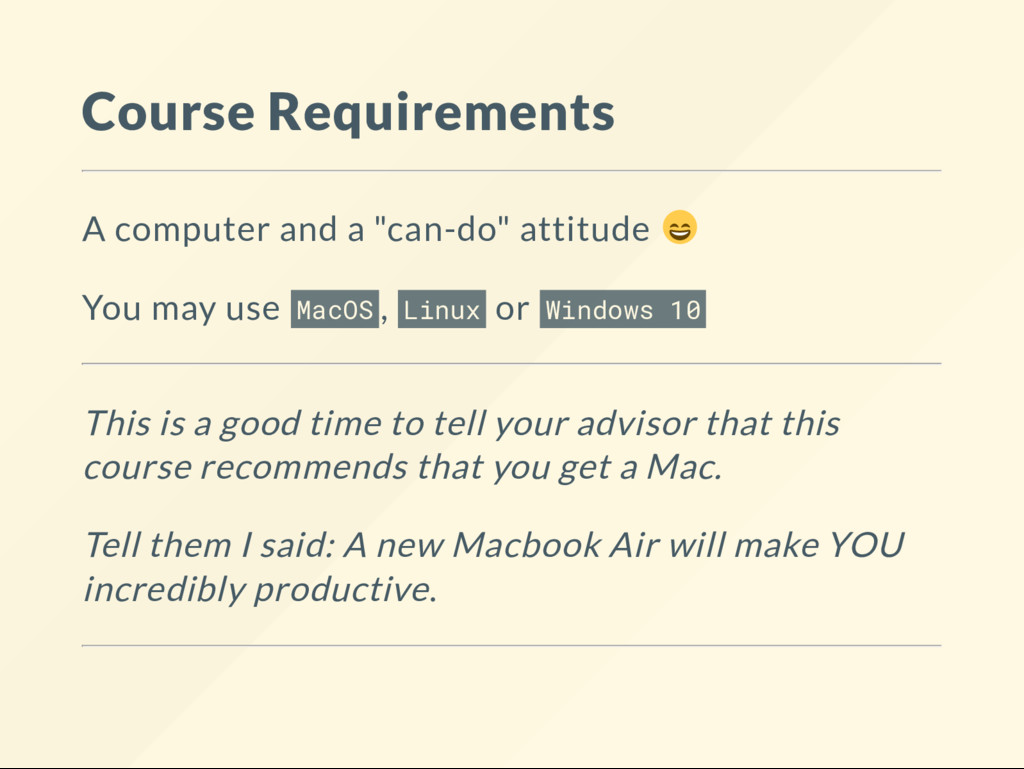
use MacOS , Linux or Windows 10 This is a good time to tell your advisor that this course recommends that you get a Mac. Tell them I guarantee that a new Macbook Pro will make YOU incredibly productive.
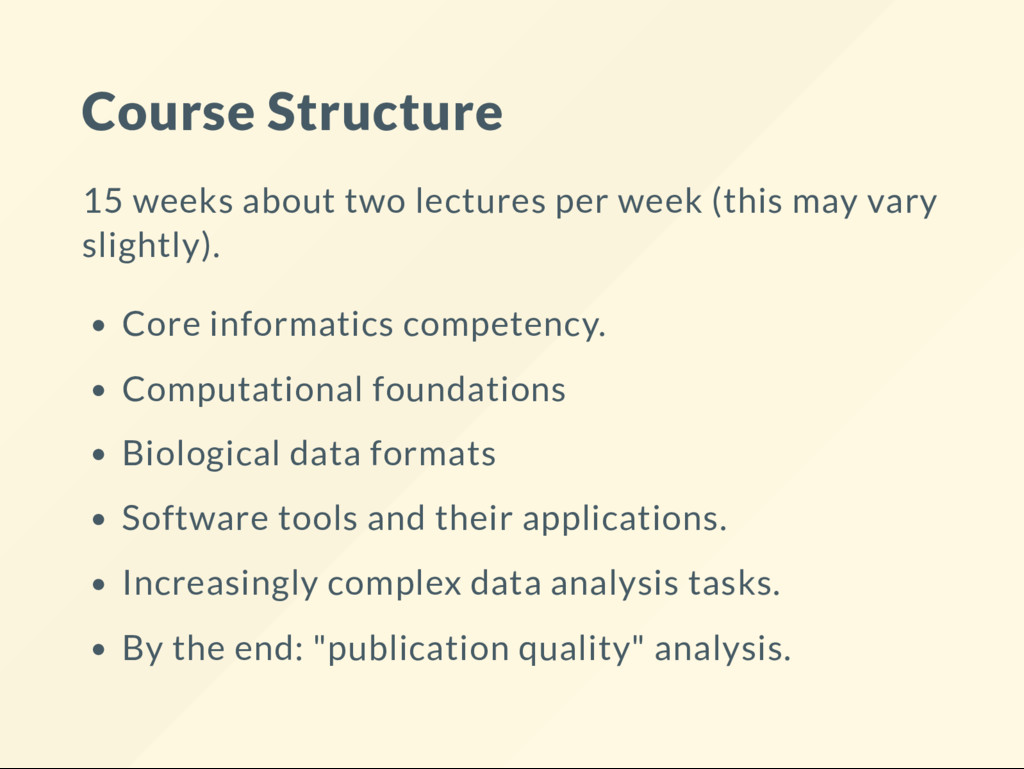
may vary slightly). Core informatics competency. Computational foundations Biological data formats Software tools and their applications. Increasingly complex data analysis tasks. By the end: "publication quality" analysis.
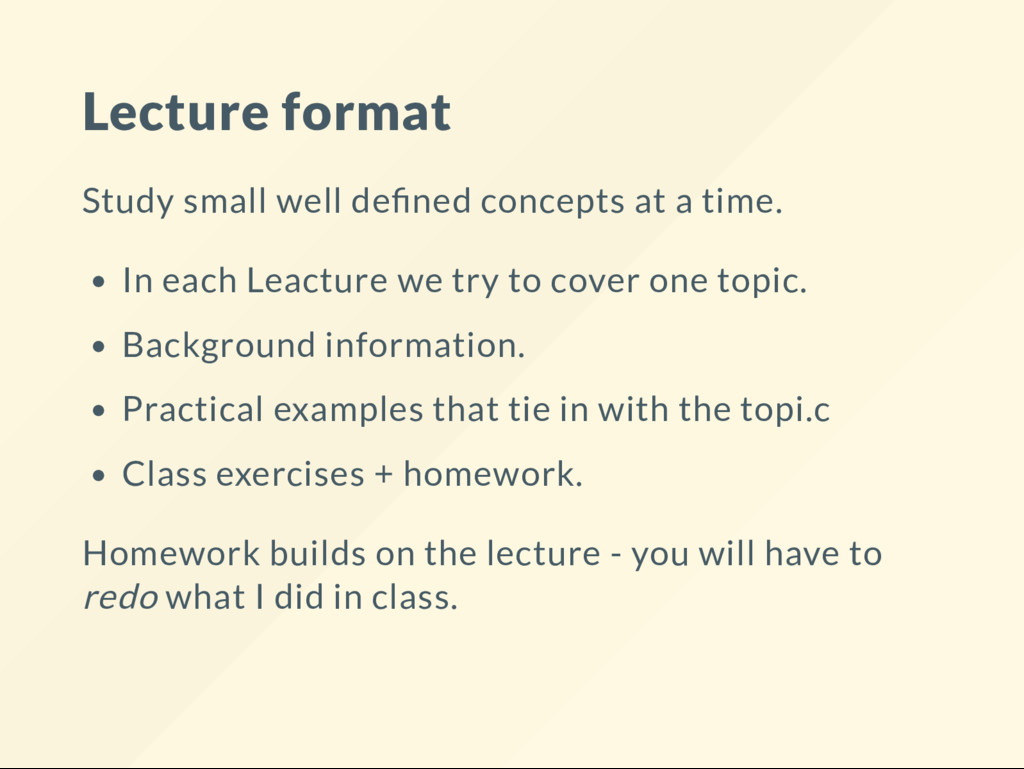
time. In each Leacture we try to cover one topic. Background information. Practical examples that tie in with the topi.c Class exercises + homework. Assignments build on the lecture - redo what I did in class.
number of very simple decisions. Most of which need to be correct! That's what makes it dif cult! The software is already written for you. How you choose to order the steps can make a lot of difference. There are no absolute rules, only guidelines. You must learn to improvise and adapt. That what this course is about: How to not be afraid of making decisions.
few hours on each lecture beyond what we show: Explore behaviors. Expand the scope of the study. Try new solutions, push the boundaries. Time ies when you know what you are doing.
this in a brief brain storming session What is a genome? Why do we want to study it? What can we explain via a genome? What can't be answered by studying a genome? What complications might we run into?
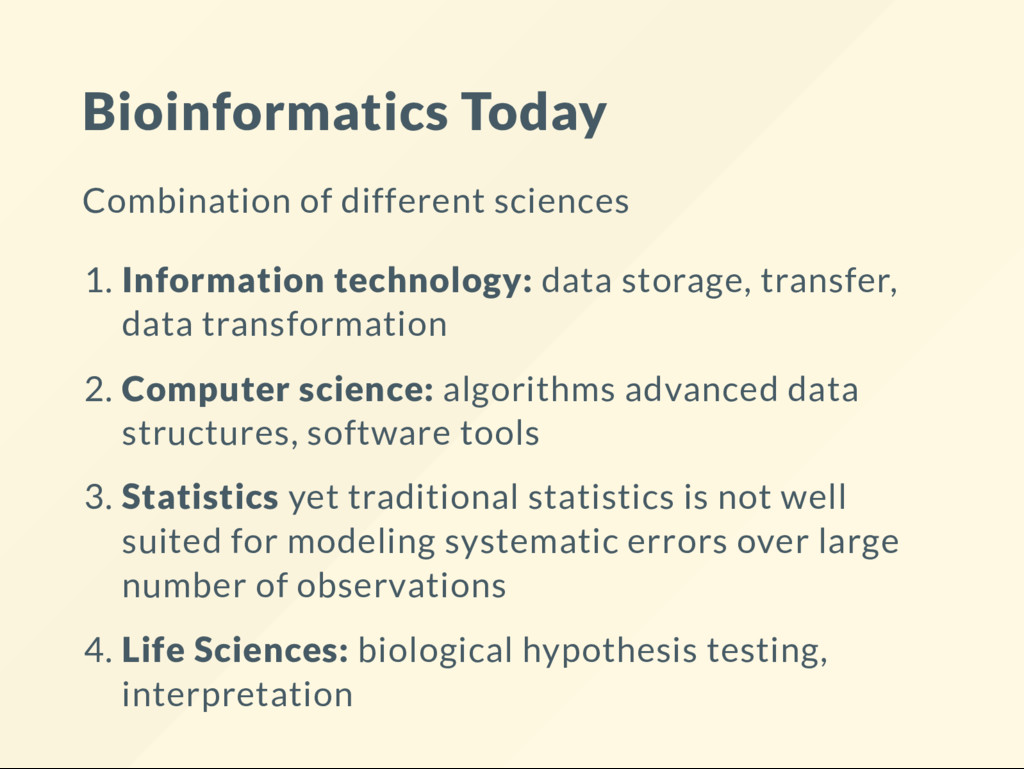
storage, transfer, data transformation 2. Computer science: algorithms advanced data structures, software tools 3. Statistics yet traditional statistics is not well suited for modeling systematic errors over large number of observations 4. Life Sciences: biological hypothesis testing, interpretation
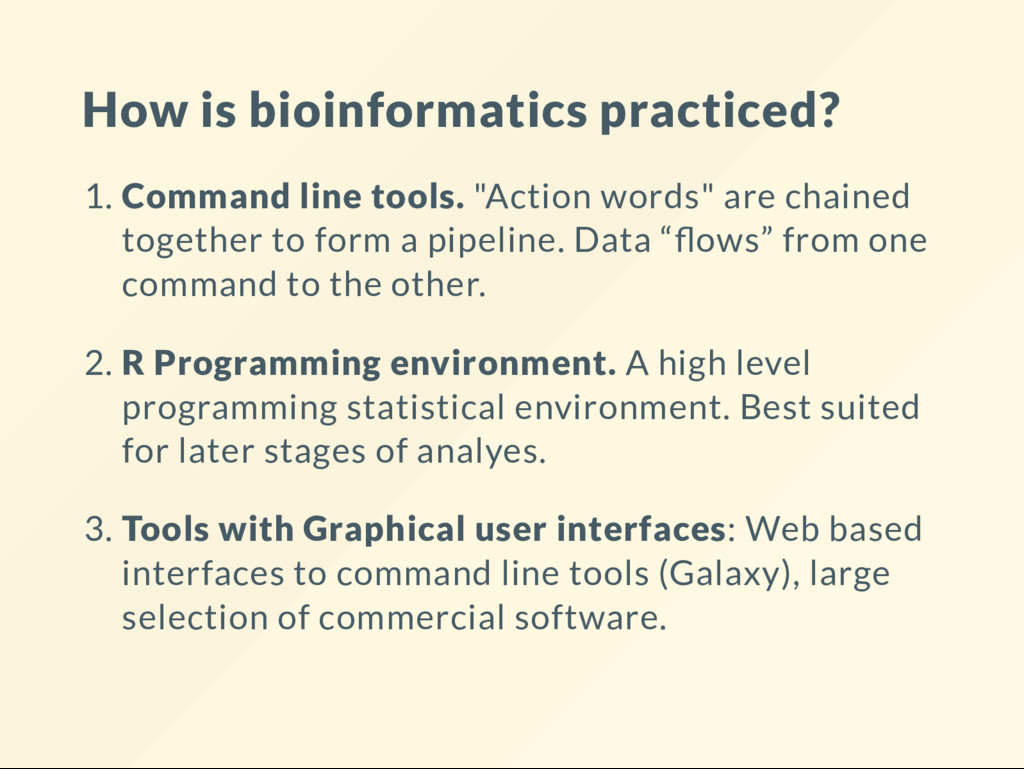
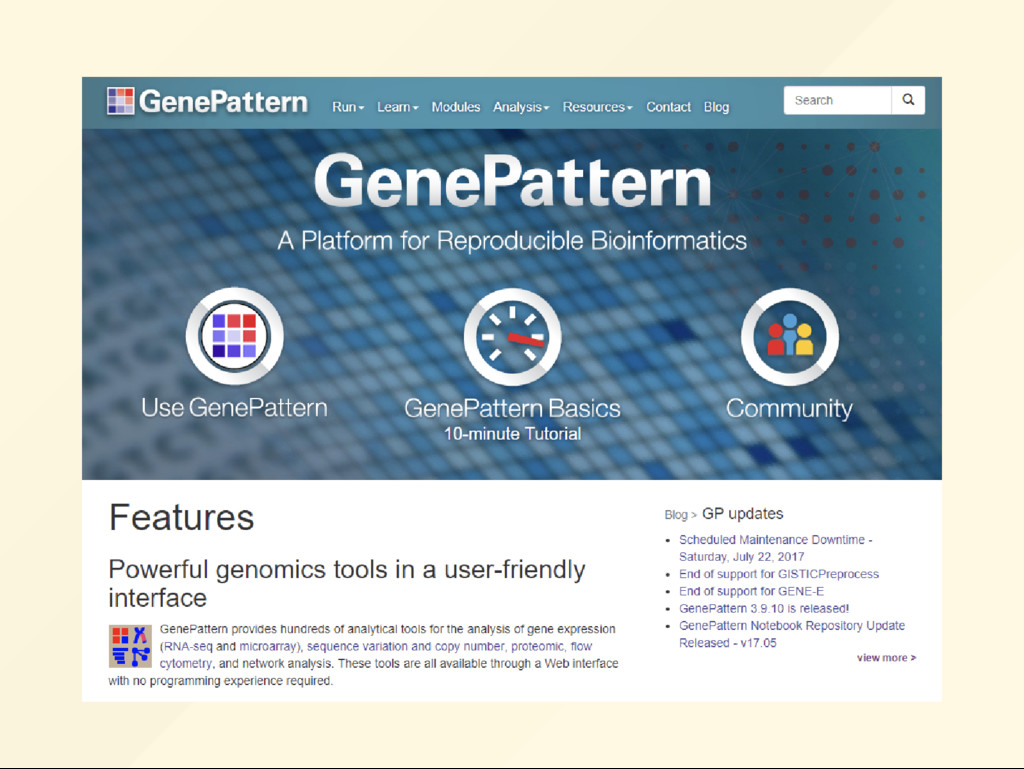
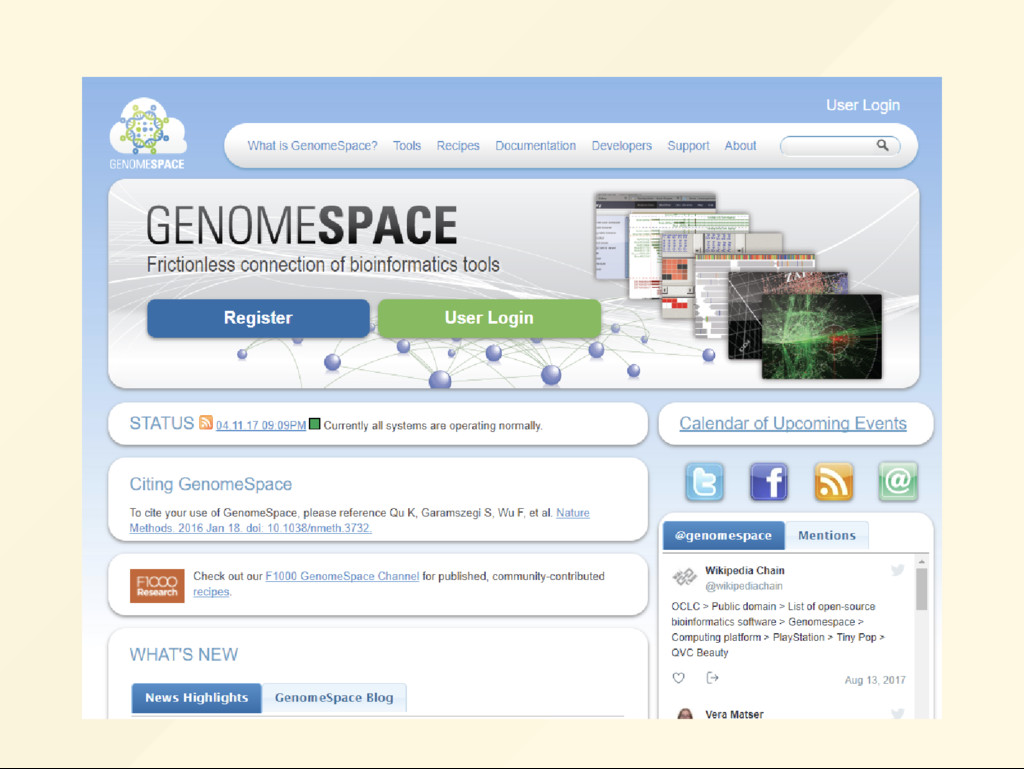
are chained together to form a pipeline. Data “ ows” from one command to the other. 2. R Programming environment. A high level programming statistical environment. Best suited for later stages of analyes. 3. Tools with Graphical user interfaces: Web based interfaces to command line tools (Galaxy), large selection of commercial software.
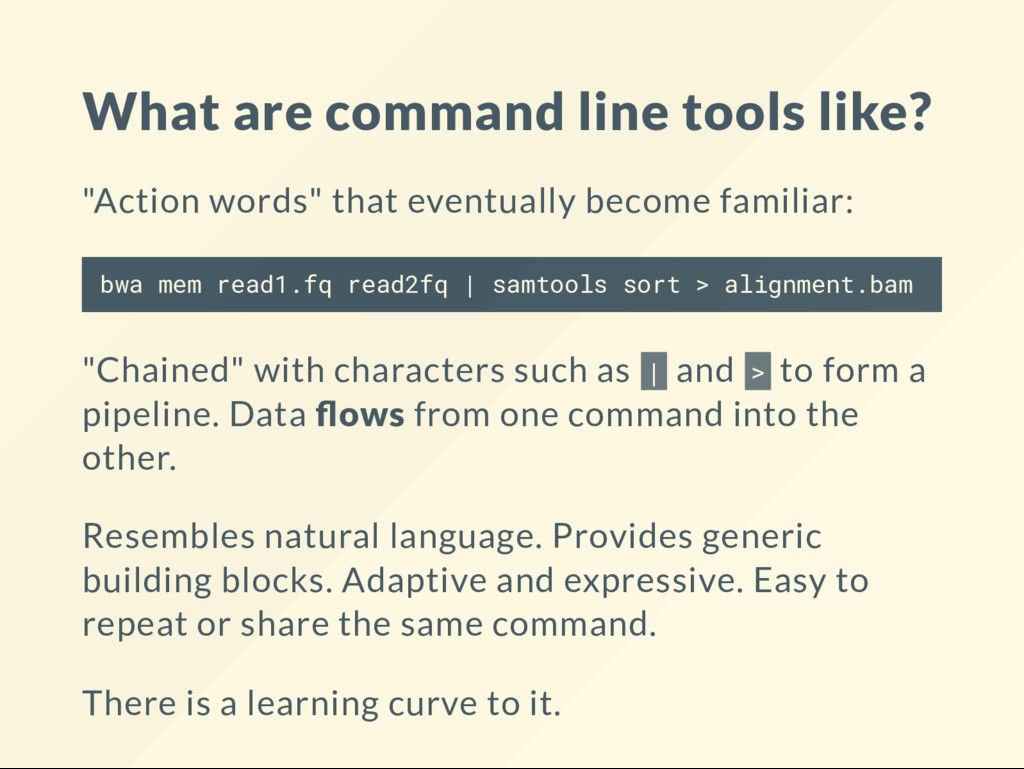
become familiar: bwa mem read1.fq read2fq | samtools sort > alignment.bam "Chained" with characters such as | and > to form a pipeline. Data ows from one command into the other. Resembles natural language. Provides generic building blocks. Adaptive and expressive. Easy to repeat or share the same command. There is a learning curve to it.
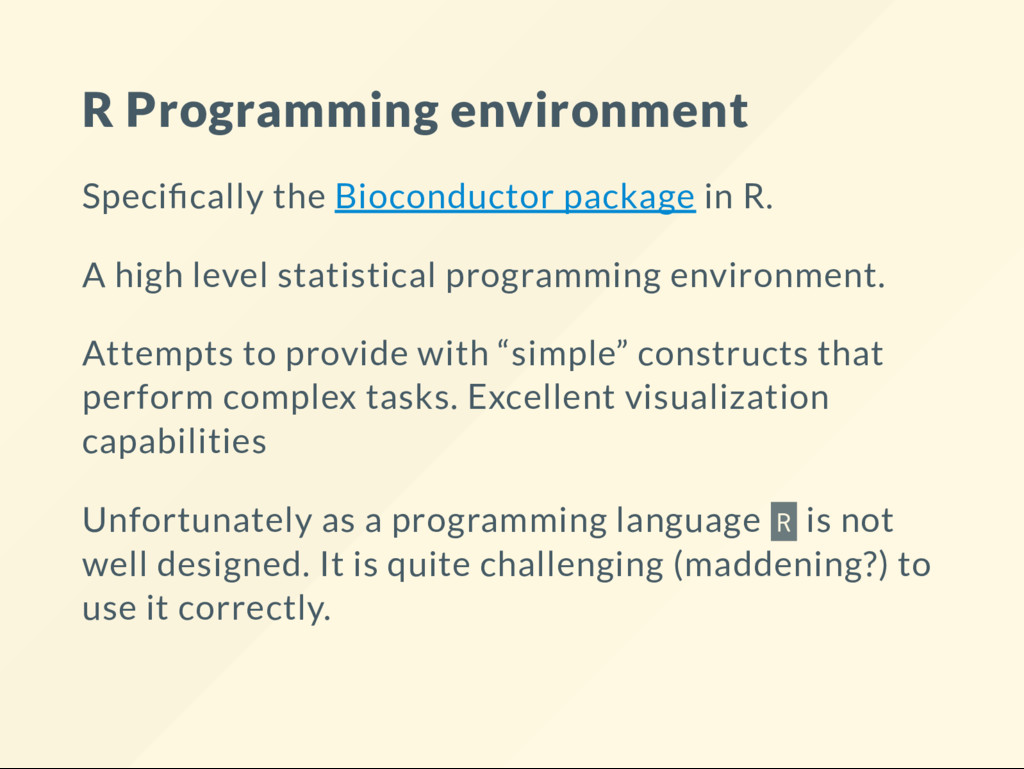
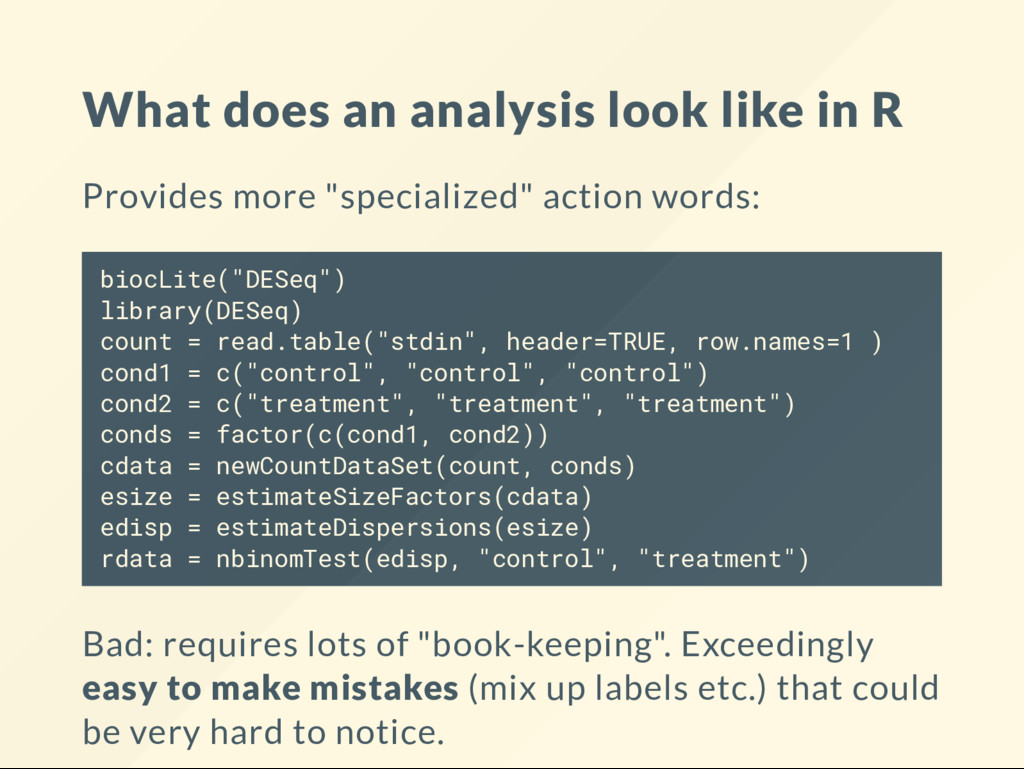
A high level statistical programming environment. Attempts to provide with “simple” constructs that perform complex tasks. Excellent visualization capabilities Unfortunately as a programming language R is not well designed. It is quite challenging (maddening?) to use it correctly.
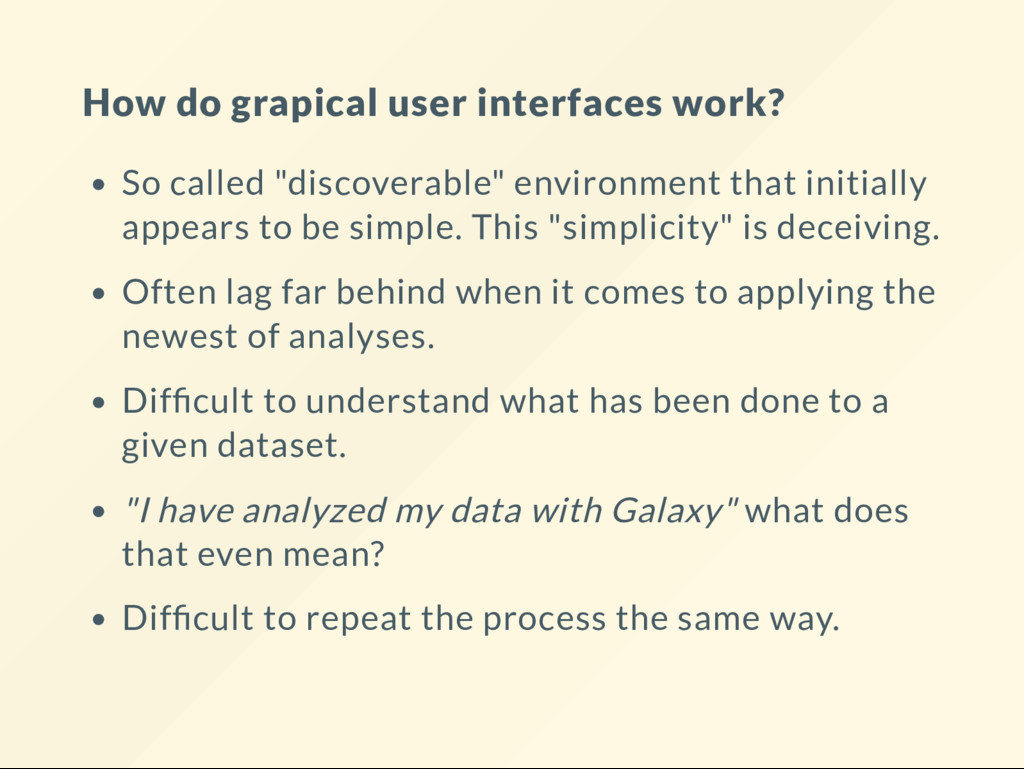
that initially appears to be simple. This "simplicity" is deceiving. Often lag far behind when it comes to applying the newest of analyses. Dif cult to understand what has been done to a given dataset. "I have analyzed my data with Galaxy" what does that even mean? Dif cult to repeat the process the same way.
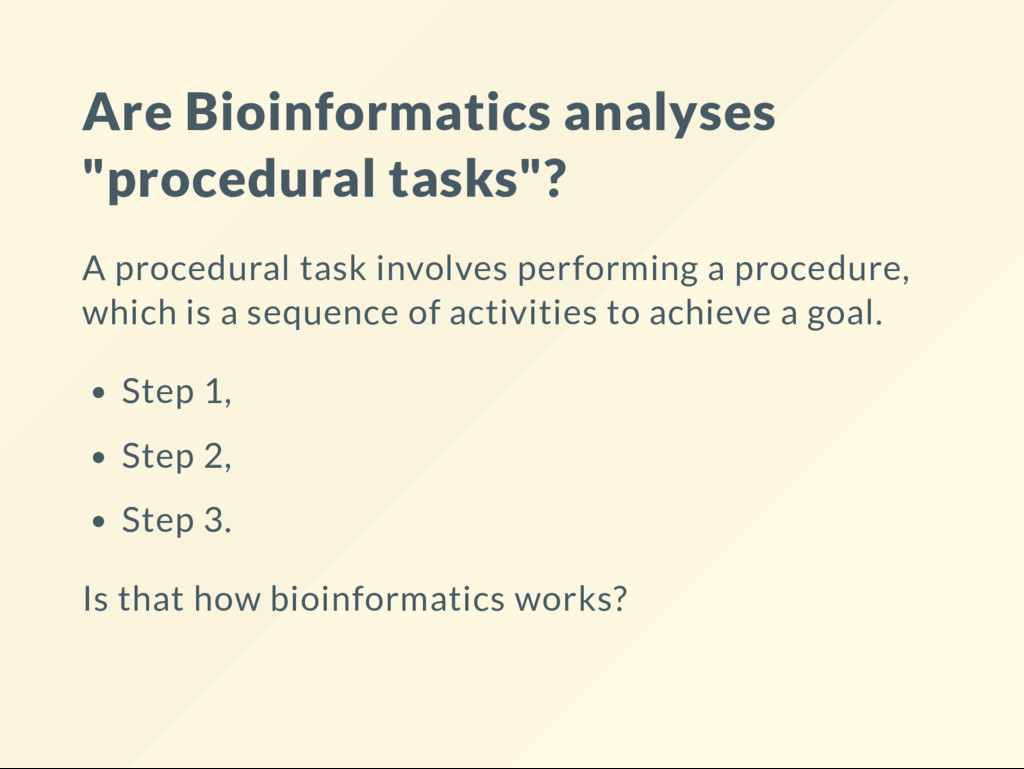
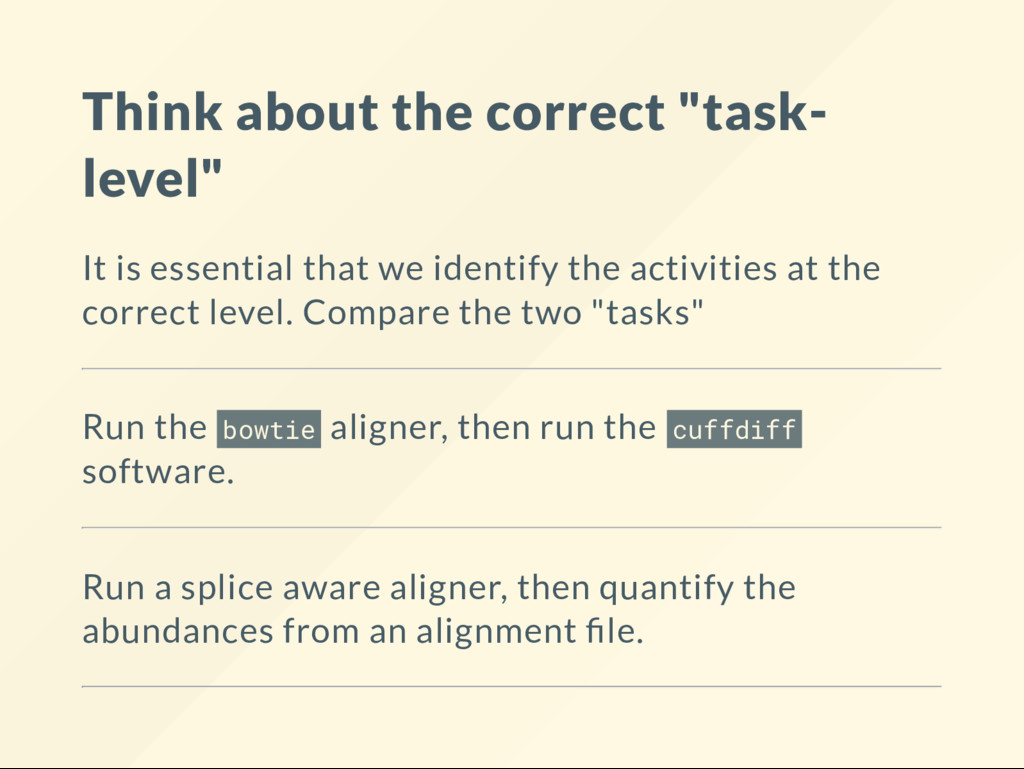
we identify the activities at the correct level. Compare the two "tasks" Run the bowtie aligner, then run the cuffdiff software. Run a splice aware aligner, then quantify the abundances from an alignment le.
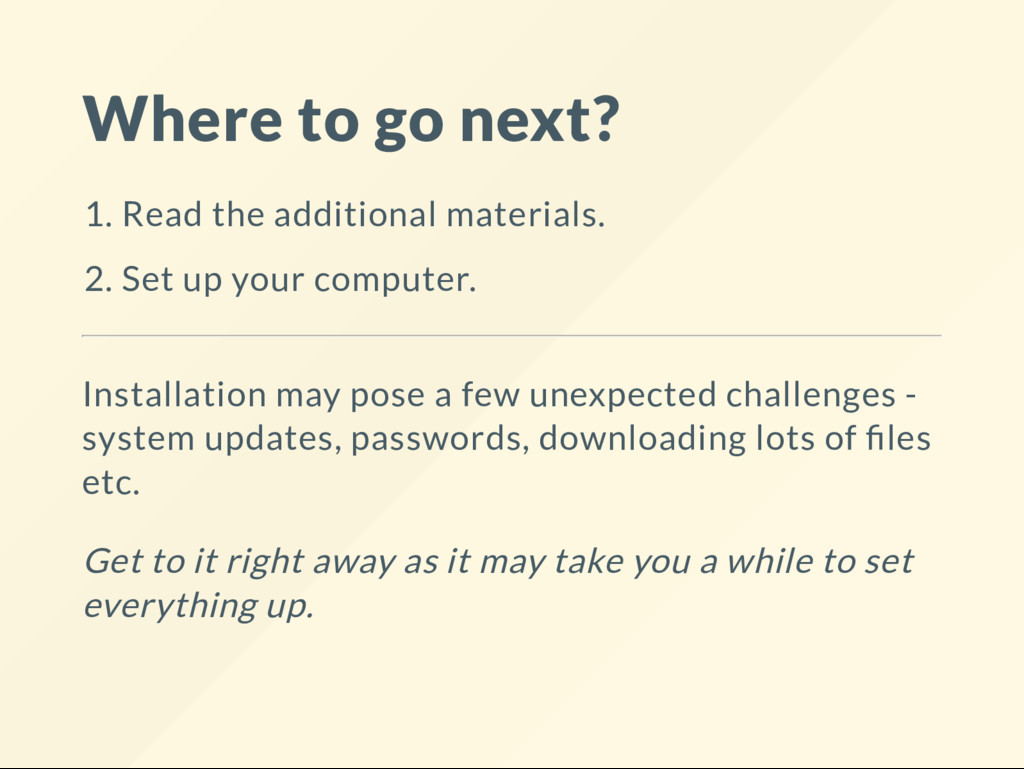
Set up your computer. Installation may pose a few unexpected challenges - system updates, passwords, downloading lots of les etc. Get to it right away as it may take you a while to set everything up.