Upgrade to Pro — share decks privately, control downloads, hide ads and more …

Parallel Execution With Oracle Database 12c - M...

Avatar for Ivica Arsov Ivica Arsov
December 04, 2017

Parallel Execution With Oracle Database 12c - Masterclass

Avatar for Ivica Arsov

Ivica Arsov

December 04, 2017
Tweet

More Decks by Ivica Arsov

Other Decks in Technology

Transcript

  1. Ivica Arsov Database Consultant • Based in Skopje, Macedonia •

    Oracle Certified Master 12c & 11g • Oracle ACE • Blogger • Founder of MKOUG Twitter: @IvicaArsov Blog: https://iarsov.com 2
  2. ABOUT PYTHIAN Pythian’s 400+ IT professionals help companies adopt and

    manage disruptive technologies to better compete 3
  3. TECHNICAL EXPERTISE Infrastructure: Transforming and managing the IT infrastructure that

    supports the business DevOps: Providing critical velocity in software deployment by adopting DevOps practices Cloud: Using the disruptive nature of cloud for accelerated, cost-effective growth Databases: Ensuring databases are reliable, secure, available and continuously optimized Big Data: Harnessing the transformative power of data on a massive scale Advanced Analytics: Mining data for insights & business transformation using data science 4
  4. AGENDA Parallel execution basics Parallel execution administration Distribution methods (including

    bloom filters) Auto DoP In-memory parallel execution Blocking and non-blocking operations Tracing parallel execution 5
  5. The basic idea of parallelism “Parallel computing is a type

    of computation in which many calculations or the execution of processes are carried out simultaneously.” source: Wikipedia 7
  6. The basic theory of “divide and conquer” • “Divide and

    conquer” algorithms are adapted for multi-processor architectures • Problem is break down into more than one sub-problem of same or related type • The solutions of each sub-problem are combined to give a solution to the original problem • Oracle’s technique: divide the data in granules and do the processing 8
  7. Understanding the granules • The basic unit of work •

    Block range granules • Partitions granules • Partition granules limit the (DoP) PX servers used. Every partition is scanned by only one PX server. 9
  8. What can be parallelized ? • Table scans, index fast

    full scans, partitioned index range scans and tables • Nested loops, hash joins, sort merge, star transformation • Queries and subqueries • DDL and DML statements INSERT, UPDATE, DELETE, CTAS, CREATE/REBUILD INDEX, MOVE/SPLIT/COALESCE PARTITION 10
  9. Parallel execution terminology • DoP – number of server processes

    used for single operation • Default DoP: PARALLEL_THREADS_PER_CPU * CPU_COUNT * INSTANCE_COUNT • Producer and consumer model = 2xDoP Acronym Description QC Query coordinator DoP Degree of parallelism TQ Table queue DFO Data flow operation DFO Tree Data flow operation tree 11
  10. Understanding the role of query coordinator (QC) • The server

    (foreground) process becomes the query coordinator • The DoP is determined before actual query execution • QC assigns each of the PX slaves with work • Starting 12c, one of the available PX servers will execute serial steps from the execution plan • Responsible to deliver the result to the client process 12
  11. ------------------------------------------------------------------------------------------------ | Id | Operation | Name | Rows |

    Cost (%CPU)| TQ |IN-OUT| PQ Distrib | ------------------------------------------------------------------------------------------------ | 0 | SELECT STATEMENT | | 918K| 165 (2)| | | | | 1 | PX COORDINATOR | | | | | | | | 2 | PX SEND QC (RANDOM) | :TQ10002 | 918K| 165 (2)| Q1,02 | P->S | QC (RAND) | |* 3 | HASH JOIN BUFFERED | | 918K| 165 (2)| Q1,02 | PCWP | | | 4 | PX RECEIVE | | 55500 | 74 (0)| Q1,02 | PCWP | | | 5 | PX SEND HASH | :TQ10000 | 55500 | 74 (0)| Q1,00 | P->P | HASH | | 6 | PX BLOCK ITERATOR | | 55500 | 74 (0)| Q1,00 | PCWC | | | 7 | TABLE ACCESS FULL| CUSTOMERS | 55500 | 74 (0)| Q1,00 | PCWP | | | 8 | PX RECEIVE | | 918K| 90 (2)| Q1,02 | PCWP | | | 9 | PX SEND HASH | :TQ10001 | 918K| 90 (2)| Q1,01 | P->P | HASH | | 10 | PX BLOCK ITERATOR | | 918K| 90 (2)| Q1,01 | PCWC | | | 11 | TABLE ACCESS FULL| SALES | 918K| 90 (2)| Q1,01 | PCWP | | 17
  12. Producer and consumer model impact on DoP What we’ve learned

    from previous example ? • DoP represents the number of processes (PX slaves) associated with a single operation (i.e. table scan, hash join etc.) • Due to the producer and consumer model, 2xDoP might be allocated. The DoP is allocated per set of slaves (max. of two sets) • The rule of 2xDoP is not always enforced. Example: single table scan needs only one set of PX processes 18
  13. DFO (data flow operation) and DFO trees • Data flow

    operation - basic unit of work carried by PX servers • Identified by PX SEND operation in the execution plan • Multiple DFO’s can appear • One DFO = 1 PX server set is being used • Multiple DFO’s = most of 2 PX server sets are being used • DFO’s are grouped under one DFO tree (PX coordinator) 19
  14. DFO (data flow operation) and DFO trees … continued ---------------------------------------------------------------------------------------------------------------

    | Id | Operation | Name | Rows | Bytes | Cost (%CPU)| Time | TQ |IN-OUT| PQ Distrib | --------------------------------------------------------------------------------------------------------------- | 0 | SELECT STATEMENT | | 55500 | 1083K| 147 (0)| 00:00:01 | | | | | 1 | PX COORDINATOR | | | | | | | | | | 2 | PX SEND QC (RANDOM)| :TQ10000 | 55500 | 1083K| 147 (0)| 00:00:01 | Q1,00 | P->S | QC (RAND) | | 3 | PX BLOCK ITERATOR | | 55500 | 1083K| 147 (0)| 00:00:01 | Q1,00 | PCWC | | | 4 | TABLE ACCESS FULL| CUSTOMERS | 55500 | 1083K| 147 (0)| 00:00:01 | Q1,00 | PCWP | | --------------------------------------------------------------------------------------------------------------- Data flow operation DFO tree root 20
  15. Concurrent DFO trees • Multiple DFO trees can occur with

    non-correlated subqueries • Statement can allocate more PX servers than 2xDoP • Mostly seen with subqueries and temp table transformation operation • Each parallelizer can start at different time Example (DoP = 2): SELECT COL1 FROM T1 WHERE T1.COL1 > (SELECT AVG(COL1) FROM T2) AND T1.COL2 > (SELECT AVG(COL2) FROM T3) ORDER BY COL3, COL4 22
  16. ORDER BY = 2xDoP Concurrent DFO trees … continued -----------------------------------------------------------------------------------------------------------------------------

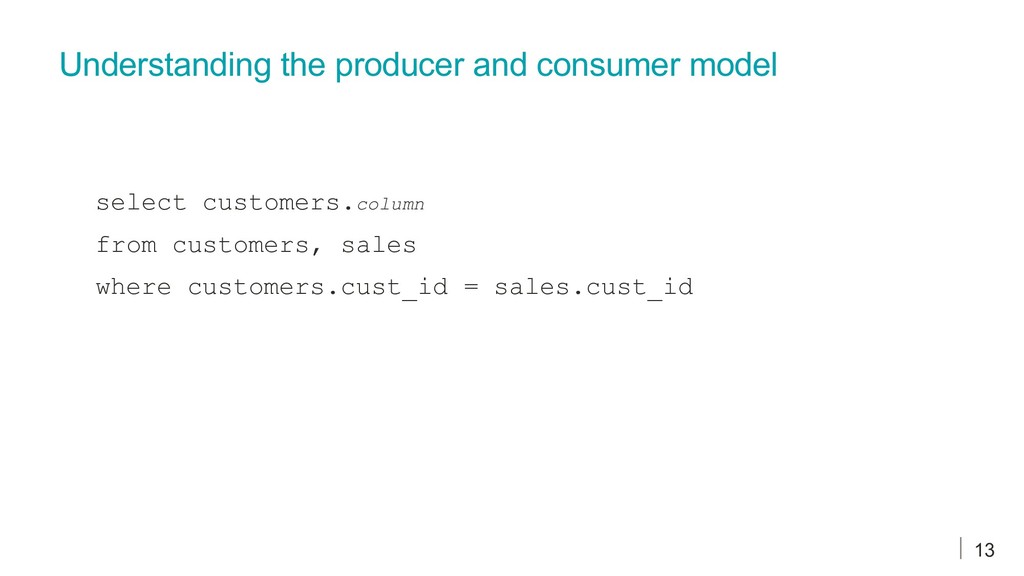
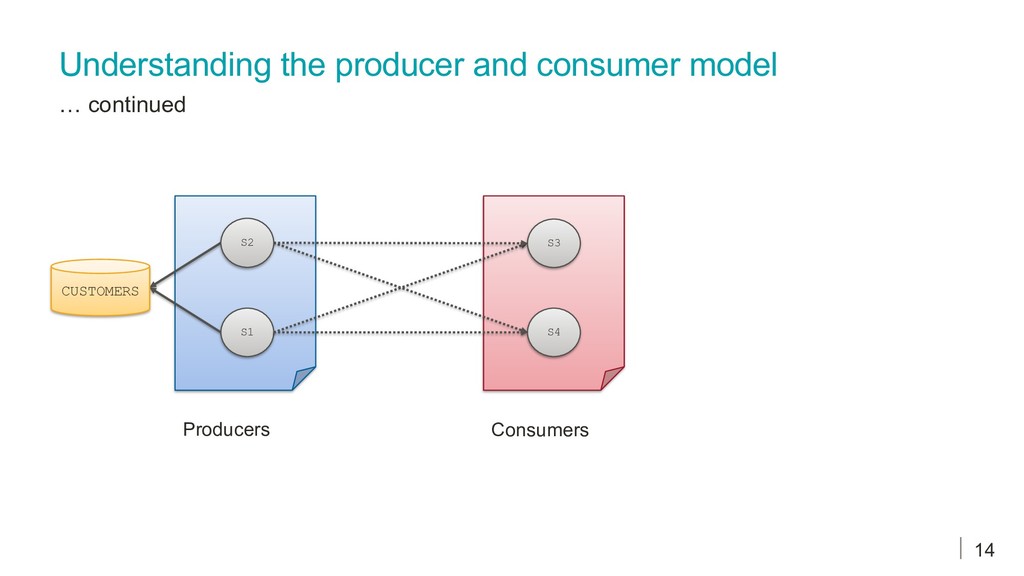
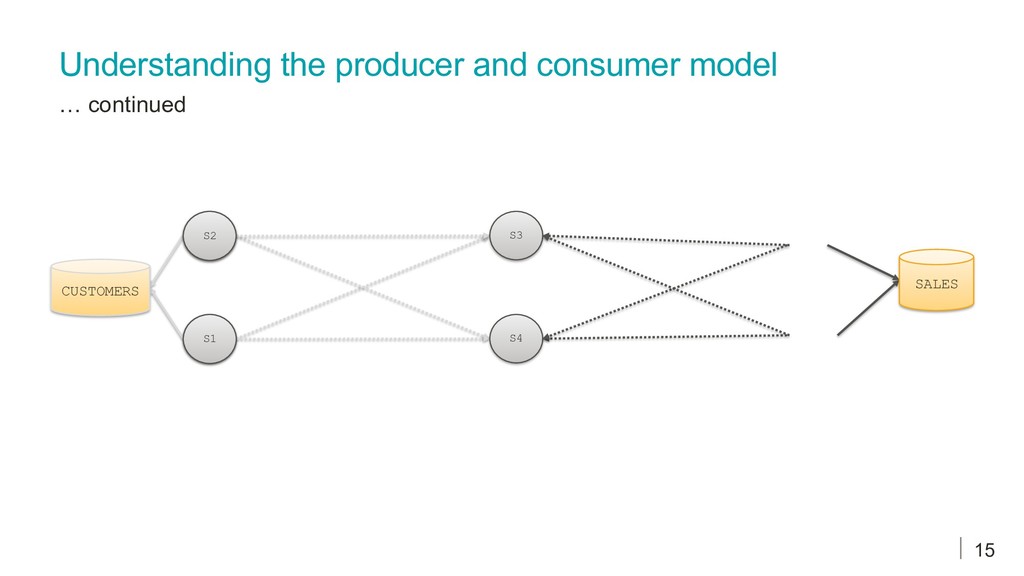
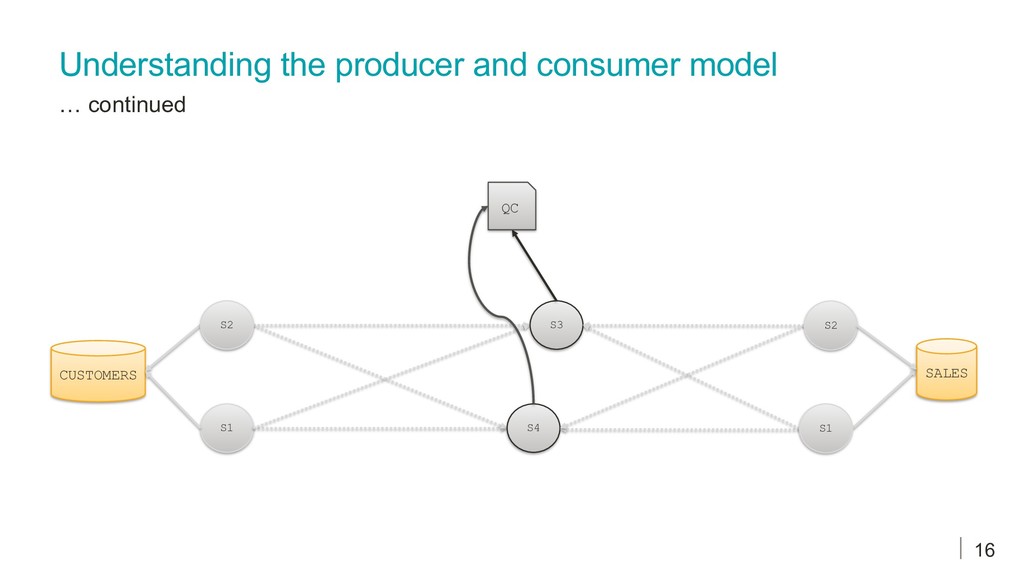
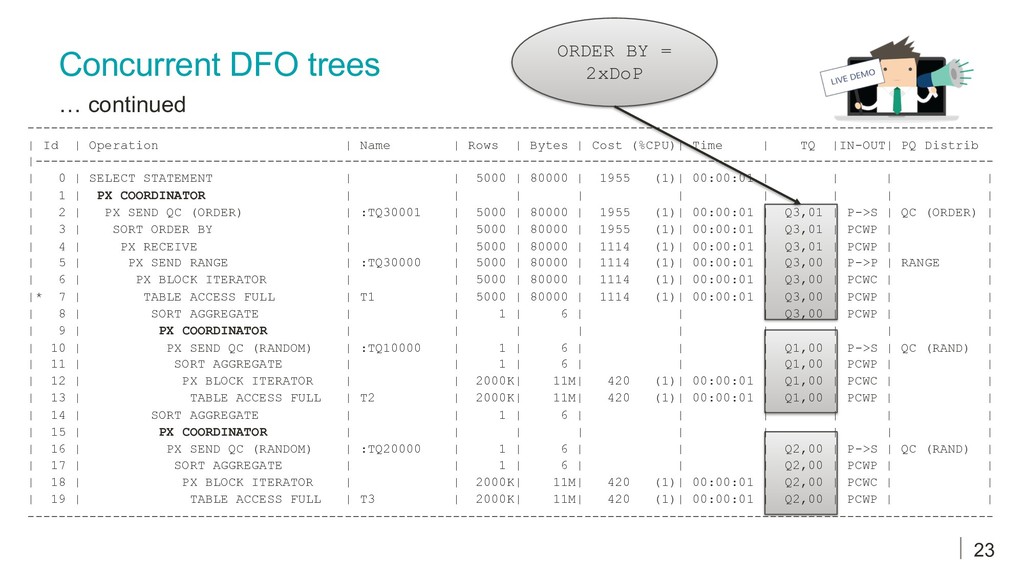
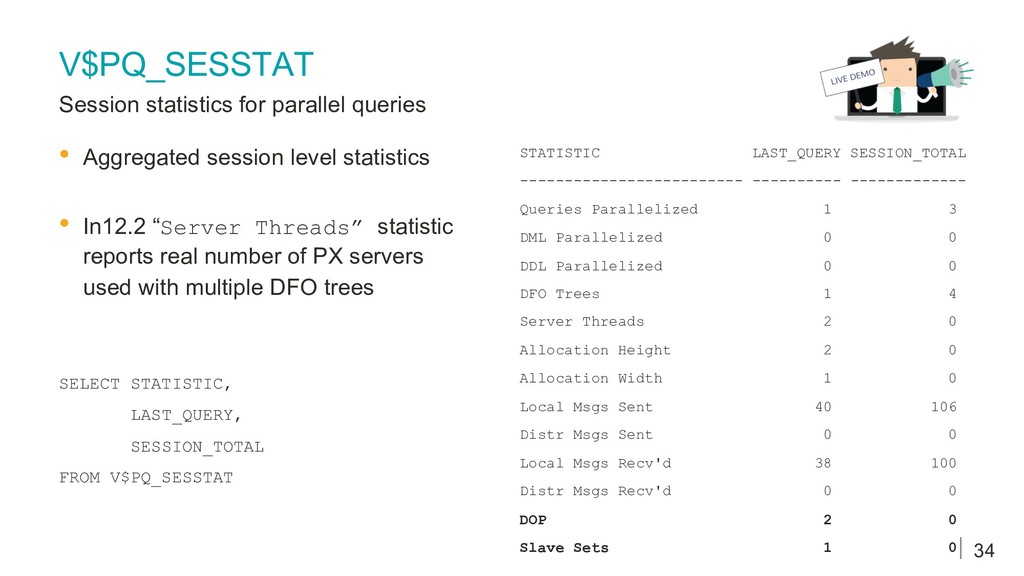
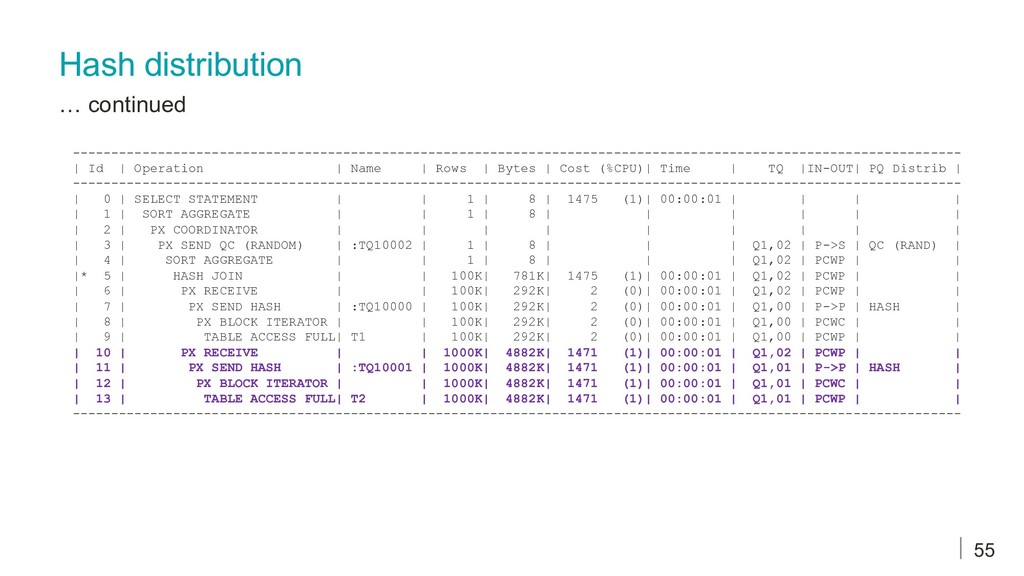
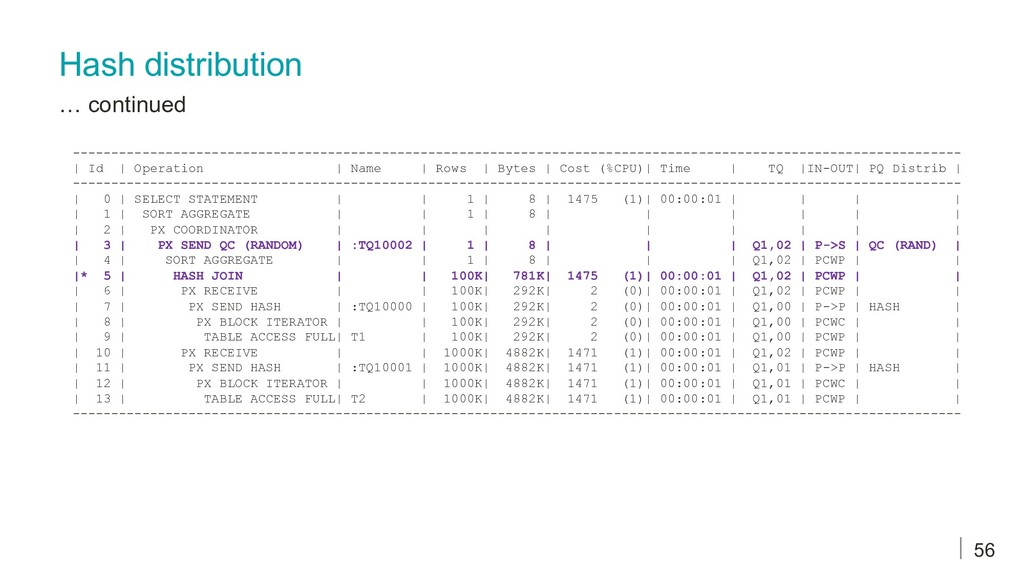
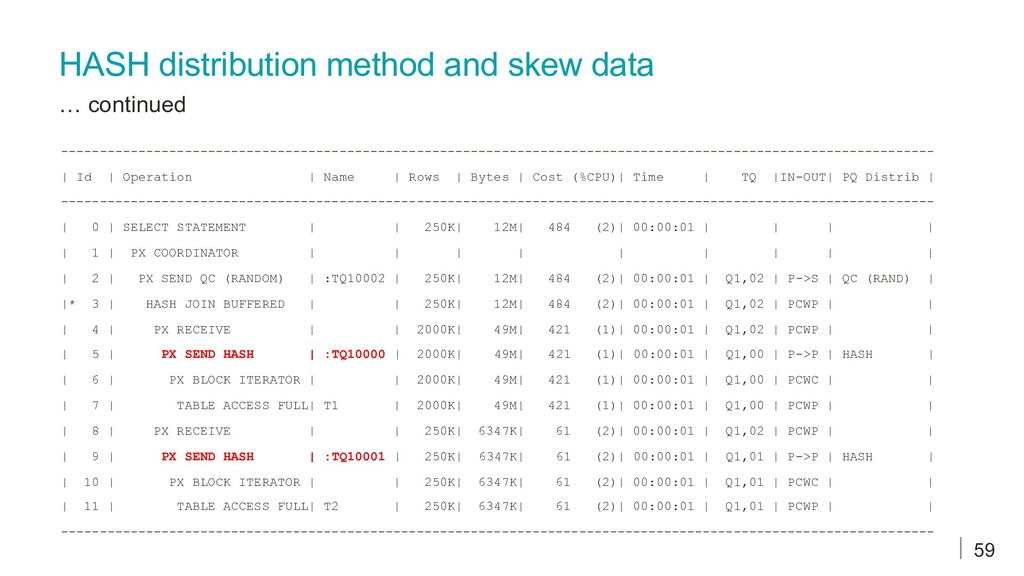
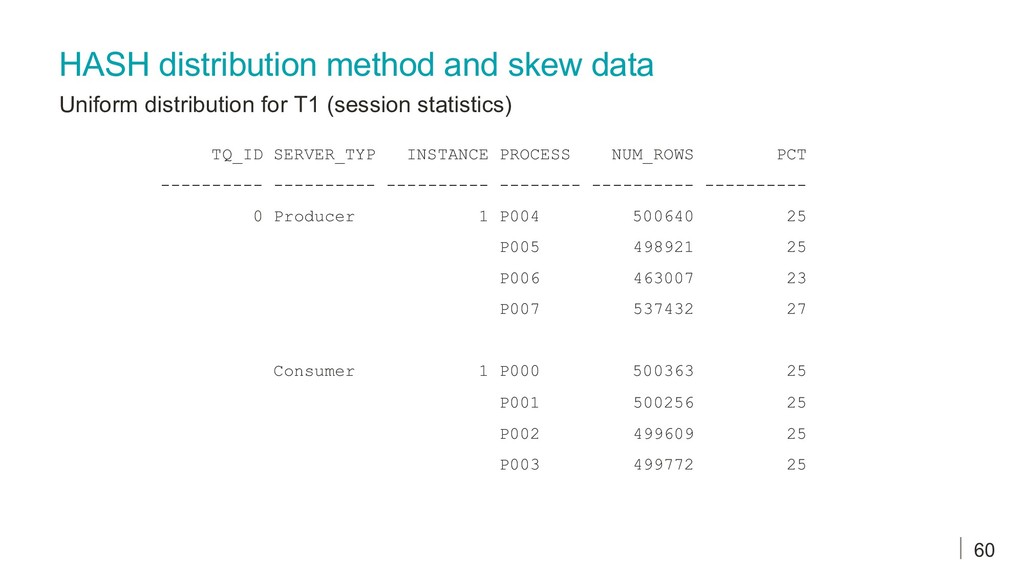
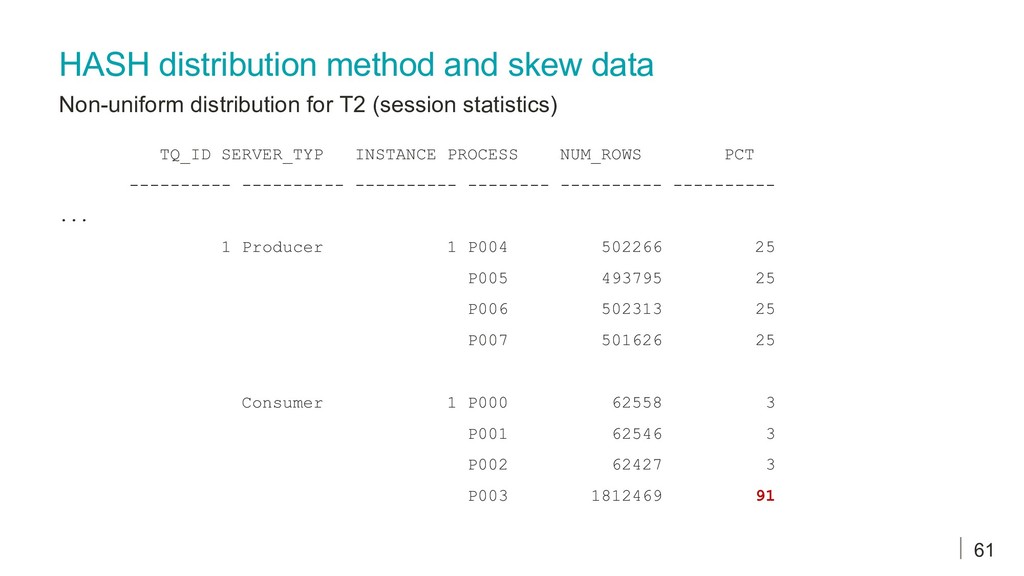
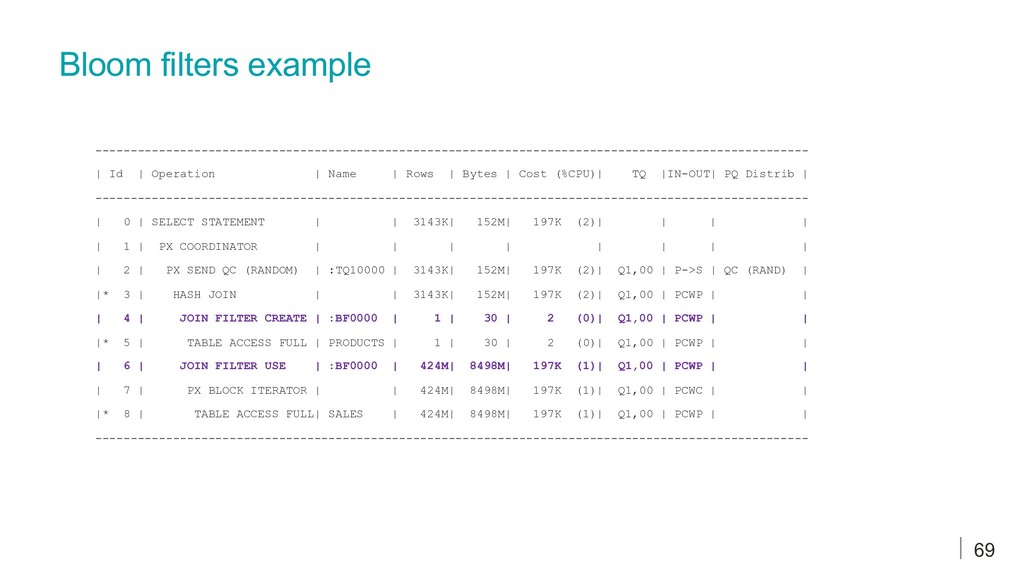
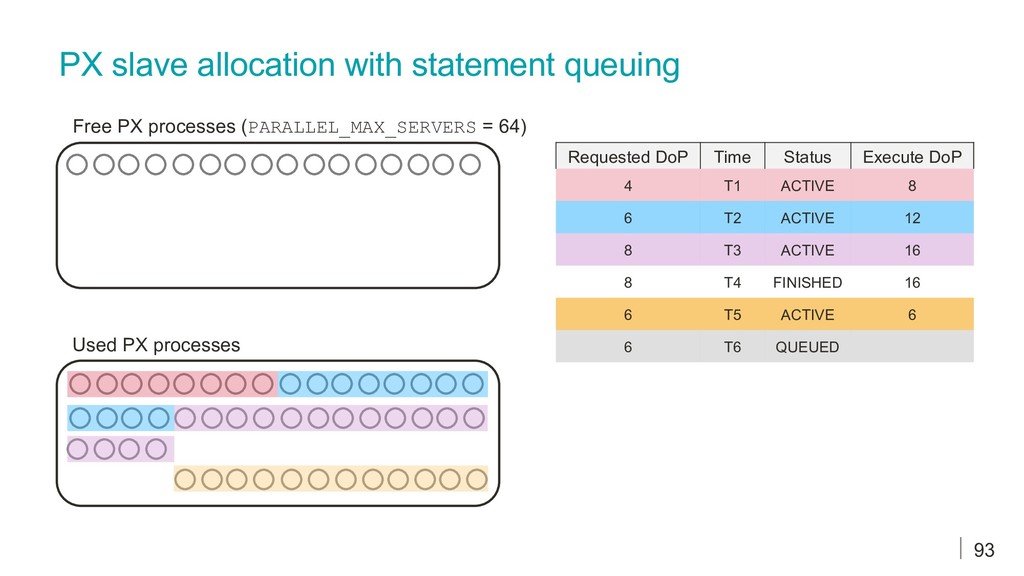
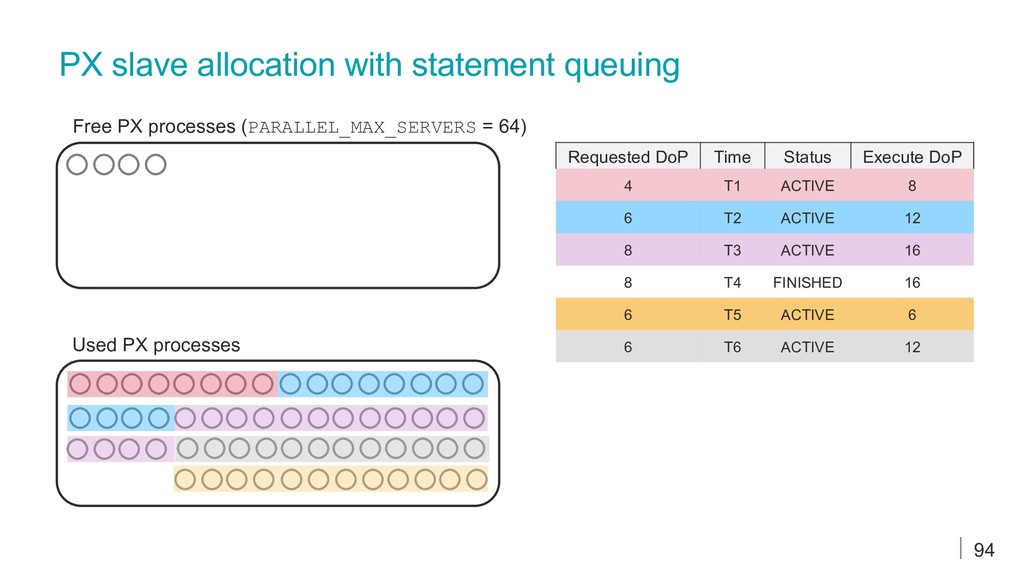
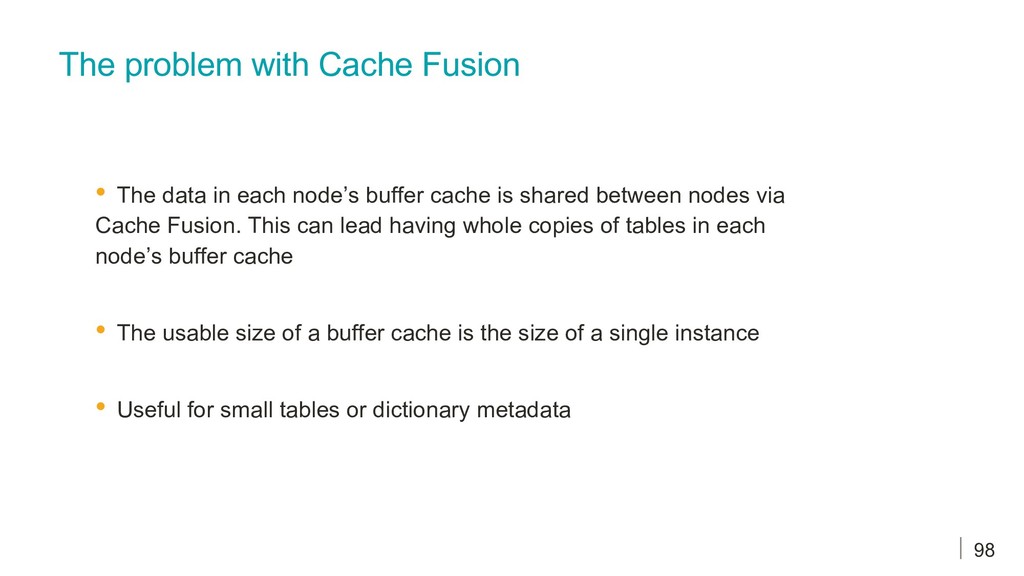
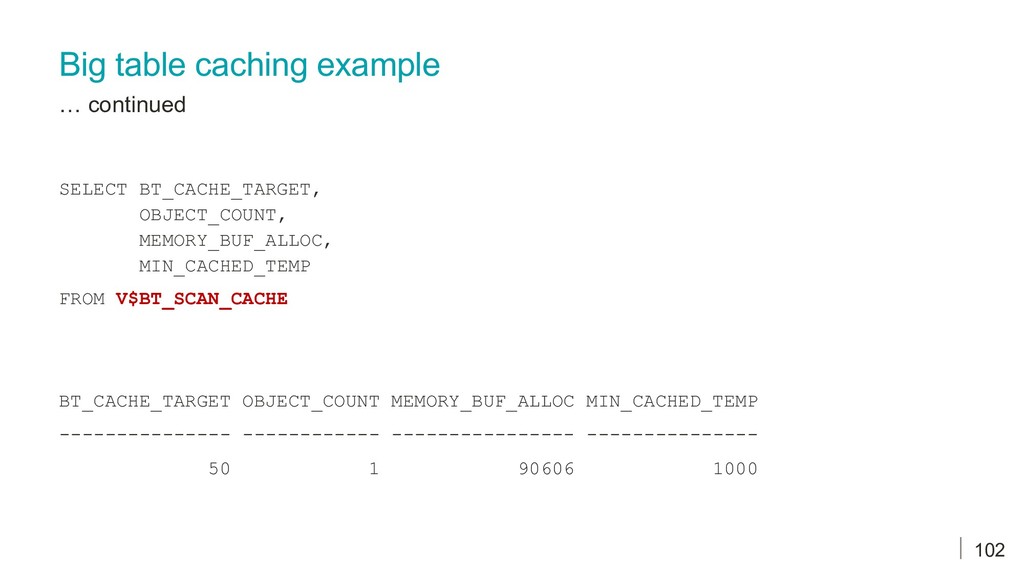
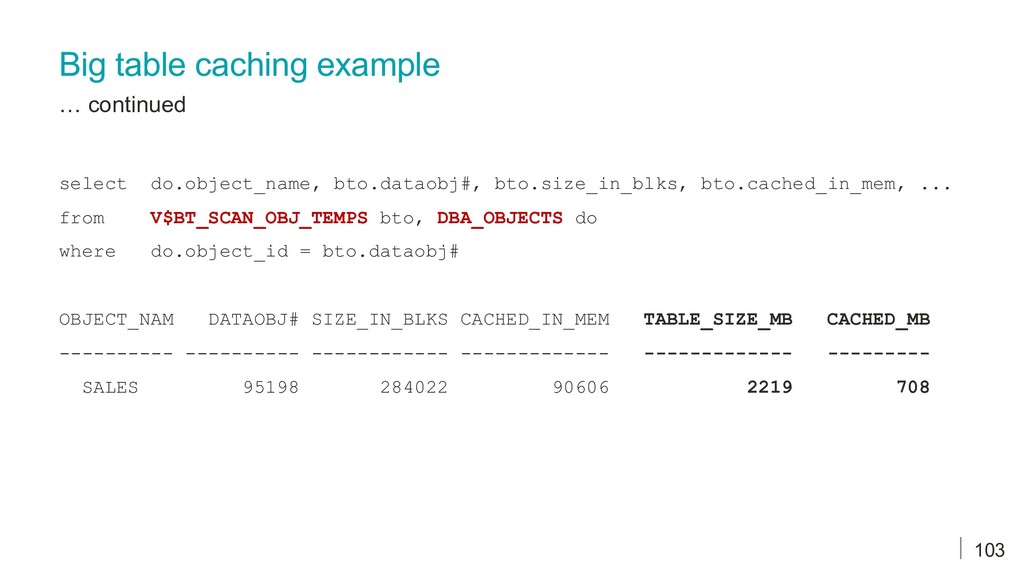
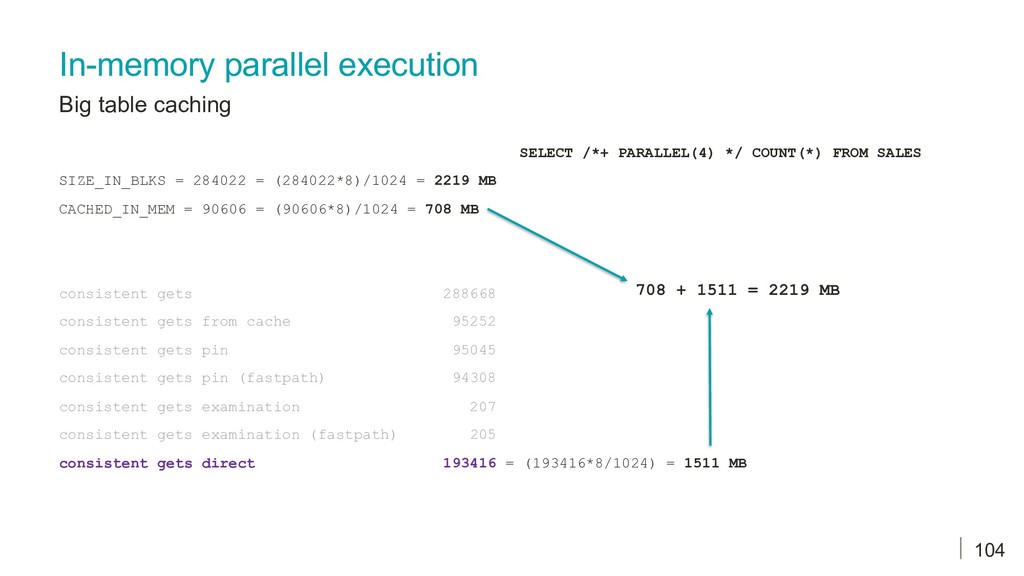
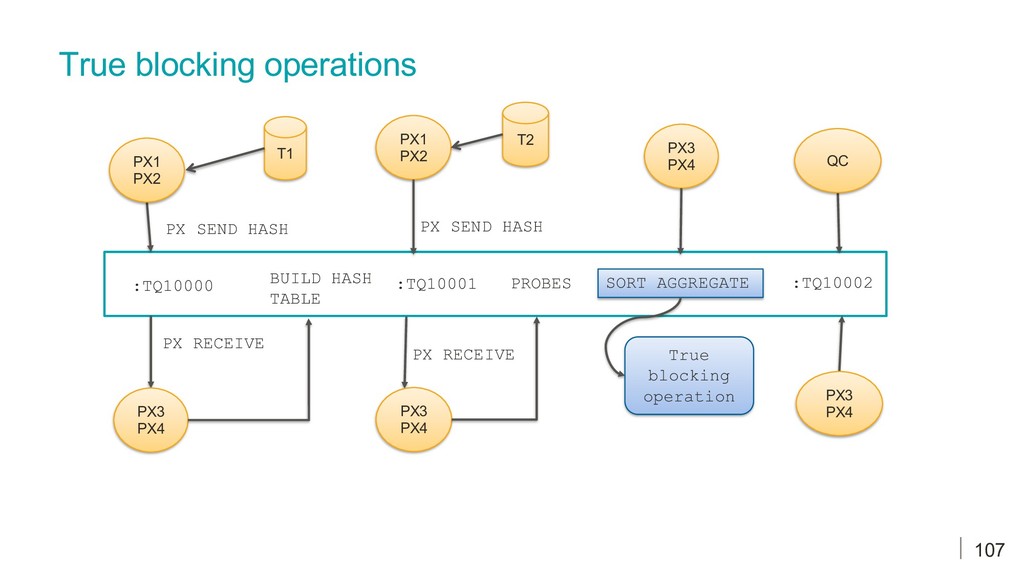
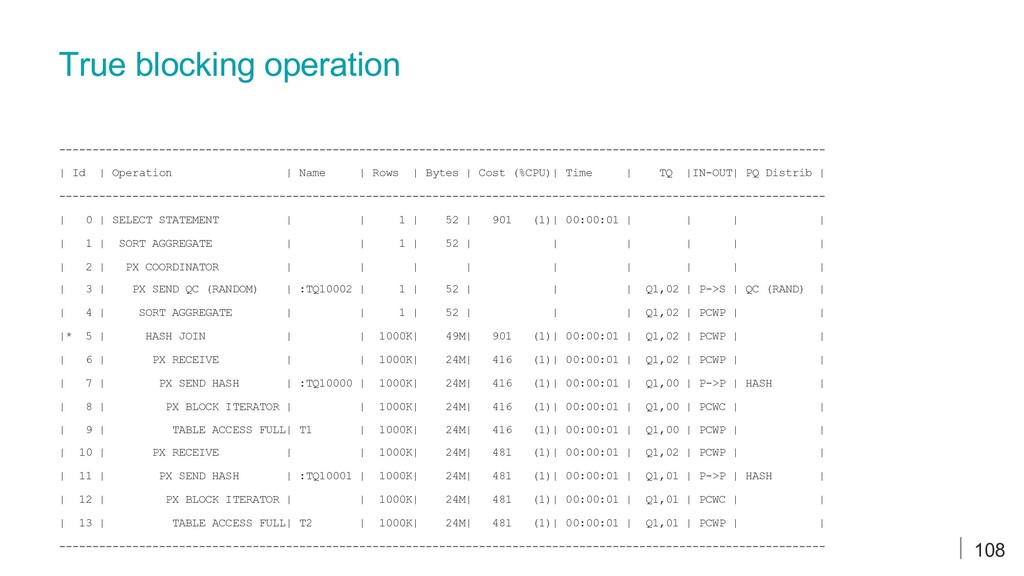
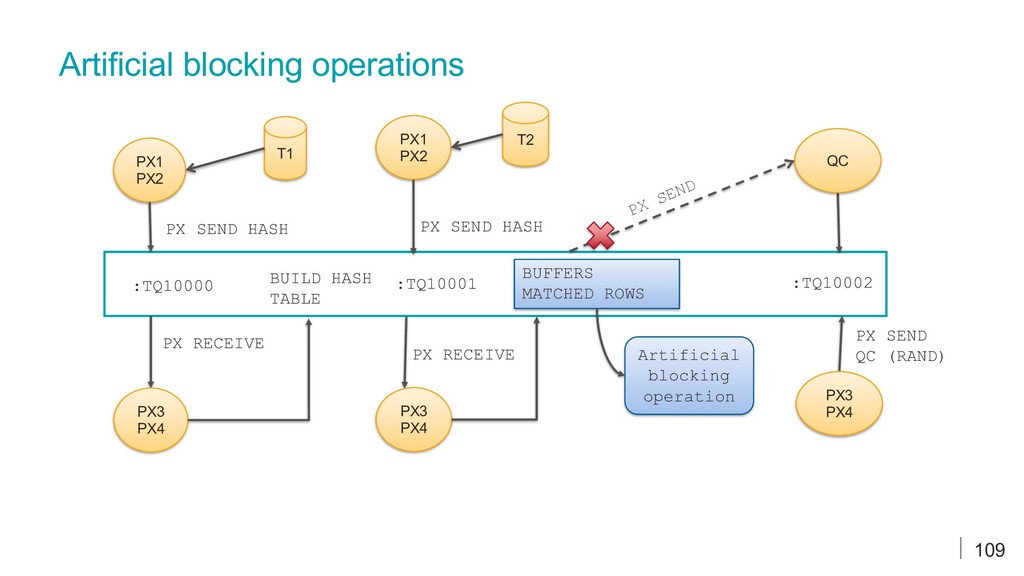
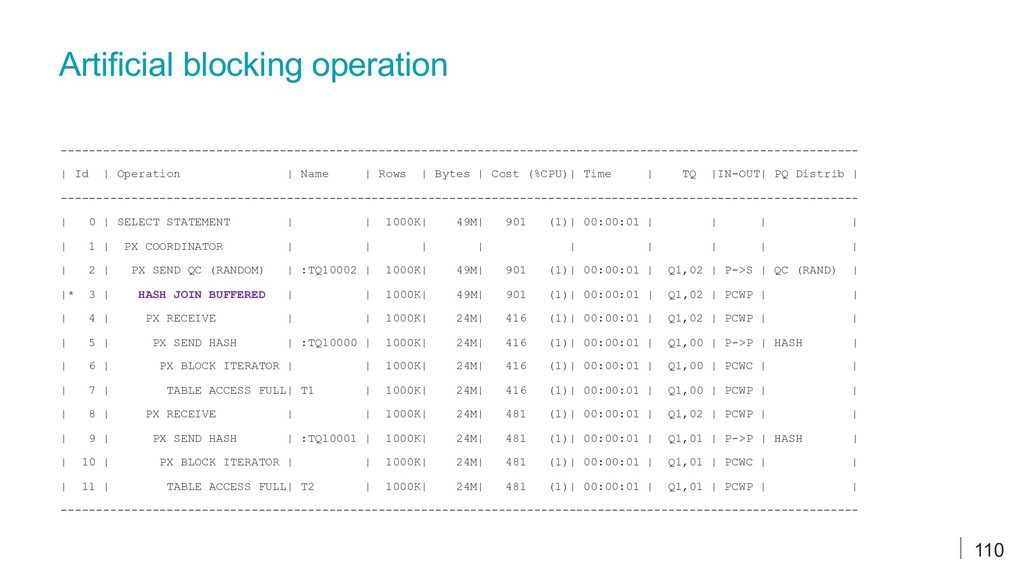
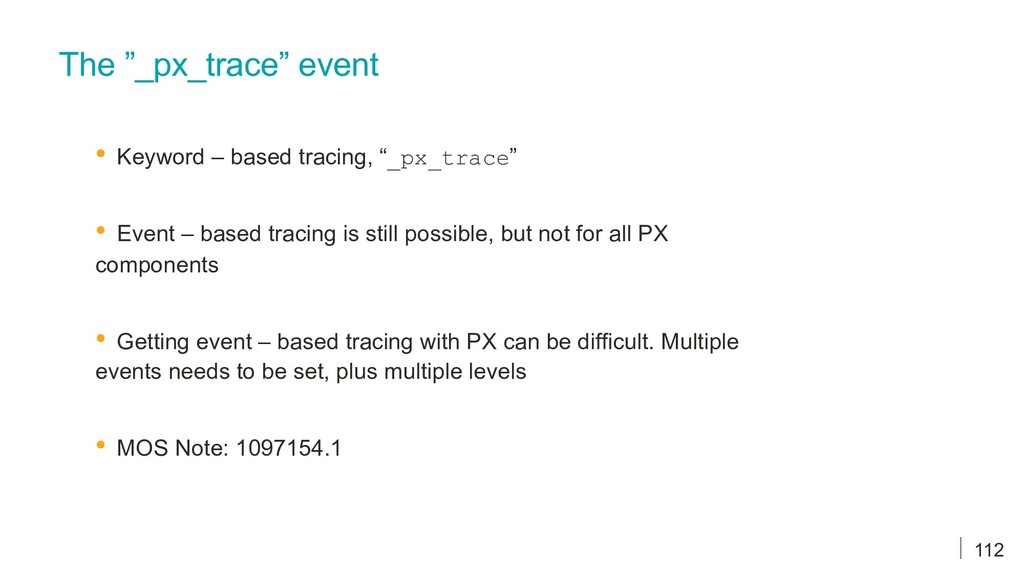
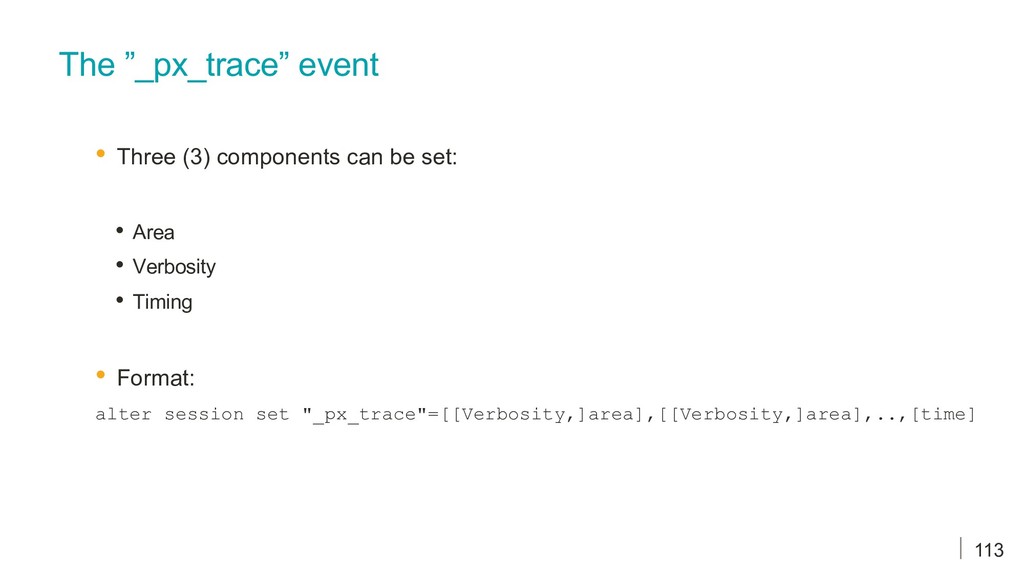
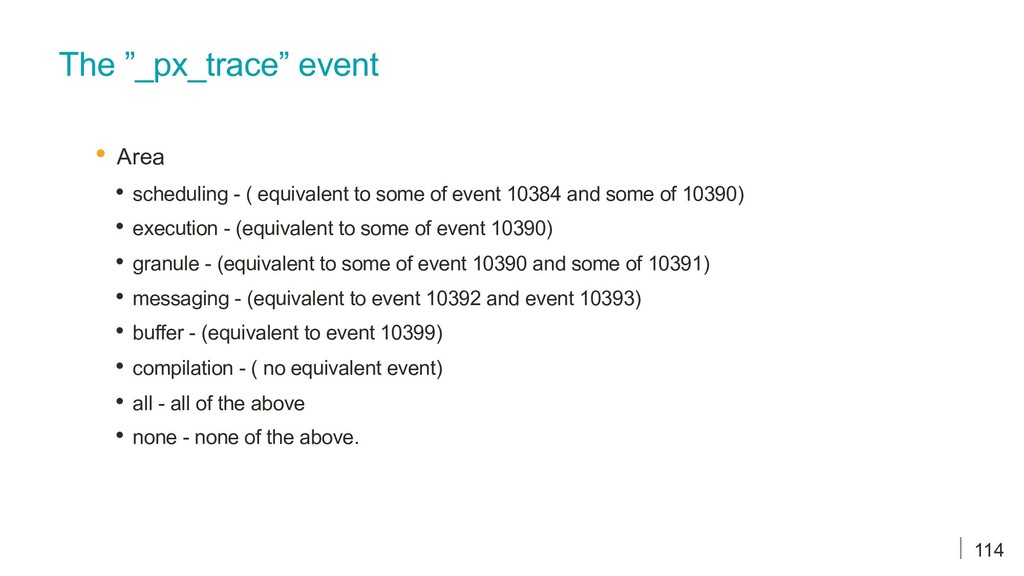
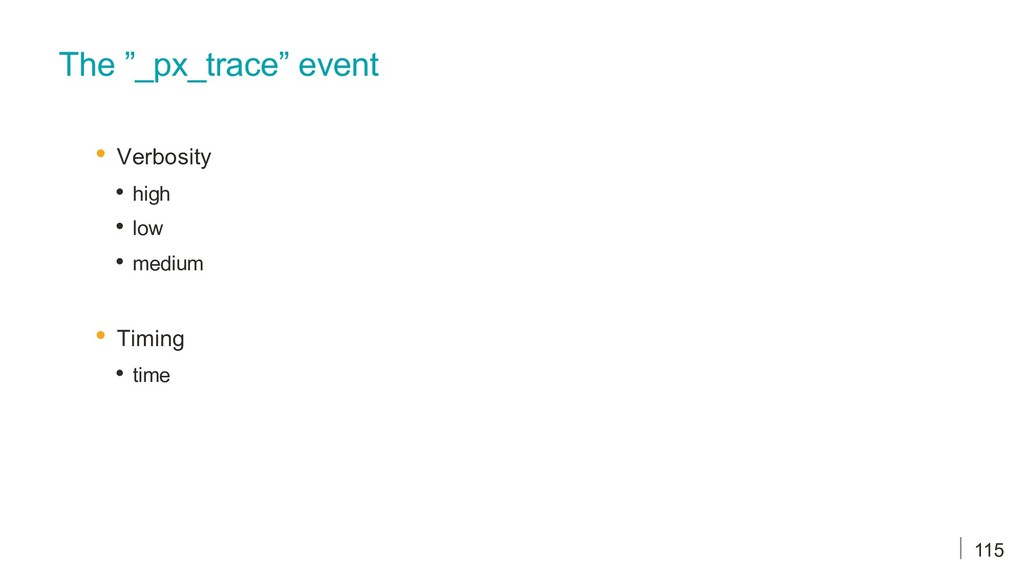
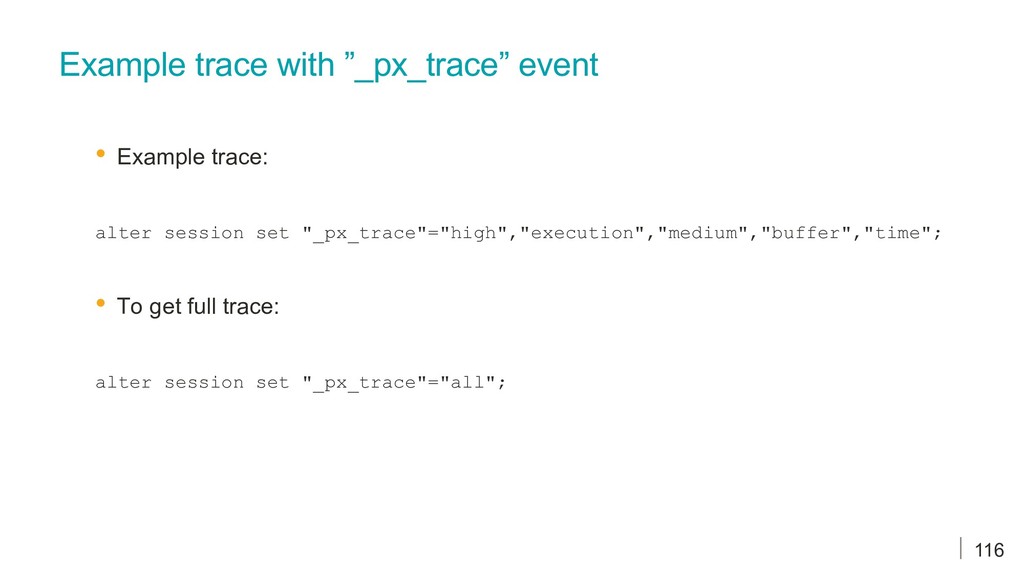
    | Id | Operation | Name | Rows | Bytes | Cost (%CPU)| Time | TQ |IN-OUT| PQ Distrib |---------------------------------------------------------------------------------------------------------------------------- | 0 | SELECT STATEMENT | | 5000 | 80000 | 1955 (1)| 00:00:01 | | | | | 1 | PX COORDINATOR | | | | | | | | | | 2 | PX SEND QC (ORDER) | :TQ30001 | 5000 | 80000 | 1955 (1)| 00:00:01 | Q3,01 | P->S | QC (ORDER) | | 3 | SORT ORDER BY | | 5000 | 80000 | 1955 (1)| 00:00:01 | Q3,01 | PCWP | | | 4 | PX RECEIVE | | 5000 | 80000 | 1114 (1)| 00:00:01 | Q3,01 | PCWP | | | 5 | PX SEND RANGE | :TQ30000 | 5000 | 80000 | 1114 (1)| 00:00:01 | Q3,00 | P->P | RANGE | | 6 | PX BLOCK ITERATOR | | 5000 | 80000 | 1114 (1)| 00:00:01 | Q3,00 | PCWC | | |* 7 | TABLE ACCESS FULL | T1 | 5000 | 80000 | 1114 (1)| 00:00:01 | Q3,00 | PCWP | | | 8 | SORT AGGREGATE | | 1 | 6 | | | Q3,00 | PCWP | | | 9 | PX COORDINATOR | | | | | | | | | | 10 | PX SEND QC (RANDOM) | :TQ10000 | 1 | 6 | | | Q1,00 | P->S | QC (RAND) | | 11 | SORT AGGREGATE | | 1 | 6 | | | Q1,00 | PCWP | | | 12 | PX BLOCK ITERATOR | | 2000K| 11M| 420 (1)| 00:00:01 | Q1,00 | PCWC | | | 13 | TABLE ACCESS FULL | T2 | 2000K| 11M| 420 (1)| 00:00:01 | Q1,00 | PCWP | | | 14 | SORT AGGREGATE | | 1 | 6 | | | | | | | 15 | PX COORDINATOR | | | | | | | | | | 16 | PX SEND QC (RANDOM) | :TQ20000 | 1 | 6 | | | Q2,00 | P->S | QC (RAND) | | 17 | SORT AGGREGATE | | 1 | 6 | | | Q2,00 | PCWP | | | 18 | PX BLOCK ITERATOR | | 2000K| 11M| 420 (1)| 00:00:01 | Q2,00 | PCWC | | | 19 | TABLE ACCESS FULL | T3 | 2000K| 11M| 420 (1)| 00:00:01 | Q2,00 | PCWP | | ----------------------------------------------------------------------------------------------------------------------------- 23
  17. Concurrent DFO trees T1: DFOt #1 start T2: DFOt #2

    start T2: DFOt #2 end T3: DFOt #3 start T4: DFOt #3 end 2 PX slaves 2 PX slaves 6 PX slaves concurrently active 8 PX servers reported as allocated 2 PX slaves released Observed pre-12.2 behavior T1: DFOt #1 end 2 PX slaves released 4 PX slaves 4 PX slaves released 24
  18. Concurrent DFO trees T2: DFOt #2 start T2: DFOt #2

    end T3: DFOt #3 start T3: DFOt #3 end 2 PX slaves 2 PX slaves reused 4 PX slaves concurrently active 4 PX slaves reported as allocated 2 PX slaves released Observed 12.2 behavior T0: DFOt #1 end 2 PX slaves released 4 PX slaves released T0: DFOt #1 start 4 PX slaves 25
  19. Ways to enable parallel execution • Parallel degree on object

    level ALTER TABLE ... PARALLEL • Parallel degree with DDL CREATE TABLE ... PARALLEL [n] CREATE TABLE ... PARALLEL [n] AS SELECT ... FROM ... • Enable parallel query, DML and DDL at session level ALTER SESSION FORCE PARALLEL (QUERY|DML|DDL) [PARALLEL n] ALTER SESSION [ENABLE|DISABLE] PARALLEL DML ALTER SESSION [ENABLE|DISABLE] PARALLEL DDL 27
  20. Ways to enable parallel execution … continued • Hints SELECT

    /*+ PARALLEL(n) */ ... FROM ... WHERE ... • Auto DoP • The optimizer determines the needed DoP Demo: Reading execution plans for PDML. Note: In 12c, DBMS_XPLAN notes if PDML is enabled or disabled for the current session. 28
  21. Why PDML is not enabled by default ? Some restrictions

    exist (not all listed) • PDML is not supported on tables with triggers • PDML is not supported for some RI constraints (self-referential, delete cascade and deferred constraints) • Data is not accessible until commit or rollback • Cluster tables are not supported • Distributed transactions are not supported • PDML is not supported on tables with bitmap indexes or LOB columns if the table is not partitioned 29
  22. SELECT TABLE_NAME, DEGREE FROM DBA_TABLES WHERE TABLE_NAME LIKE 'T%' ...

    TABLE_NAME DEGREE ---------- ---------- T1 1 T2 DEFAULT T3 4 CREATE TABLE T1(owner) PARALLEL DEGREE 8; CREATE TABLE T1(owner) PARALLEL; ALTER TABLE T1 PARALLEL DEGREE 4; CREATE INDEX IX1 ON T1(owner) PARALLEL 4; ALTER INDEX IX1 PARALLEL 2; Identify defined parallel degree • Determine parallel degree from DBA_INDEXES or DBA_TABLES 30
  23. Parallel degree - object level vs. statement level • Statement

    level degree has precedence over object level degree • Statement level is controlled with query hints • Object level parallel degree definition does not support hints Demo: Object level defined DoP behavior 31
  24. V$PQ_TQSTAT • Serve as communication containers between parallel execution servers

    • Contains session-level information for parallel execution Some important columns: DFO_NUMBER – data flow tree TQ_ID – table queue SERVER_TYPE – producer, consumer, QC or ranger NUM_ROWS – number of rows processed BYTES – total bytes processed 32
  25. V$PQ_TQSTAT … continued break on dfo_number on tq_id on server_type

    skip 1 on instance select instance ,dfo_number ,tq_id ,server_type ,process ,num_rows ,round(ratio_to_report(num_rows) over (partition by dfo_number, tq_id, server_type) * 100) as pct” , round(bytes/power(1024,2)) as mb from v$pq_tqstat order by instance, dfo_number, tq_id, server_type desc, process 33
  26. V$PQ_SESSTAT Session statistics for parallel queries STATISTIC LAST_QUERY SESSION_TOTAL -------------------------

    ---------- ------------- Queries Parallelized 1 3 DML Parallelized 0 0 DDL Parallelized 0 0 DFO Trees 1 4 Server Threads 2 0 Allocation Height 2 0 Allocation Width 1 0 Local Msgs Sent 40 106 Distr Msgs Sent 0 0 Local Msgs Recv'd 38 100 Distr Msgs Recv'd 0 0 DOP 2 0 Slave Sets 1 0 • Aggregated session level statistics • In12.2 “Server Threads” statistic reports real number of PX servers used with multiple DFO trees SELECT STATISTIC, LAST_QUERY, SESSION_TOTAL FROM V$PQ_SESSTAT 34
  27. How to determine DoP for current or past executions •

    Your own session’s DoP can be determined by looking at V$PQ_TQSTAT and V$PQ_SESSTAT. But, those views are not relevant for other sessions. • Views: V$PX_SESSION, V$PX_PROCESS, V$TRANSACTION • SQL Monitor • Look at PX_FLAGS column in [G]V$ACTIVE_SESSION_HISTORY Get query’s actual DoP with TRUNC(PX_FLAGS/2097152) 35
  28. V$PX_SESSION • Contains information about current running sessions in parallel

    • Sessions are easily identified with SADDR, SID and SERIAL# columns • DoP downgrades can be identified by looking at DEGREE and REQ_DEGREE columns • In RAC you can identify from which instance the QC is running • Identify how many PX servers run concurrently in case of multiple parallelizers 36
  29. V$PX_PROCESS • Shows pre-allocated PX servers • Processes can be

    AVAILABLE or IN USE, the STATUS column • Operating system process ID can be identified from SPID column • Starting 12c, an indicator IS_GV has been added to easily identify if the PX process is a normal one or a GV$ process • Selects on GV$ views use PX processes named PZ9n across nodes 37
  30. V$TRANSACTION • Provides information about active transactions • Parallel execution

    related columns: PTX_XIDUSN, PTX_XIDSLT, PTX_XIDSQN • Self-join V$TRANSACTION to identify PX processes specific per transaction Demo: Using V$TRANSACTION to map PX servers transaction to QC transaction. 38
  31. • HASH (HYBRID HASH 12c): Hash function is applied on

    the join key. - Improvement in 12c • BROADCAST: Used when one table is significantly smaller compared to other table. - Algorithm change in 12c • RANGE: Used when statement contains ORDER BY. Rows are distributed by ranges on the sort key. - Ranging is managed by QC at query runtime • ROUND - ROBIN: Randomly distributes rows to query servers. • QC (RANDOM): Rows are randomly sent to QC. Used when statement does not have ORDER BY. • QC (ORDER): Rows are sent to QC in order. Used when statement contains ORDER BY. Distribution methods 40
  32. Broadcast distribution Consumer PX slave 1 Consumer PX slave 2

    Table rows Producer PX slave 1 Producer PX slave 2 41
  33. Broadcast distribution Consumer PX slave 1 Consumer PX slave 2

    Table rows Producer PX slave 1 Producer PX slave 2 42
  34. Broadcast distribution method • Most effective when one of the

    result sets is much smaller than the other • Data is duplicated to all PX consumer servers • Larger results set doesn’t have to be re-distributed • Statistics are very important to CBO to pick effective distribution 43
  35. Broadcast distribution method -------------------------------------------------------------------------------------------------------------------- | Id | Operation | Name

    | Rows | Bytes | Cost (%CPU)| Time | TQ |IN-OUT| PQ Distrib | -------------------------------------------------------------------------------------------------------------------- | 0 | SELECT STATEMENT | | 1 | 2014 | 450 (1)| 00:00:01 | | | | |* 1 | COUNT STOPKEY | | | | | | | | | | 2 | PX COORDINATOR | | | | | | | | | | 3 | PX SEND QC (RANDOM) | :TQ10001 | 1000K| 1920M| 450 (1)| 00:00:01 | Q1,01 | P->S | QC (RAND) | |* 4 | COUNT STOPKEY | | | | | | Q1,01 | PCWC | | | 5 | VIEW | | 1000K| 1920M| 450 (1)| 00:00:01 | Q1,01 | PCWP | | |* 6 | HASH JOIN | | 1000K| 49M| 450 (1)| 00:00:01 | Q1,01 | PCWP | | | 7 | PX RECEIVE | | 1000K| 24M| 208 (1)| 00:00:01 | Q1,01 | PCWP | | | 8 | PX SEND BROADCAST | :TQ10000 | 1000K| 24M| 208 (1)| 00:00:01 | Q1,00 | P->P | BROADCAST | | 9 | PX BLOCK ITERATOR | | 1000K| 24M| 208 (1)| 00:00:01 | Q1,00 | PCWC | | | 10 | TABLE ACCESS FULL| T1 | 1000K| 24M| 208 (1)| 00:00:01 | Q1,00 | PCWP | | | 11 | PX BLOCK ITERATOR | | 1000K| 24M| 241 (1)| 00:00:01 | Q1,01 | PCWC | | | 12 | TABLE ACCESS FULL | T2 | 1000K| 24M| 241 (1)| 00:00:01 | Q1,01 | PCWP | | -------------------------------------------------------------------------------------------------------------------- 44
  36. Broadcast distribution method … continued -------------------------------------------------------------------------------------------------------------------- | Id | Operation

    | Name | Rows | Bytes | Cost (%CPU)| Time | TQ |IN-OUT| PQ Distrib | -------------------------------------------------------------------------------------------------------------------- | 0 | SELECT STATEMENT | | 1 | 2014 | 450 (1)| 00:00:01 | | | | |* 1 | COUNT STOPKEY | | | | | | | | | | 2 | PX COORDINATOR | | | | | | | | | | 3 | PX SEND QC (RANDOM) | :TQ10001 | 1000K| 1920M| 450 (1)| 00:00:01 | Q1,01 | P->S | QC (RAND) | |* 4 | COUNT STOPKEY | | | | | | Q1,01 | PCWC | | | 5 | VIEW | | 1000K| 1920M| 450 (1)| 00:00:01 | Q1,01 | PCWP | | |* 6 | HASH JOIN | | 1000K| 49M| 450 (1)| 00:00:01 | Q1,01 | PCWP | | | 7 | PX RECEIVE | | 1000K| 24M| 208 (1)| 00:00:01 | Q1,01 | PCWP | | | 8 | PX SEND BROADCAST | :TQ10000 | 1000K| 24M| 208 (1)| 00:00:01 | Q1,00 | P->P | BROADCAST | | 9 | PX BLOCK ITERATOR | | 1000K| 24M| 208 (1)| 00:00:01 | Q1,00 | PCWC | | | 10 | TABLE ACCESS FULL| T1 | 1000K| 24M| 208 (1)| 00:00:01 | Q1,00 | PCWP | | | 11 | PX BLOCK ITERATOR | | 1000K| 24M| 241 (1)| 00:00:01 | Q1,01 | PCWC | | | 12 | TABLE ACCESS FULL | T2 | 1000K| 24M| 241 (1)| 00:00:01 | Q1,01 | PCWP | | -------------------------------------------------------------------------------------------------------------------- 45
  37. Broadcast improvements in 12c • One virtual table • One

    set of parallel query slaves • Inter-process communication is eliminated • Cost-based decision • Outer source is fully read by each PX server 46
  38. Broadcast improvements in 12c --------------------------------------------------------------------------------------------------------------- | Id | Operation |

    Name | Rows | Bytes | Cost (%CPU)| Time | TQ |IN-OUT| PQ Distrib | --------------------------------------------------------------------------------------------------------------- | 0 | SELECT STATEMENT | | 1000K| 49M| 450 (1)| 00:00:01 | | | | | 1 | PX COORDINATOR | | | | | | | | | | 2 | PX SEND QC (RANDOM) | :TQ10000 | 1000K| 49M| 450 (1)| 00:00:01 | Q1,00 | P->S | QC (RAND) | |* 3 | HASH JOIN | | 1000K| 49M| 450 (1)| 00:00:01 | Q1,00 | PCWP | | | 4 | TABLE ACCESS FULL | T1 | 1000K| 24M| 208 (1)| 00:00:01 | Q1,00 | PCWP | | | 5 | PX BLOCK ITERATOR | | 1000K| 24M| 241 (1)| 00:00:01 | Q1,00 | PCWC | | | 6 | TABLE ACCESS FULL| T2 | 1000K| 24M| 241 (1)| 00:00:01 | Q1,00 | PCWP | | --------------------------------------------------------------------------------------------------------------- 47
  39. 2 Range distribution Consumer PX slave 1 Consumer PX slave

    2 Table rows Producer PX slave 1 Producer PX slave 2 2 1 9 8 5 7 1 8 4 4 7 6 2 1 9 8 5 7 1 8 4 4 7 6 48
  40. 2 Range distribution Consumer PX slave 1 Consumer PX slave

    2 Table rows Producer PX slave 1 Producer PX slave 2 2 1 9 8 5 7 1 8 4 4 7 6 2 1 9 8 5 7 1 8 4 4 7 6 2 1 1 8 4 9 8 4 5 7 7 6 8 4 5 7 7 6 2 1 1 8 4 9 49
  41. Range distribution method --------------------------------------------------------------------------------------------------------------- | Id | Operation | Name

    | Rows | Bytes |TempSpc| Cost (%CPU)| TQ |IN-OUT| PQ Distrib | --------------------------------------------------------------------------------------------------------------- | 0 | SELECT STATEMENT | | 212K| 10M| | 197K (1)| | | | | 1 | PX COORDINATOR | | | | | | | | | | 2 | PX SEND QC (ORDER) | :TQ10001 | 212K| 10M| | 197K (1)| Q1,01 | P->S | QC (ORDER) | | 3 | SORT ORDER BY | | 212K| 10M| 13M| 197K (1)| Q1,01 | PCWP | | | 4 | PX RECEIVE | | 212K| 10M| | 197K (1)| Q1,01 | PCWP | | | 5 | PX SEND RANGE | :TQ10000 | 212K| 10M| | 197K (1)| Q1,00 | P->P | RANGE | |* 6 | HASH JOIN | | 212K| 10M| | 197K (1)| Q1,00 | PCWP | | |* 7 | TABLE ACCESS FULL | PRODUCTS | 1 | 30 | | 2 (0)| Q1,00 | PCWP | | | 8 | PX BLOCK ITERATOR | | 28M| 573M| | 197K (1)| Q1,00 | PCWC | | |* 9 | TABLE ACCESS FULL| SALES | 28M| 573M| | 197K (1)| Q1,00 | PCWP | | --------------------------------------------------------------------------------------------------------------- 50
  42. Range distribution method View: V$PQ_TQSTAT DFO_NUMBER TQ_ID SERVER_TYP INSTANCE PROCESS

    NUM_ROWS % ---------- ---------- ---------- ---------- -------- ---------- ---------- 1 0 Ranger 1 QC 182 100 Producer 1 P002 105046 50 P003 104639 50 Consumer 1 P000 95126 45 P001 114559 55 1 Producer 1 P000 95126 45 P001 114559 55 Consumer 1 QC 209685 100 51
  43. Table rows Consumer PX slave 1 Consumer PX slave 2

    Hash distribution Producer PX slave 1 Producer PX slave 2 HASH FUNCTION 52
  44. Table rows Consumer PX slave 1 Consumer PX slave 2

    Hash distribution Producer PX slave 1 Producer PX slave 2 HASH FUNCTION 53
  45. Hash distribution … continued ------------------------------------------------------------------------------------------------------------------- | Id | Operation |

    Name | Rows | Bytes | Cost (%CPU)| Time | TQ |IN-OUT| PQ Distrib | ------------------------------------------------------------------------------------------------------------------- | 0 | SELECT STATEMENT | | 1 | 8 | 1475 (1)| 00:00:01 | | | | | 1 | SORT AGGREGATE | | 1 | 8 | | | | | | | 2 | PX COORDINATOR | | | | | | | | | | 3 | PX SEND QC (RANDOM) | :TQ10002 | 1 | 8 | | | Q1,02 | P->S | QC (RAND) | | 4 | SORT AGGREGATE | | 1 | 8 | | | Q1,02 | PCWP | | |* 5 | HASH JOIN | | 100K| 781K| 1475 (1)| 00:00:01 | Q1,02 | PCWP | | | 6 | PX RECEIVE | | 100K| 292K| 2 (0)| 00:00:01 | Q1,02 | PCWP | | | 7 | PX SEND HASH | :TQ10000 | 100K| 292K| 2 (0)| 00:00:01 | Q1,00 | P->P | HASH | | 8 | PX BLOCK ITERATOR | | 100K| 292K| 2 (0)| 00:00:01 | Q1,00 | PCWC | | | 9 | TABLE ACCESS FULL| T1 | 100K| 292K| 2 (0)| 00:00:01 | Q1,00 | PCWP | | | 10 | PX RECEIVE | | 1000K| 4882K| 1471 (1)| 00:00:01 | Q1,02 | PCWP | | | 11 | PX SEND HASH | :TQ10001 | 1000K| 4882K| 1471 (1)| 00:00:01 | Q1,01 | P->P | HASH | | 12 | PX BLOCK ITERATOR | | 1000K| 4882K| 1471 (1)| 00:00:01 | Q1,01 | PCWC | | | 13 | TABLE ACCESS FULL| T2 | 1000K| 4882K| 1471 (1)| 00:00:01 | Q1,01 | PCWP | | ------------------------------------------------------------------------------------------------------------------- 54
  46. Hash distribution … continued ------------------------------------------------------------------------------------------------------------------- | Id | Operation |

    Name | Rows | Bytes | Cost (%CPU)| Time | TQ |IN-OUT| PQ Distrib | ------------------------------------------------------------------------------------------------------------------- | 0 | SELECT STATEMENT | | 1 | 8 | 1475 (1)| 00:00:01 | | | | | 1 | SORT AGGREGATE | | 1 | 8 | | | | | | | 2 | PX COORDINATOR | | | | | | | | | | 3 | PX SEND QC (RANDOM) | :TQ10002 | 1 | 8 | | | Q1,02 | P->S | QC (RAND) | | 4 | SORT AGGREGATE | | 1 | 8 | | | Q1,02 | PCWP | | |* 5 | HASH JOIN | | 100K| 781K| 1475 (1)| 00:00:01 | Q1,02 | PCWP | | | 6 | PX RECEIVE | | 100K| 292K| 2 (0)| 00:00:01 | Q1,02 | PCWP | | | 7 | PX SEND HASH | :TQ10000 | 100K| 292K| 2 (0)| 00:00:01 | Q1,00 | P->P | HASH | | 8 | PX BLOCK ITERATOR | | 100K| 292K| 2 (0)| 00:00:01 | Q1,00 | PCWC | | | 9 | TABLE ACCESS FULL| T1 | 100K| 292K| 2 (0)| 00:00:01 | Q1,00 | PCWP | | | 10 | PX RECEIVE | | 1000K| 4882K| 1471 (1)| 00:00:01 | Q1,02 | PCWP | | | 11 | PX SEND HASH | :TQ10001 | 1000K| 4882K| 1471 (1)| 00:00:01 | Q1,01 | P->P | HASH | | 12 | PX BLOCK ITERATOR | | 1000K| 4882K| 1471 (1)| 00:00:01 | Q1,01 | PCWC | | | 13 | TABLE ACCESS FULL| T2 | 1000K| 4882K| 1471 (1)| 00:00:01 | Q1,01 | PCWP | | ------------------------------------------------------------------------------------------------------------------- 55
  47. Hash distribution … continued ------------------------------------------------------------------------------------------------------------------- | Id | Operation |

    Name | Rows | Bytes | Cost (%CPU)| Time | TQ |IN-OUT| PQ Distrib | ------------------------------------------------------------------------------------------------------------------- | 0 | SELECT STATEMENT | | 1 | 8 | 1475 (1)| 00:00:01 | | | | | 1 | SORT AGGREGATE | | 1 | 8 | | | | | | | 2 | PX COORDINATOR | | | | | | | | | | 3 | PX SEND QC (RANDOM) | :TQ10002 | 1 | 8 | | | Q1,02 | P->S | QC (RAND) | | 4 | SORT AGGREGATE | | 1 | 8 | | | Q1,02 | PCWP | | |* 5 | HASH JOIN | | 100K| 781K| 1475 (1)| 00:00:01 | Q1,02 | PCWP | | | 6 | PX RECEIVE | | 100K| 292K| 2 (0)| 00:00:01 | Q1,02 | PCWP | | | 7 | PX SEND HASH | :TQ10000 | 100K| 292K| 2 (0)| 00:00:01 | Q1,00 | P->P | HASH | | 8 | PX BLOCK ITERATOR | | 100K| 292K| 2 (0)| 00:00:01 | Q1,00 | PCWC | | | 9 | TABLE ACCESS FULL| T1 | 100K| 292K| 2 (0)| 00:00:01 | Q1,00 | PCWP | | | 10 | PX RECEIVE | | 1000K| 4882K| 1471 (1)| 00:00:01 | Q1,02 | PCWP | | | 11 | PX SEND HASH | :TQ10001 | 1000K| 4882K| 1471 (1)| 00:00:01 | Q1,01 | P->P | HASH | | 12 | PX BLOCK ITERATOR | | 1000K| 4882K| 1471 (1)| 00:00:01 | Q1,01 | PCWC | | | 13 | TABLE ACCESS FULL| T2 | 1000K| 4882K| 1471 (1)| 00:00:01 | Q1,01 | PCWP | | ------------------------------------------------------------------------------------------------------------------- 56
  48. HASH distribution method and skew data Example: • Tables T1

    and T2 with 2M rows each • Table T2 has foreign key defined on T1_ID column referencing T1(ID) • In T2 table, ¾ of the rows for T1_ID column have duplicate value (skew data) Demo: Observation of PX slaves work performed on join with skew data. 57
  49. HASH distribution method and skew data ... continued select /*+

    parallel(4) */ t1.col2, t2.col2 from t1, t2 where t1.id = t2.t1_id; 58
  50. HASH distribution method and skew data … continued ----------------------------------------------------------------------------------------------------------------- |

    Id | Operation | Name | Rows | Bytes | Cost (%CPU)| Time | TQ |IN-OUT| PQ Distrib | ----------------------------------------------------------------------------------------------------------------- | 0 | SELECT STATEMENT | | 250K| 12M| 484 (2)| 00:00:01 | | | | | 1 | PX COORDINATOR | | | | | | | | | | 2 | PX SEND QC (RANDOM) | :TQ10002 | 250K| 12M| 484 (2)| 00:00:01 | Q1,02 | P->S | QC (RAND) | |* 3 | HASH JOIN BUFFERED | | 250K| 12M| 484 (2)| 00:00:01 | Q1,02 | PCWP | | | 4 | PX RECEIVE | | 2000K| 49M| 421 (1)| 00:00:01 | Q1,02 | PCWP | | | 5 | PX SEND HASH | :TQ10000 | 2000K| 49M| 421 (1)| 00:00:01 | Q1,00 | P->P | HASH | | 6 | PX BLOCK ITERATOR | | 2000K| 49M| 421 (1)| 00:00:01 | Q1,00 | PCWC | | | 7 | TABLE ACCESS FULL| T1 | 2000K| 49M| 421 (1)| 00:00:01 | Q1,00 | PCWP | | | 8 | PX RECEIVE | | 250K| 6347K| 61 (2)| 00:00:01 | Q1,02 | PCWP | | | 9 | PX SEND HASH | :TQ10001 | 250K| 6347K| 61 (2)| 00:00:01 | Q1,01 | P->P | HASH | | 10 | PX BLOCK ITERATOR | | 250K| 6347K| 61 (2)| 00:00:01 | Q1,01 | PCWC | | | 11 | TABLE ACCESS FULL| T2 | 250K| 6347K| 61 (2)| 00:00:01 | Q1,01 | PCWP | | ----------------------------------------------------------------------------------------------------------------- 59
  51. HASH distribution method and skew data Uniform distribution for T1

    (session statistics) TQ_ID SERVER_TYP INSTANCE PROCESS NUM_ROWS PCT ---------- ---------- ---------- -------- ---------- ---------- 0 Producer 1 P004 500640 25 P005 498921 25 P006 463007 23 P007 537432 27 Consumer 1 P000 500363 25 P001 500256 25 P002 499609 25 P003 499772 25 60
  52. HASH distribution method and skew data Non-uniform distribution for T2

    (session statistics) TQ_ID SERVER_TYP INSTANCE PROCESS NUM_ROWS PCT ---------- ---------- ---------- -------- ---------- ---------- ... 1 Producer 1 P004 502266 25 P005 493795 25 P006 502313 25 P007 501626 25 Consumer 1 P000 62558 3 P001 62546 3 P002 62427 3 P003 1812469 91 61
  53. Hybrid hash Starting with 12c • Adapts the distribution method

    at runtime • If number of rows < DoP*2 the source is broadcast • Identified by PX SEND HYBRID HASH and STATISTICS COLLECTOR operations in the execution plan 62
  54. Hash distribution method and skew data View: V$PQ_TQSTAT TQ_ID SERVER_TYP

    INSTANCE PROCESS NUM_ROWS ---------- ---------- ---------- -------- ---------- 0 Producer 1 P004 501273 P005 461496 P006 535080 P007 502154 ---------- 2000003 Consumer 1 P000 499616 P001 500734 P002 499522 P003 500131 Popular value is BROADCAST to all consumer PX processes 63
  55. Hash distribution method and skew data … continued TQ_ID SERVER_TYP

    INSTANCE PROCESS NUM_ROWS ---------- ---------- ---------- -------- ---------- ... 1 Producer 1 P004 502266 P005 504034 P006 493762 P007 499938 Consumer 1 P000 499962 P001 499930 P002 499805 P003 500303 ROUND ROBIN / RANDOM Distribution for skew data rows 64
  56. Hash distribution method and skew data PARAMETER_NAME PARAMETER_DESC SESS SYS

    ------------------------ ----------------------------------------------------------- ------ ----- _px_join_skew_handling enables skew handling for parallel joins TRUE TRUE _px_join_skew_ratio sets skew ratio for parallel joins 10 10 _px_join_skew_minfreq sets minimum frequency(%) for skewed value for parallel joins 30 30 BEGIN DBMS_STATS.GATHER_TABLE_STATS(NULL,’T2' ,METHOD_OPT=>’FOR ALL COLUMNS SIZE 1 FOR COLUMNS SIZE 254 T1_ID' ,NO_INVALIDATE=>FALSE); END; / 65 Demo: Observation of hybrid hash and PX slave work performed on join with skew data.
  57. Bloom filters theory Probabilistic data structure • Named by Burton

    Howard Bloom, conceived in 1970 • Used to test whether an element is a member of a set • False positives are possible. False negatives are not possible • Composed of: • k – different hash functions (k1 , k2 ,k3 … km ) • Bit array of m – bits (b1 , b2 , b3 … bm ), initially all set to 0 66
  58. Bloom filters theory How does it work ? • An

    element (e) is sent to all k hash functions and retrieved array indexes are set to 1 Example: m = 10, k = 3, e = 10 h1(10) = i1 h1(10) = i4 h1(10) = i6 Bit array 0 1 0 0 1 0 1 0 0 0 i0 i1 i2 i3 i4 i5 i6 i7 i8 i9 e = 2, negative h1(2) = i3 h1(2) = i9 h1(2) = i6 e = 10, positive h1(10) = i1 h1(10) = i4 h1(10) = i6 e = 8, false positive h1(8) = i1 h1(8) = i4 h1(8) = i6 67
  59. Bloom filters • It reduces the overhead of data transfer

    between PX sets • The CBO decides whether it should use bloom filters • You can “control” bloom filter usage with a query hint: - PX_JOIN_FILTER - NO_PX_JOIN_FILTER • System or session wide control with "_bloom_filter_enabled” • Exadata smart-scan also benefits from bloom filters 68
  60. Bloom filters example ----------------------------------------------------------------------------------------------------- | Id | Operation | Name

    | Rows | Bytes | Cost (%CPU)| TQ |IN-OUT| PQ Distrib | ----------------------------------------------------------------------------------------------------- | 0 | SELECT STATEMENT | | 3143K| 152M| 197K (2)| | | | | 1 | PX COORDINATOR | | | | | | | | | 2 | PX SEND QC (RANDOM) | :TQ10000 | 3143K| 152M| 197K (2)| Q1,00 | P->S | QC (RAND) | |* 3 | HASH JOIN | | 3143K| 152M| 197K (2)| Q1,00 | PCWP | | | 4 | JOIN FILTER CREATE | :BF0000 | 1 | 30 | 2 (0)| Q1,00 | PCWP | | |* 5 | TABLE ACCESS FULL | PRODUCTS | 1 | 30 | 2 (0)| Q1,00 | PCWP | | | 6 | JOIN FILTER USE | :BF0000 | 424M| 8498M| 197K (1)| Q1,00 | PCWP | | | 7 | PX BLOCK ITERATOR | | 424M| 8498M| 197K (1)| Q1,00 | PCWC | | |* 8 | TABLE ACCESS FULL| SALES | 424M| 8498M| 197K (1)| Q1,00 | PCWP | | ----------------------------------------------------------------------------------------------------- 69
  61. 10 minutes break Next up: • Auto DoP • In-memory

    parallel execution • Blocking and non-blocking operations • Tracing parallel execution 70
  62. The problem with manual DoP • Limited resources • One

    size fits all does not work well • Critical statements may run serially due to not enough available PX servers • Manual tuning is needed to determine DoP • No way to increase DoP of running statements 72
  63. Auto DoP • Optimizer’s estimates decides whether SQL should run

    in parallel or serial mode • Doesn’t require object level settings nor hints • Object level DoP is ignored • Statements can be scheduled to run immediately or wait in queue • Controlled by: PARALLEL_DEGREE_POLICY = MANUAL | LIMITED | AUTO | ADAPTIVE PARALLEL_MIN_TIME_THRESHOLD = AUTO | integer 73
  64. Controlling Auto DoP • System wide • Initialization parameter: PARALLEL_DEGREE_LIMIT

    = CPU | IO | integer • Application/user • Resource manager directive: PARALLEL_DEGREE_LIMIT_P1 What is the maximum Auto DoP ? MIN (DEFAULT DOP , PARALLEL_DEGREE_LIMIT , DBRM DIRECTIVE PARALLEL_DEGREE_LIMIT_P1) 74
  65. Initialization parameters for parallel execution • Obsolete (removed) starting 12.2

    PARALLEL_SERVER PARALLEL_SERVER_INSTANCES PARALLEL_IO_CAP_ENABLED PARALLEL_AUTOMATIC_TUNING • Deprecated starting 12.2 PARALLEL_ADAPTIVE_MULTI_USER = FALSE 75
  66. Initialization parameters for parallel execution … continued PARALLEL_MAX_SERVERS PARALLEL_MIN_SERVERS 12c:

    CPU_COUNT * PARALLEL_THREADS_PER_CPU * 2 11g: 0 PARALLEL_DEGREE_POLICY PARALLEL_DEGREE_LIMIT PARALLEL_SERVERS_TARGET CPU count Queuing threshold Parallel max server GAP ? 76
  67. Do you mind the GAP ? • You may want

    some queries to skip the queue, hence “reserved” PX processes need to be available SELECT /*+ NO_STATEMENT_QUEUING */ ... FROM ... WHERE ALTER SESSION SET PARALLEL_DEGREE_POLICY = MANUAL|LIMITED DBMS_RESOURCE_MANAGER.CREATE_PLAN_DIRECTIVE( ... PARALLEL_STMT_CRITICAL => ‘BYPASS QUEUE’ ) 77
  68. PX slave allocation without statement queuing Requested DoP Time Status

    Execute DoP Free PX processes (PARALLEL_MAX_SERVERS = 64) Used PX processes 78
  69. PX slave allocation without statement queuing Free PX processes (PARALLEL_MAX_SERVERS

    = 64) Used PX processes Requested DoP Time Status Execute DoP 4 T1 ACTIVE 8 79
  70. PX slave allocation without statement queuing Free PX processes (PARALLEL_MAX_SERVERS

    = 64) Used PX processes Requested DoP Time Status Execute DoP 4 T1 ACTIVE 8 6 T2 ACTIVE 12 80
  71. PX slave allocation without statement queuing Free PX processes (PARALLEL_MAX_SERVERS

    = 64) Used PX processes Requested DoP Time Status Execute DoP 4 T1 ACTIVE 8 6 T2 ACTIVE 12 8 T3 ACTIVE 16 81
  72. PX slave allocation without statement queuing Free PX processes (PARALLEL_MAX_SERVERS

    = 64) Used PX processes Requested DoP Time Status Execute DoP 4 T1 ACTIVE 8 6 T2 ACTIVE 12 8 T3 ACTIVE 16 8 T4 ACTIVE 16 82
  73. PX slave allocation without statement queuing Free PX processes (PARALLEL_MAX_SERVERS

    = 64) Used PX processes Requested DoP Time Status Execute DoP 4 T1 ACTIVE 8 6 T2 ACTIVE 12 8 T3 ACTIVE 16 8 T4 ACTIVE 16 6 T5 ACTIVE 6 83
  74. PX slave allocation without statement queuing Requested DoP Time Status

    Execute DoP 4 T1 ACTIVE 8 6 T2 ACTIVE 12 8 T3 ACTIVE 16 8 T4 ACTIVE 16 6 T5 ACTIVE 6 6 T6 ACTIVE 1* Free PX processes (PARALLEL_MAX_SERVERS = 64) Used PX processes *Be aware of PARALLEL_MIN_PERCENT. If it’s set and minimum is not met, ORA-12827 will occur. 84
  75. Parallel execution statement queueing • Allows higher and consistent DoP

    to be used • Managed with PARALLEL_SERVERS_TARGET initialization parameter • It prevents statements to run serially. Solves “miss the boat” idiom. Statements can wait a little bit longer instead of running with downgraded degree of parallelism, possibly in serial • Without DBRM: one FIFO queue system-wide 85
  76. PX slave allocation with statement queuing Requested DoP Time Status

    Execute DoP Free PX processes (PARALLEL_MAX_SERVERS = 64) Used PX processes 86
  77. PX slave allocation with statement queuing Free PX processes (PARALLEL_MAX_SERVERS

    = 64) Used PX processes Requested DoP Time Status Execute DoP 4 T1 ACTIVE 8 87
  78. PX slave allocation with statement queuing Free PX processes (PARALLEL_MAX_SERVERS

    = 64) Used PX processes Requested DoP Time Status Execute DoP 4 T1 ACTIVE 8 6 T2 ACTIVE 12 88
  79. PX slave allocation with statement queuing Free PX processes (PARALLEL_MAX_SERVERS

    = 64) Used PX processes Requested DoP Time Status Execute DoP 4 T1 ACTIVE 8 6 T2 ACTIVE 12 8 T3 ACTIVE 16 89
  80. PX slave allocation with statement queuing Free PX processes (PARALLEL_MAX_SERVERS

    = 64) Used PX processes Requested DoP Time Status Execute DoP 4 T1 ACTIVE 8 6 T2 ACTIVE 12 8 T3 ACTIVE 16 8 T4 ACTIVE 16 90
  81. PX slave allocation with statement queuing Free PX processes (PARALLEL_MAX_SERVERS

    = 64) Used PX processes Requested DoP Time Status Execute DoP 4 T1 ACTIVE 8 6 T2 ACTIVE 12 8 T3 ACTIVE 16 8 T4 ACTIVE 16 6 T5 ACTIVE 6 91
  82. PX slave allocation with statement queuing Requested DoP Time Status

    Execute DoP 4 T1 ACTIVE 8 6 T2 ACTIVE 12 8 T3 ACTIVE 16 8 T4 ACTIVE 16 6 T5 ACTIVE 6 6 T6 QUEUED Free PX processes (PARALLEL_MAX_SERVERS = 64) Used PX processes 92
  83. PX slave allocation with statement queuing Requested DoP Time Status

    Execute DoP 4 T1 ACTIVE 8 6 T2 ACTIVE 12 8 T3 ACTIVE 16 8 T4 FINISHED 16 6 T5 ACTIVE 6 6 T6 QUEUED Free PX processes (PARALLEL_MAX_SERVERS = 64) Used PX processes 93
  84. PX slave allocation with statement queuing Requested DoP Time Status

    Execute DoP 4 T1 ACTIVE 8 6 T2 ACTIVE 12 8 T3 ACTIVE 16 8 T4 FINISHED 16 6 T5 ACTIVE 6 6 T6 ACTIVE 12 Free PX processes (PARALLEL_MAX_SERVERS = 64) Used PX processes 94
  85. Queuing for mixed workloads with DBRM • Use PARALLEL_SERVER_LIMIT directive

    to limit DoP per consumer group • Defined as a percentage of PARALLEL_SERVERS_TARGET • Use PARALLEL_QUEUE_TIMEOUT directive to define how long to wait on queue • Define priorities between consumer groups with MGMT_Pn, otherwise sessions are managed in FIFO queue • Even if some sessions might not be queued, their PX servers allocation counts towards PARALLEL_SERVER_LIMIT • In RAC environment use services mapped to consumer groups to split work between instances 95
  86. Parallel execution and the buffer cache • In general parallel

    execution bypass the buffer cache • Data goes through buffer cache when: • Objects size is < 2% of DB_CACHE_SIZE • Objects are marked with CACHE option • Full segment scans due to DML operations 97
  87. The problem with Cache Fusion • The data in each

    node’s buffer cache is shared between nodes via Cache Fusion. This can lead having whole copies of tables in each node’s buffer cache • The usable size of a buffer cache is the size of a single instance • Useful for small tables or dictionary metadata 98
  88. In-memory parallel execution In-memory vs. Cache Fusion • All RAC

    node’s buffer caches serve as one big virtual buffer cache • Block images are not transferred between nodes (Cache Fusion) • PX servers run locally on the same node and results are transferred to the node requester via interconnect • Controlled with PARALEL_DEGREE_POLICY = AUTO | ADAPTIVE • If the working set does not fit into buffer cache, direct path reads are used 99
  89. In-memory PX improvement Automatic big table caching available starting 12c

    • Small tables are still cached but not via automatic big table caching • Reserves percentage from the buffer cache for table scans • Temperature and object-based algorithms are used to track object usage • For RAC environments this works only for parallel queries • For single instance it works for serial and parallel queries • At database level or CDB level set: DB_BIG_TABLE_CACHE_PERCENT_TARGET 100
  90. Big table caching example ALTER SYSTEM SET DB_BIG_TABLE_CACHE_PERCENT_TARGET = 50;

    ALTER SYSTEM SET PARALLEL_DEGREE_POLICY = AUTO; NAME TYPE VALUE ---------------------------------- ----------- ------- db_big_table_cache_percent_target string 50 parallel_degree_policy string AUTO 101
  91. Big table caching example … continued SELECT BT_CACHE_TARGET, OBJECT_COUNT, MEMORY_BUF_ALLOC,

    MIN_CACHED_TEMP FROM V$BT_SCAN_CACHE BT_CACHE_TARGET OBJECT_COUNT MEMORY_BUF_ALLOC MIN_CACHED_TEMP --------------- ------------ ---------------- --------------- 50 1 90606 1000 102
  92. Big table caching example … continued select do.object_name, bto.dataobj#, bto.size_in_blks,

    bto.cached_in_mem, ... from V$BT_SCAN_OBJ_TEMPS bto, DBA_OBJECTS do where do.object_id = bto.dataobj# OBJECT_NAM DATAOBJ# SIZE_IN_BLKS CACHED_IN_MEM TABLE_SIZE_MB CACHED_MB ---------- ---------- ------------ ------------- ------------- --------- SALES 95198 284022 90606 2219 708 103
  93. In-memory parallel execution Big table caching SELECT /*+ PARALLEL(4) */

    COUNT(*) FROM SALES SIZE_IN_BLKS = 284022 = (284022*8)/1024 = 2219 MB CACHED_IN_MEM = 90606 = (90606*8)/1024 = 708 MB consistent gets 288668 consistent gets from cache 95252 consistent gets pin 95045 consistent gets pin (fastpath) 94308 consistent gets examination 207 consistent gets examination (fastpath) 205 consistent gets direct 193416 = (193416*8/1024) = 1511 MB 708 + 1511 = 2219 MB 104
  94. Blocking and non-blocking operations • Producer and consumer model limitations

    • If the data has to be processed by next (different) PX Slave set it has to be “parked” • True blocking operations • Artificial blocking operations - HASH JOIN BUFFERED 106
  95. True blocking operations :TQ10000 PX3 PX4 BUILD HASH TABLE PX1

    PX2 :TQ10001 PX3 PX4 SORT AGGREGATE PX3 PX4 PROBES PX3 PX4 :TQ10002 PX SEND HASH PX SEND HASH PX RECEIVE PX RECEIVE True blocking operation T1 T2 QC PX1 PX2 107
  96. True blocking operation ------------------------------------------------------------------------------------------------------------------- | Id | Operation | Name

    | Rows | Bytes | Cost (%CPU)| Time | TQ |IN-OUT| PQ Distrib | ------------------------------------------------------------------------------------------------------------------- | 0 | SELECT STATEMENT | | 1 | 52 | 901 (1)| 00:00:01 | | | | | 1 | SORT AGGREGATE | | 1 | 52 | | | | | | | 2 | PX COORDINATOR | | | | | | | | | | 3 | PX SEND QC (RANDOM) | :TQ10002 | 1 | 52 | | | Q1,02 | P->S | QC (RAND) | | 4 | SORT AGGREGATE | | 1 | 52 | | | Q1,02 | PCWP | | |* 5 | HASH JOIN | | 1000K| 49M| 901 (1)| 00:00:01 | Q1,02 | PCWP | | | 6 | PX RECEIVE | | 1000K| 24M| 416 (1)| 00:00:01 | Q1,02 | PCWP | | | 7 | PX SEND HASH | :TQ10000 | 1000K| 24M| 416 (1)| 00:00:01 | Q1,00 | P->P | HASH | | 8 | PX BLOCK ITERATOR | | 1000K| 24M| 416 (1)| 00:00:01 | Q1,00 | PCWC | | | 9 | TABLE ACCESS FULL| T1 | 1000K| 24M| 416 (1)| 00:00:01 | Q1,00 | PCWP | | | 10 | PX RECEIVE | | 1000K| 24M| 481 (1)| 00:00:01 | Q1,02 | PCWP | | | 11 | PX SEND HASH | :TQ10001 | 1000K| 24M| 481 (1)| 00:00:01 | Q1,01 | P->P | HASH | | 12 | PX BLOCK ITERATOR | | 1000K| 24M| 481 (1)| 00:00:01 | Q1,01 | PCWC | | | 13 | TABLE ACCESS FULL| T2 | 1000K| 24M| 481 (1)| 00:00:01 | Q1,01 | PCWP | | ------------------------------------------------------------------------------------------------------------------- 108
  97. Artificial blocking operations PX1 PX2 :TQ10000 PX3 PX4 BUILD HASH

    TABLE PX1 PX2 :TQ10001 PX3 PX4 BUFFERS MATCHED ROWS PX3 PX4 :TQ10002 PX SEND HASH PX SEND HASH PX RECEIVE PX RECEIVE Artificial blocking operation T1 T2 QC PX SEND QC (RAND) PX SEND 109
  98. Artificial blocking operation ----------------------------------------------------------------------------------------------------------------- | Id | Operation | Name

    | Rows | Bytes | Cost (%CPU)| Time | TQ |IN-OUT| PQ Distrib | ----------------------------------------------------------------------------------------------------------------- | 0 | SELECT STATEMENT | | 1000K| 49M| 901 (1)| 00:00:01 | | | | | 1 | PX COORDINATOR | | | | | | | | | | 2 | PX SEND QC (RANDOM) | :TQ10002 | 1000K| 49M| 901 (1)| 00:00:01 | Q1,02 | P->S | QC (RAND) | |* 3 | HASH JOIN BUFFERED | | 1000K| 49M| 901 (1)| 00:00:01 | Q1,02 | PCWP | | | 4 | PX RECEIVE | | 1000K| 24M| 416 (1)| 00:00:01 | Q1,02 | PCWP | | | 5 | PX SEND HASH | :TQ10000 | 1000K| 24M| 416 (1)| 00:00:01 | Q1,00 | P->P | HASH | | 6 | PX BLOCK ITERATOR | | 1000K| 24M| 416 (1)| 00:00:01 | Q1,00 | PCWC | | | 7 | TABLE ACCESS FULL| T1 | 1000K| 24M| 416 (1)| 00:00:01 | Q1,00 | PCWP | | | 8 | PX RECEIVE | | 1000K| 24M| 481 (1)| 00:00:01 | Q1,02 | PCWP | | | 9 | PX SEND HASH | :TQ10001 | 1000K| 24M| 481 (1)| 00:00:01 | Q1,01 | P->P | HASH | | 10 | PX BLOCK ITERATOR | | 1000K| 24M| 481 (1)| 00:00:01 | Q1,01 | PCWC | | | 11 | TABLE ACCESS FULL| T2 | 1000K| 24M| 481 (1)| 00:00:01 | Q1,01 | PCWP | | ----------------------------------------------------------------------------------------------------------------- 110
  99. The ”_px_trace” event • Keyword – based tracing, “_px_trace” •

    Event – based tracing is still possible, but not for all PX components • Getting event – based tracing with PX can be difficult. Multiple events needs to be set, plus multiple levels • MOS Note: 1097154.1 112
  100. The ”_px_trace” event • Three (3) components can be set:

    • Area • Verbosity • Timing • Format: alter session set "_px_trace"=[[Verbosity,]area],[[Verbosity,]area],..,[time] 113
  101. The ”_px_trace” event • Area • scheduling - ( equivalent

    to some of event 10384 and some of 10390) • execution - (equivalent to some of event 10390) • granule - (equivalent to some of event 10390 and some of 10391) • messaging - (equivalent to event 10392 and event 10393) • buffer - (equivalent to event 10399) • compilation - ( no equivalent event) • all - all of the above • none - none of the above. 114
  102. Example trace with ”_px_trace” event • Example trace: alter session

    set "_px_trace"="high","execution","medium","buffer","time"; • To get full trace: alter session set "_px_trace"="all"; 116
  103. Some (key) functions to look • kxfpiinfo – instance number

    / CPUs / parallel_max_servers • kkscscid_pdm_eval – check whether PDML is allowed • sessPdmlMode – check whether PDML is enabled in session • kxfrAllocSlaves(begin) – how many slaves are requested? • kxfrAllocSlaves(end) – will also show how PX slaves were actually allocated • kxfpAdaptDOP – adaptive DoP • DoP downgrade reason visible under qerpxSetupAndAllocSlaves() 117
  104. PX slaves downgrade reasons • 350 DoP downgrade due to

    adaptive DoP • 351 DoP downgrade due to resource manager max. DoP • 352 DoP downgrade due to insufficient number of processes • 353 DoP downgrade because slaves failed to join Demo: PX tracing to determine reason for DoP downgrade. 118
  105. Wrap-up Parallelism might be the cause of you performance problem

    when not applied properly Remember, • You must have a very large task • You must have enough resources • Focus on what gives you the most leverage 119