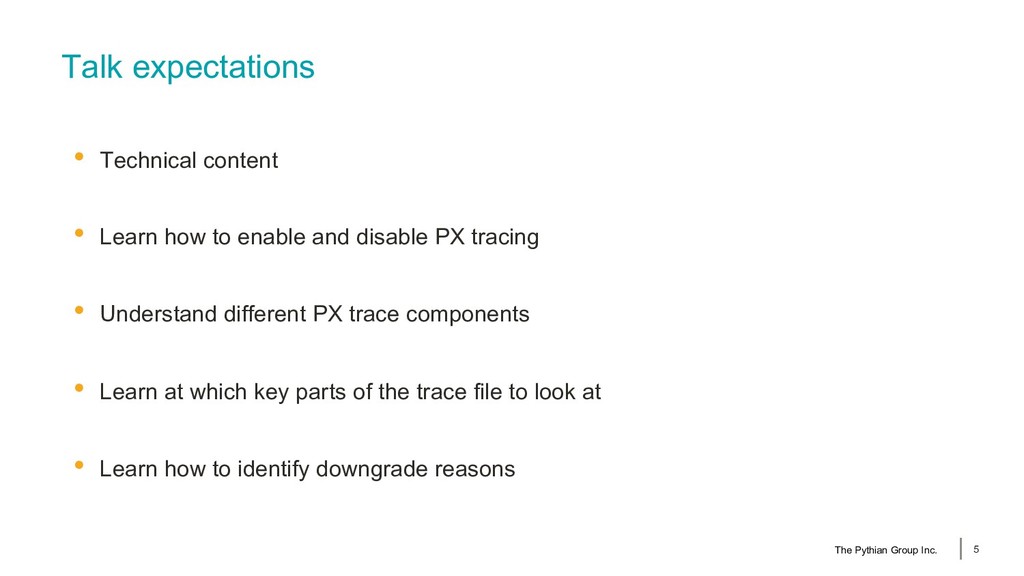
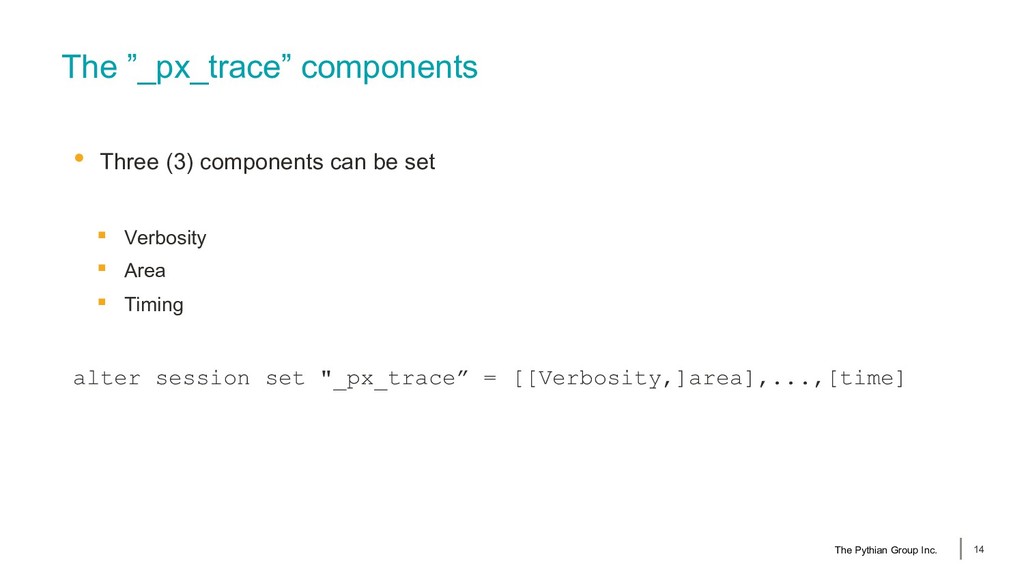
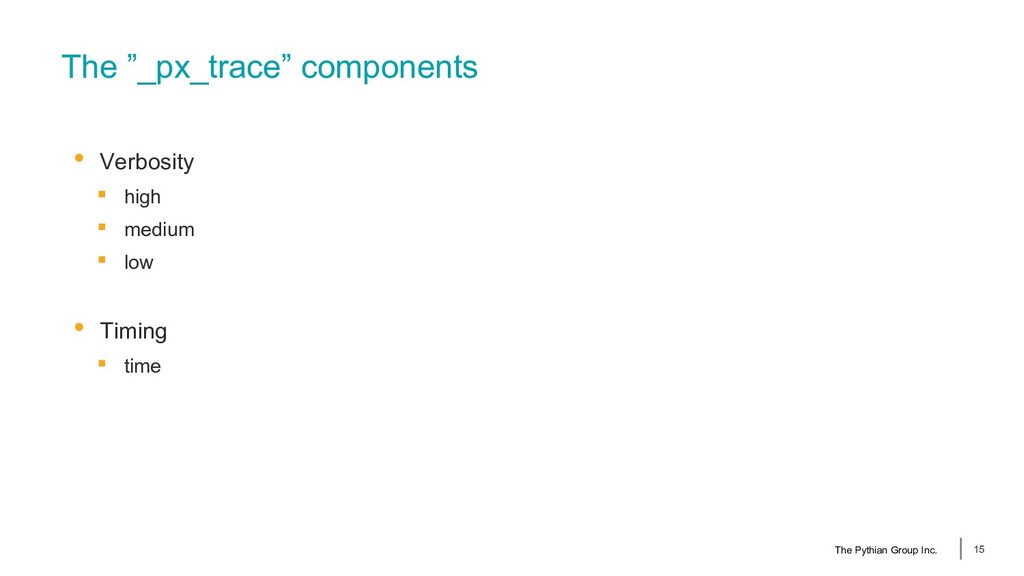
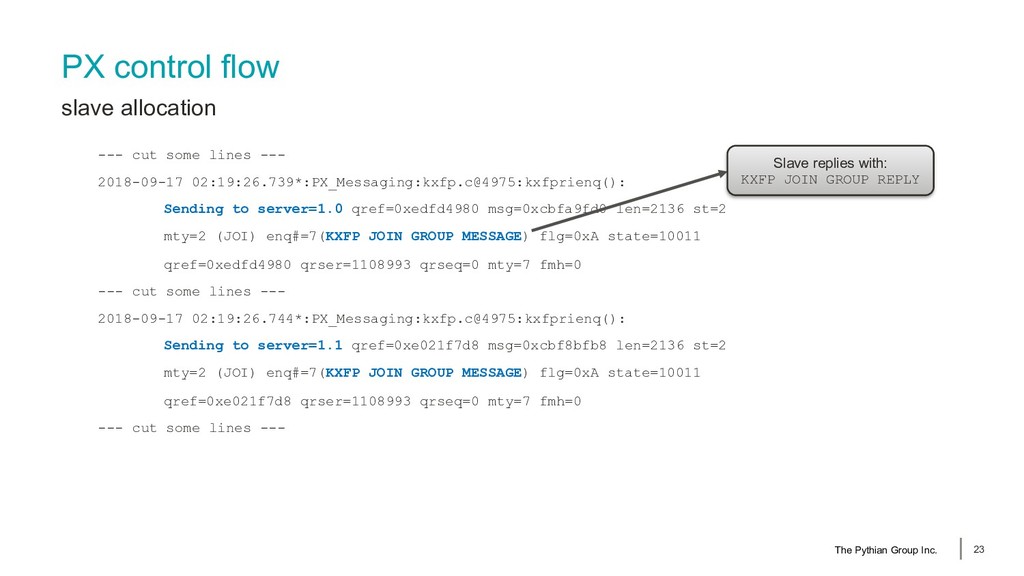
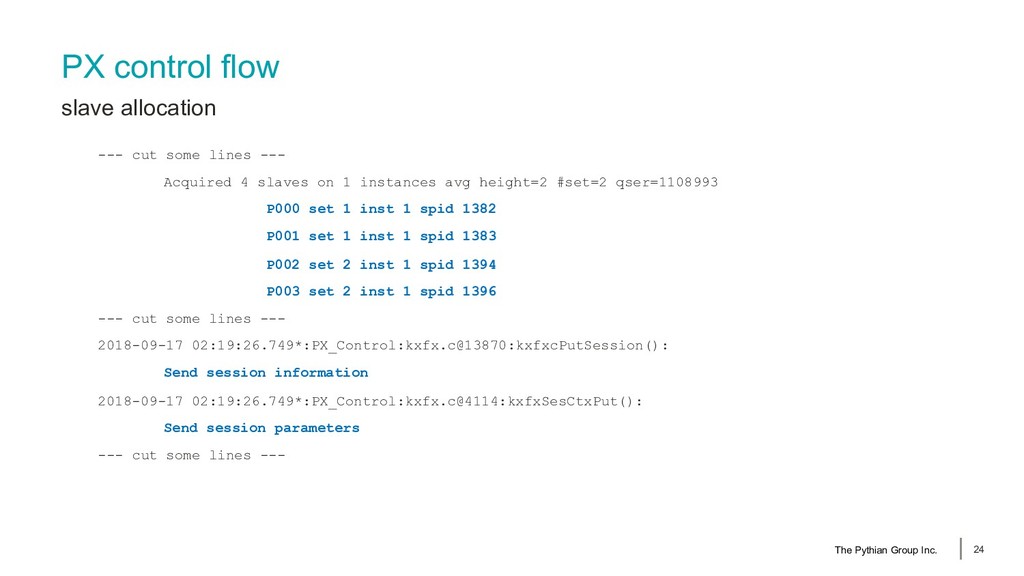
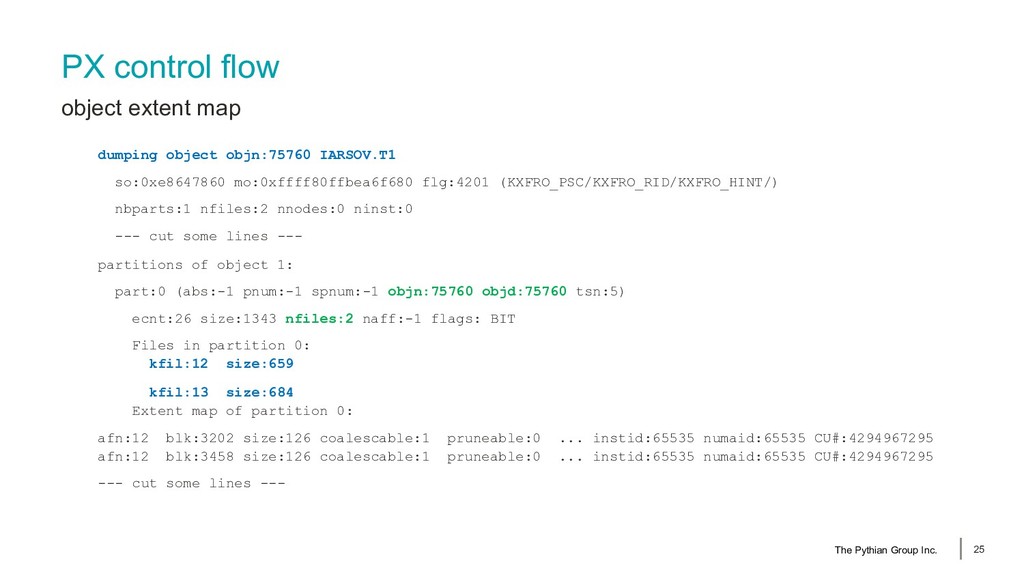
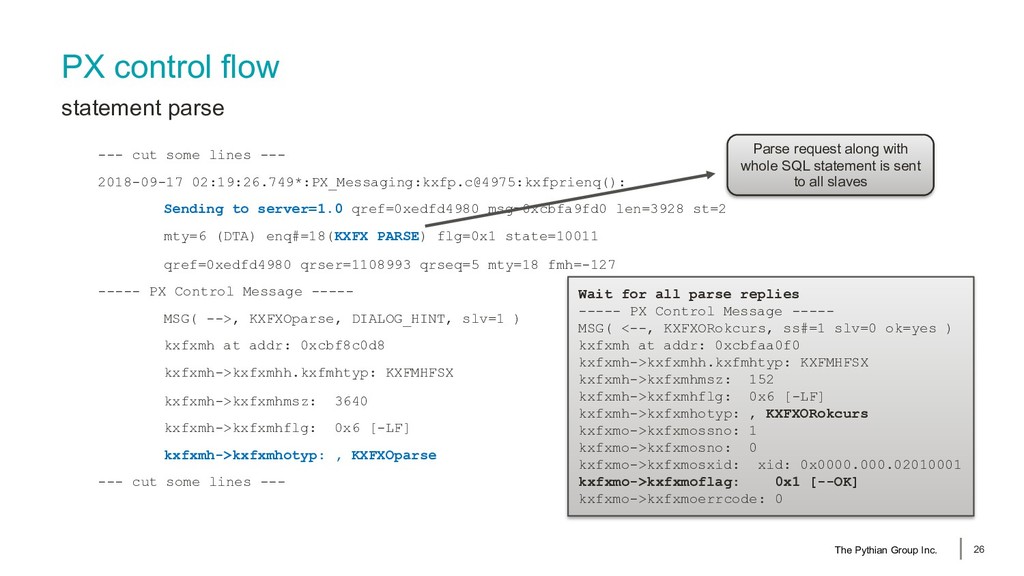
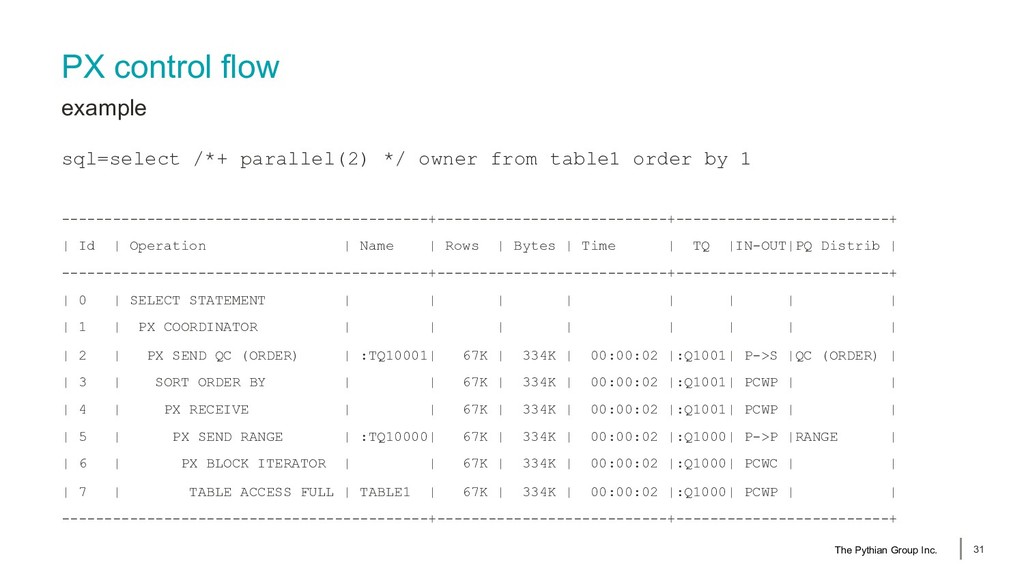
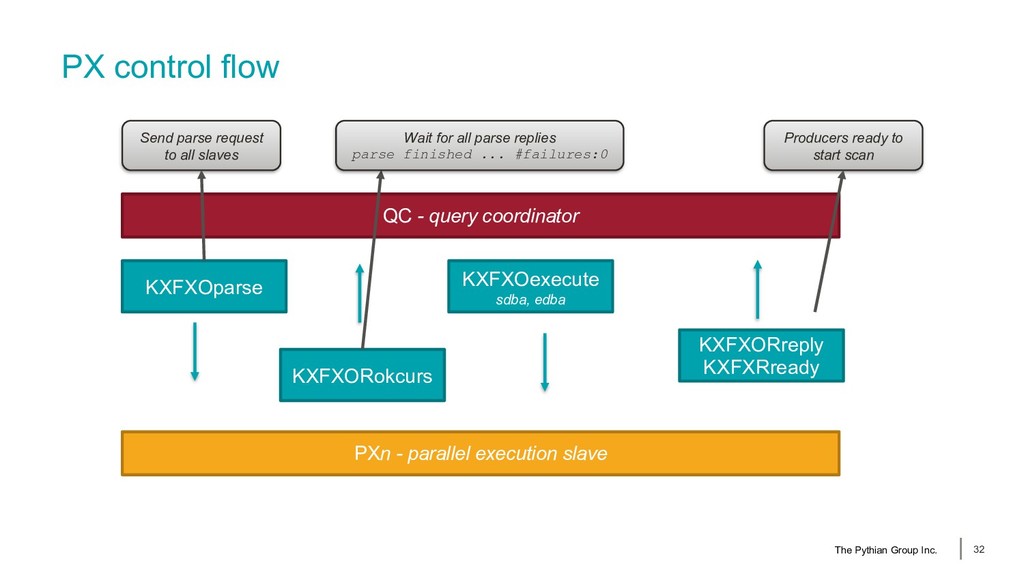
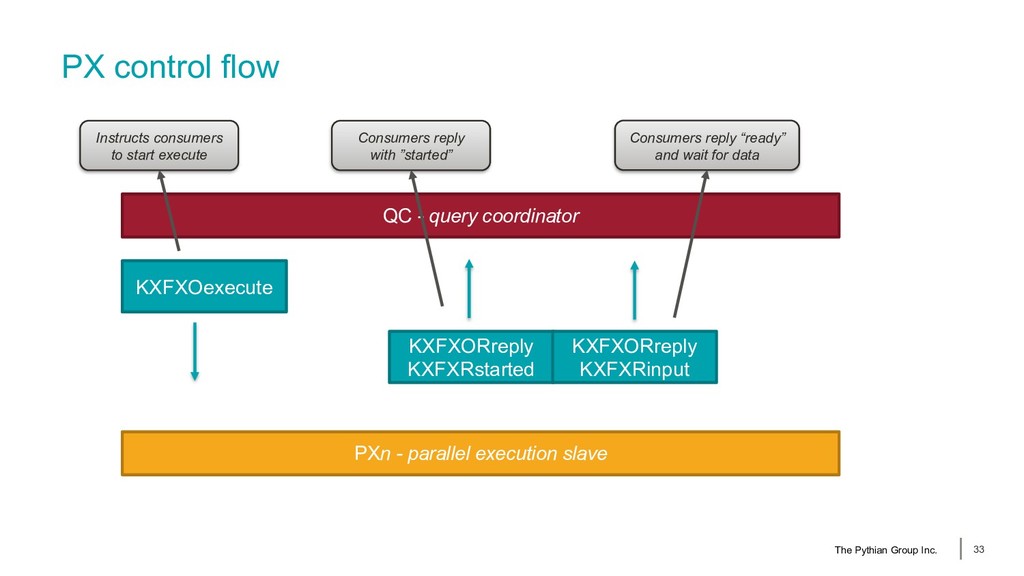
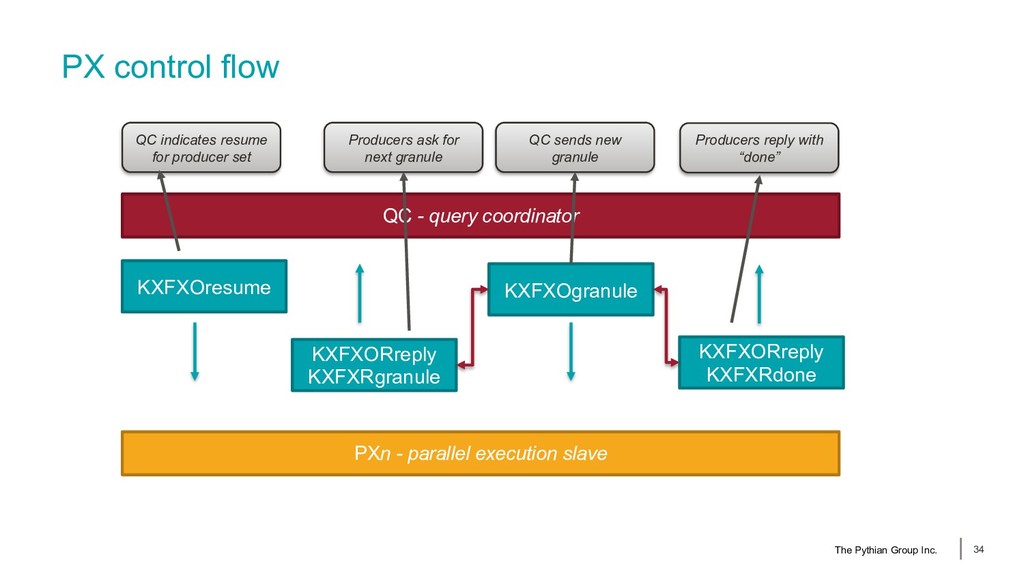
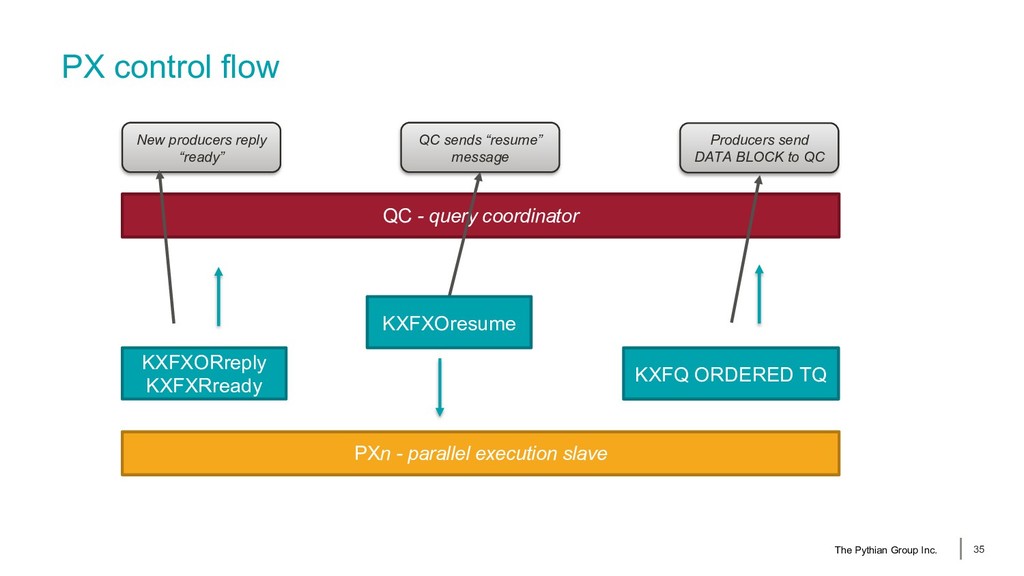
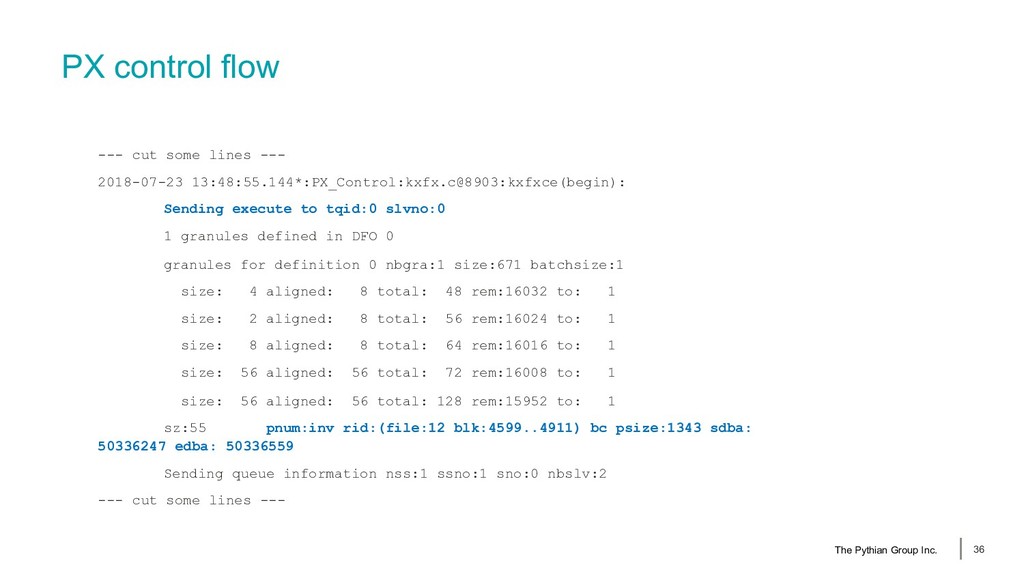
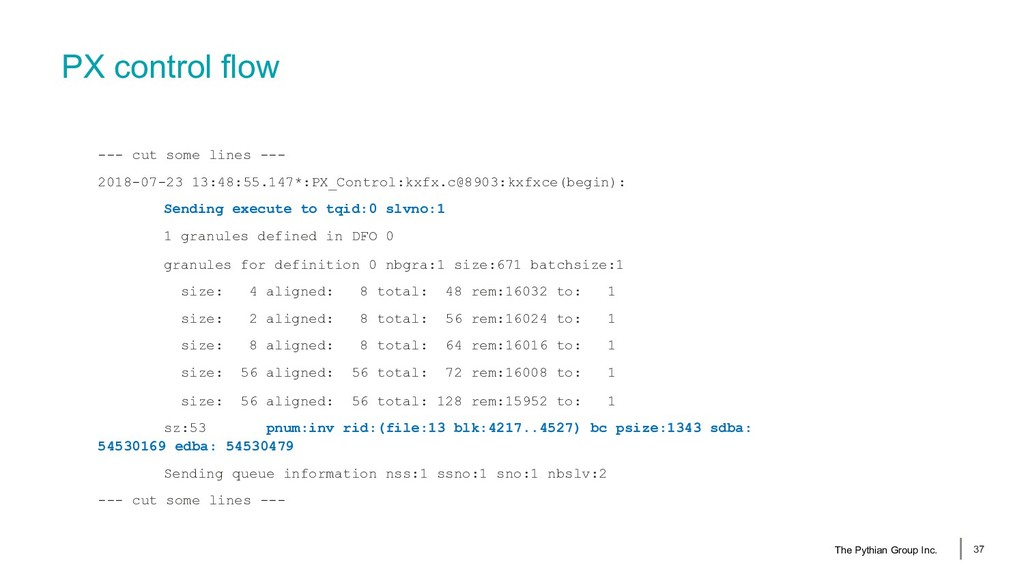
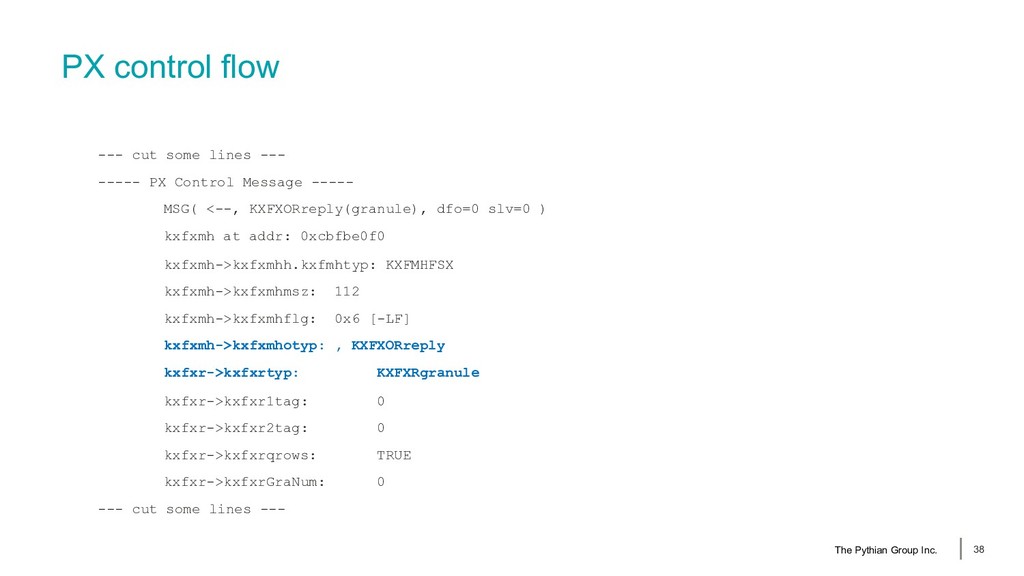
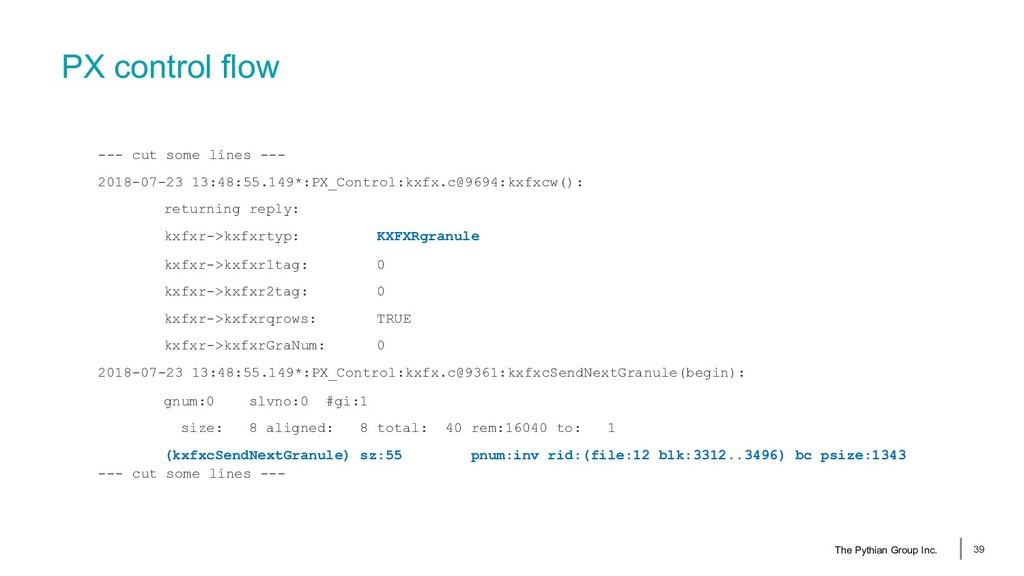
and disable PX tracing • Understand different PX trace components • Learn at which key parts of the trace file to look at • Learn how to identify downgrade reasons The Pythian Group Inc. 5
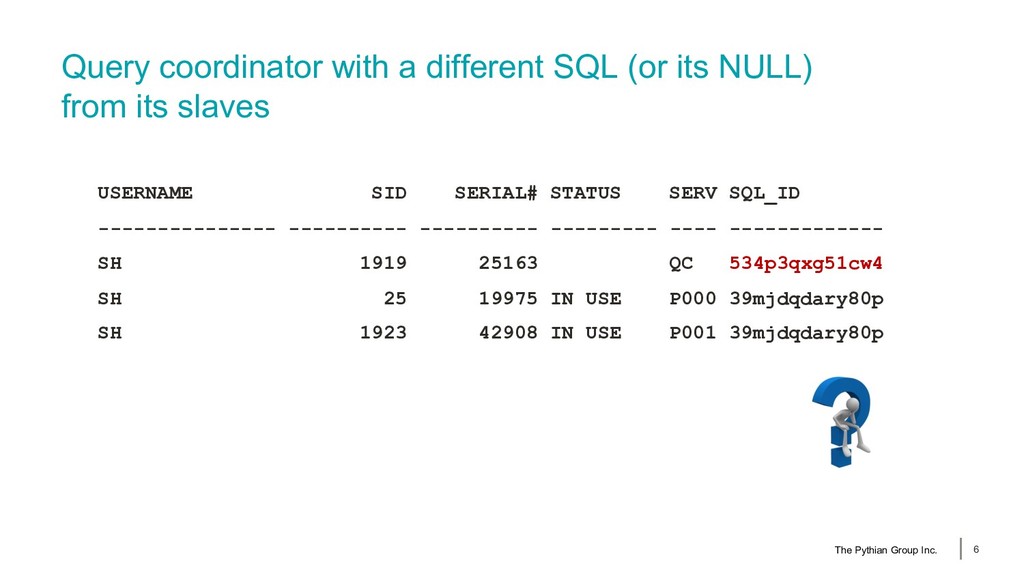
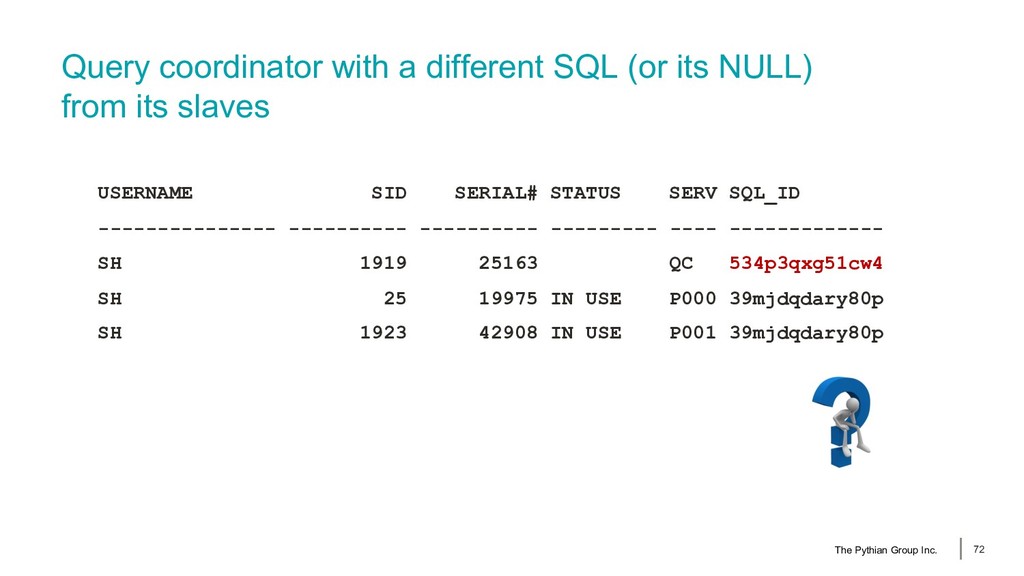
its slaves USERNAME SID SERIAL# STATUS SERV SQL_ID --------------- ---------- ---------- --------- ---- ------------- SH 1919 25163 QC 534p3qxg51cw4 SH 25 19975 IN USE P000 39mjdqdary80p SH 1923 42908 IN USE P001 39mjdqdary80p The Pythian Group Inc. 6
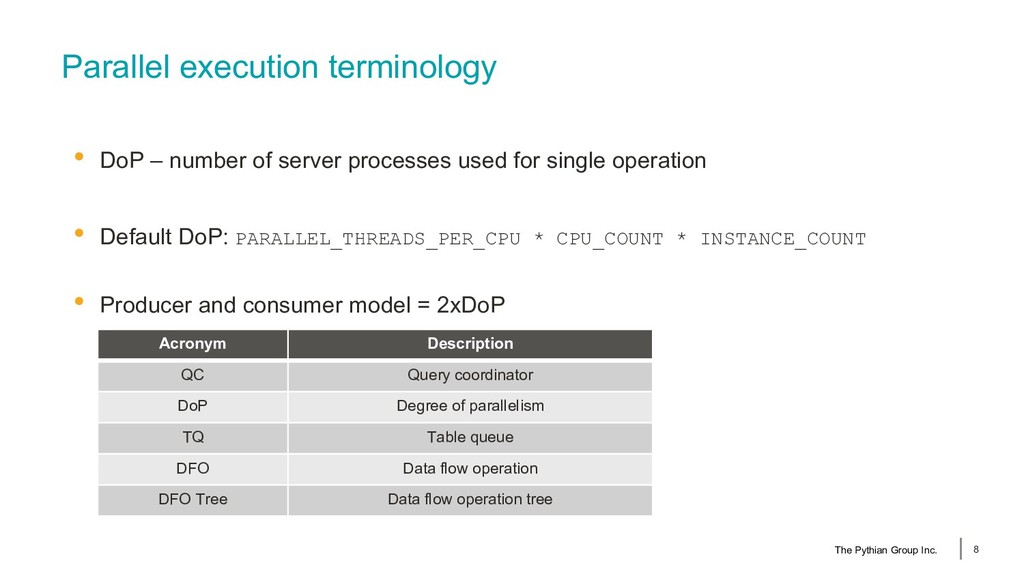
used for single operation • Default DoP: PARALLEL_THREADS_PER_CPU * CPU_COUNT * INSTANCE_COUNT • Producer and consumer model = 2xDoP Acronym Description QC Query coordinator DoP Degree of parallelism TQ Table queue DFO Data flow operation DFO Tree Data flow operation tree The Pythian Group Inc. 8
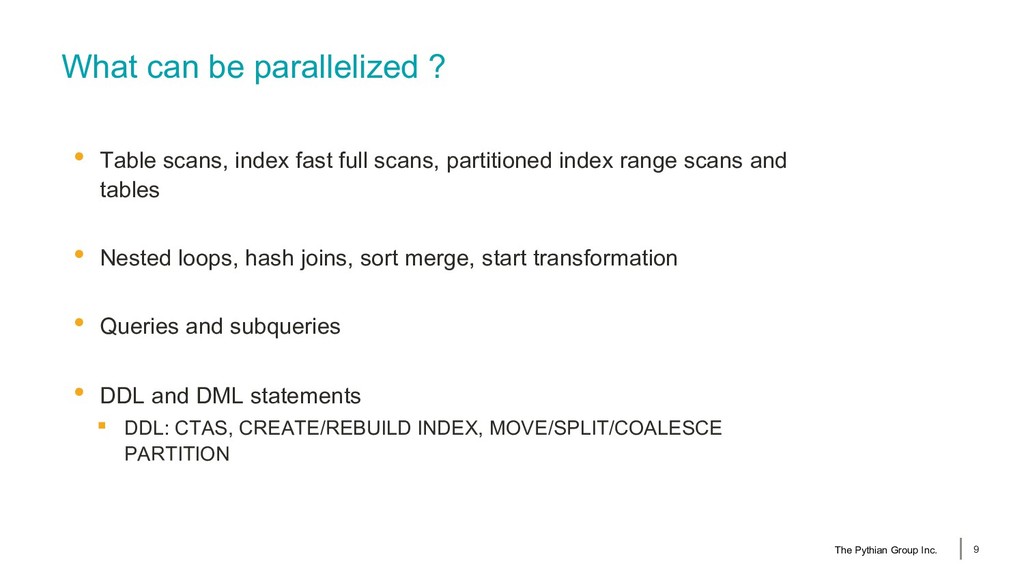
full scans, partitioned index range scans and tables • Nested loops, hash joins, sort merge, start transformation • Queries and subqueries • DDL and DML statements ▪ DDL: CTAS, CREATE/REBUILD INDEX, MOVE/SPLIT/COALESCE PARTITION The Pythian Group Inc. 9
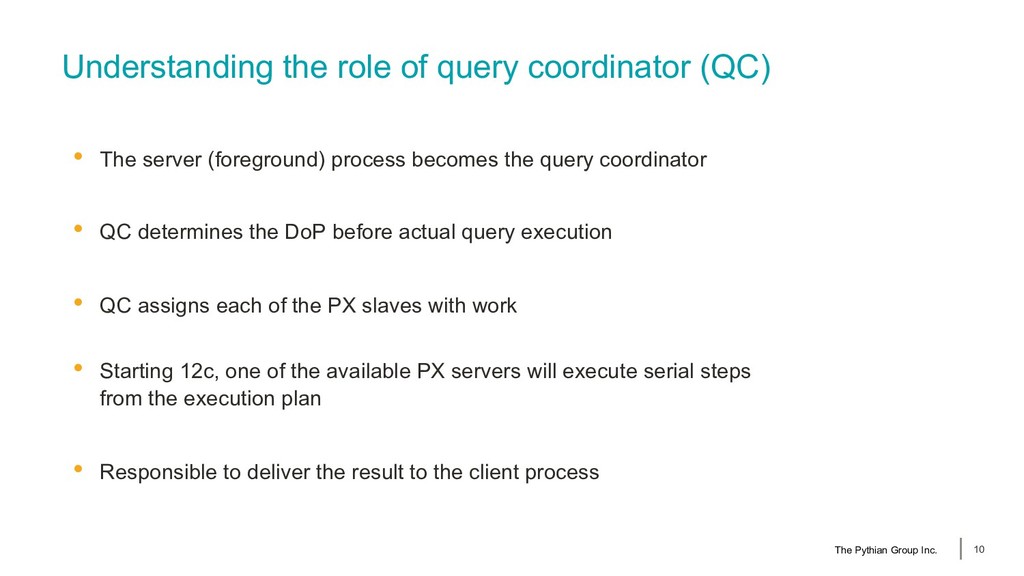
(foreground) process becomes the query coordinator • QC determines the DoP before actual query execution • QC assigns each of the PX slaves with work • Starting 12c, one of the available PX servers will execute serial steps from the execution plan • Responsible to deliver the result to the client process The Pythian Group Inc. 10
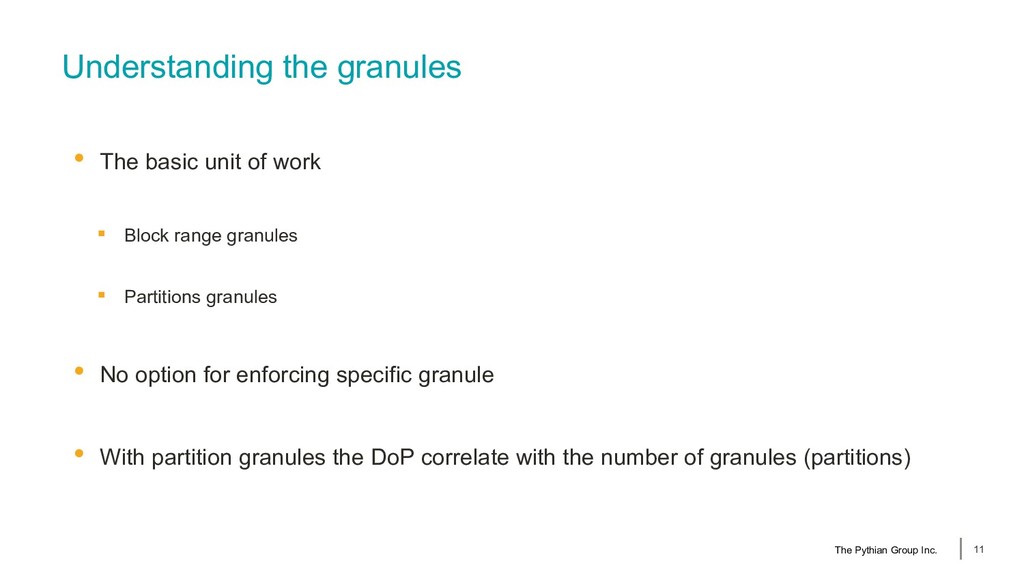
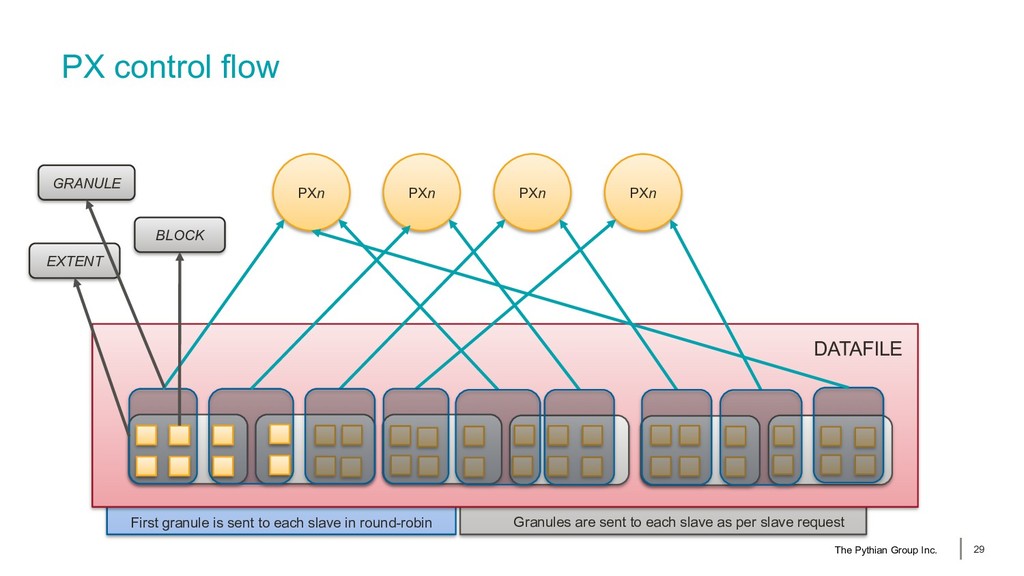
Block range granules ▪ Partitions granules • No option for enforcing specific granule • With partition granules the DoP correlate with the number of granules (partitions) The Pythian Group Inc. 11
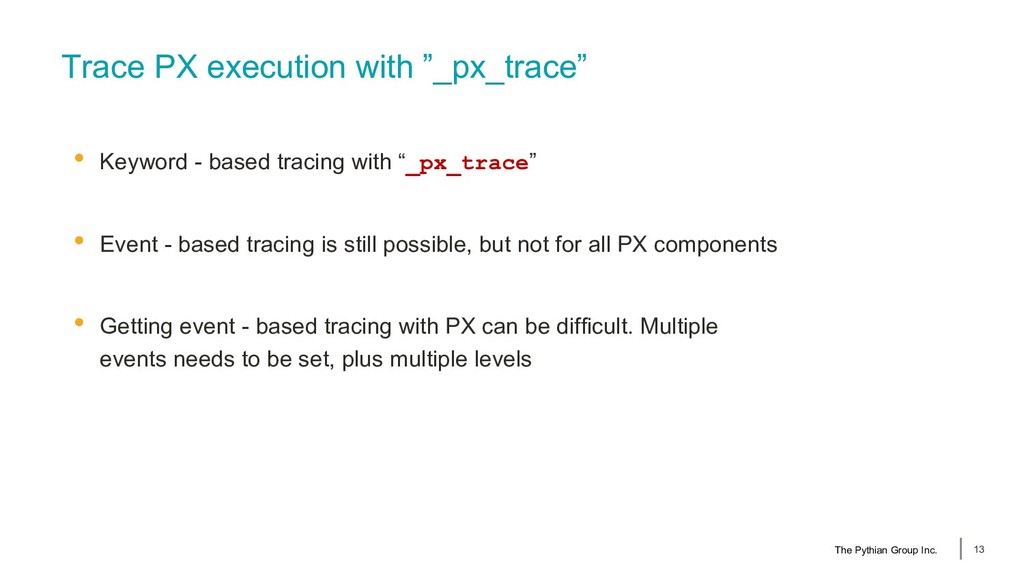
with “_px_trace” • Event - based tracing is still possible, but not for all PX components • Getting event - based tracing with PX can be difficult. Multiple events needs to be set, plus multiple levels The Pythian Group Inc. 13
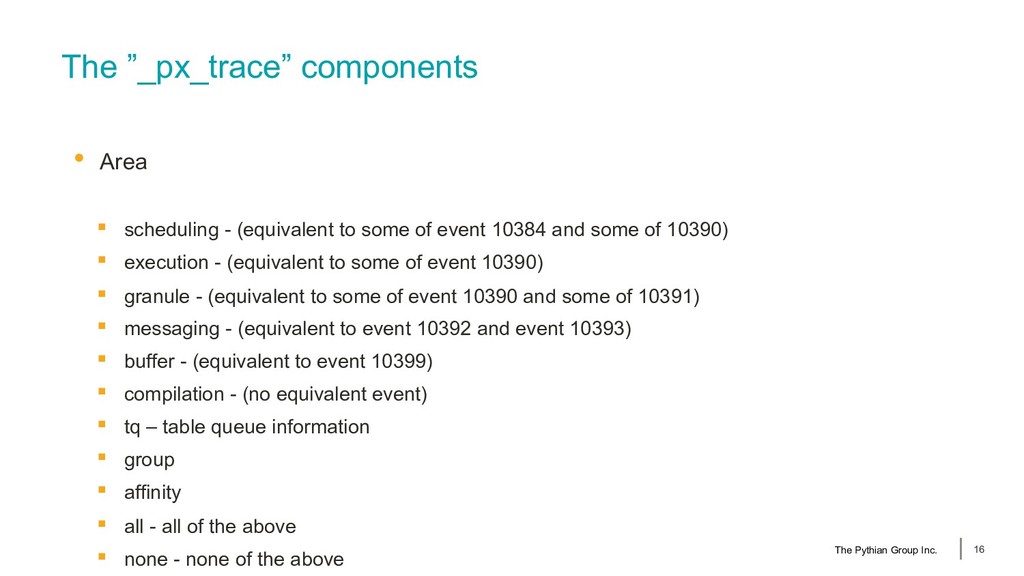
some of event 10384 and some of 10390) ▪ execution - (equivalent to some of event 10390) ▪ granule - (equivalent to some of event 10390 and some of 10391) ▪ messaging - (equivalent to event 10392 and event 10393) ▪ buffer - (equivalent to event 10399) ▪ compilation - (no equivalent event) ▪ tq – table queue information ▪ group ▪ affinity ▪ all - all of the above ▪ none - none of the above The Pythian Group Inc. 16
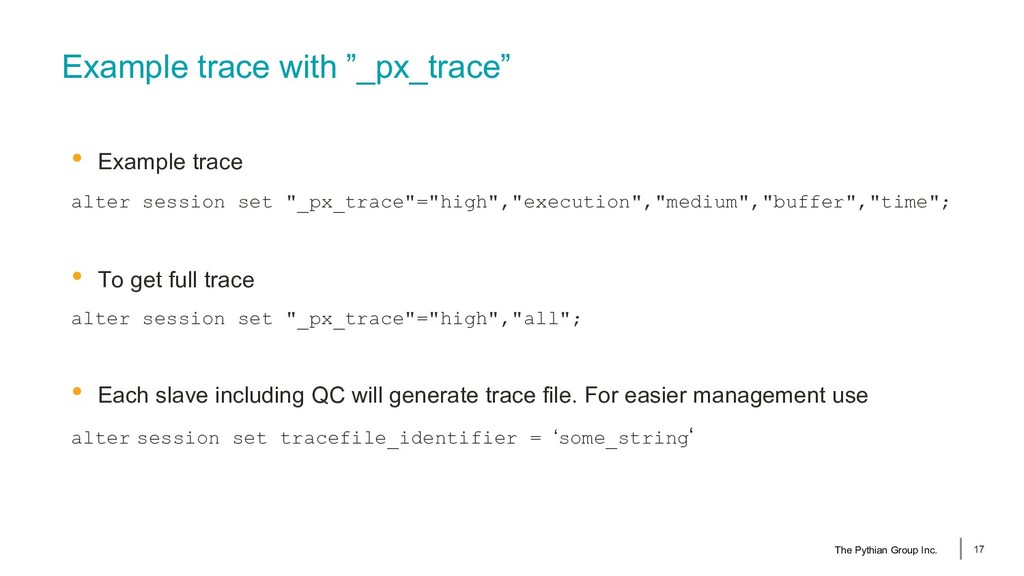
"_px_trace"="high","execution","medium","buffer","time"; • To get full trace alter session set "_px_trace"="high","all"; • Each slave including QC will generate trace file. For easier management use alter session set tracefile_identifier = ‘some_string‘ The Pythian Group Inc. 17
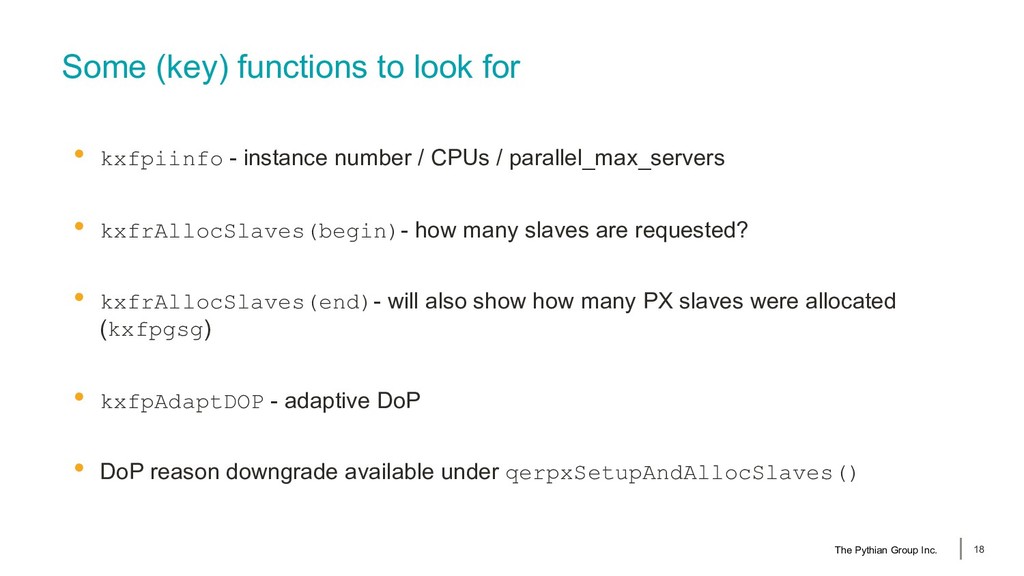
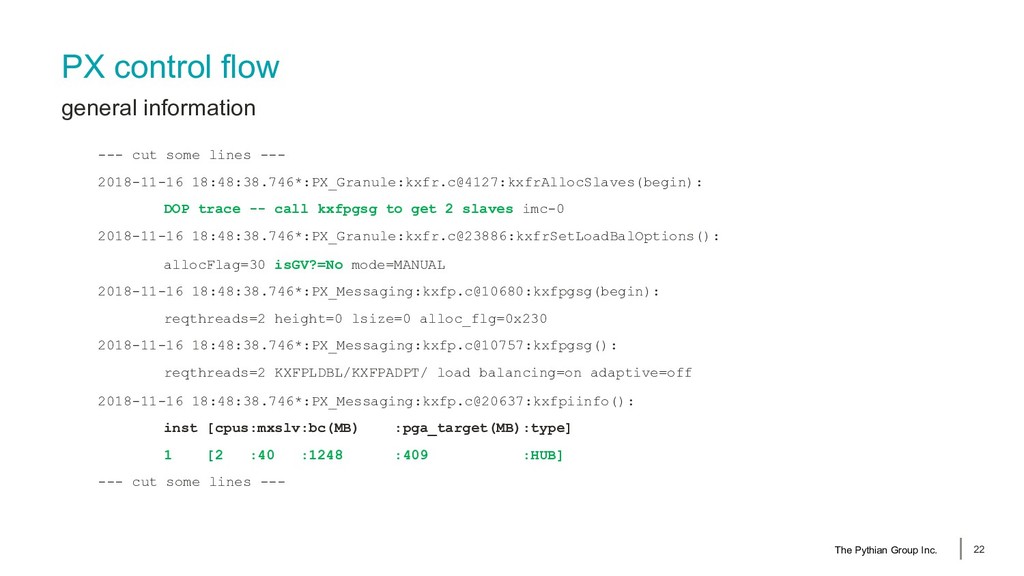
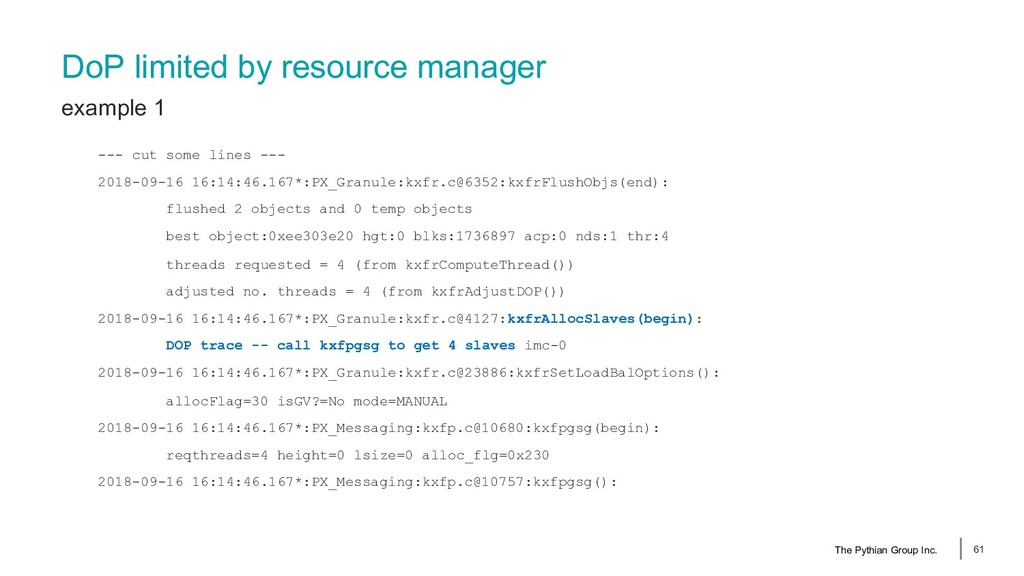
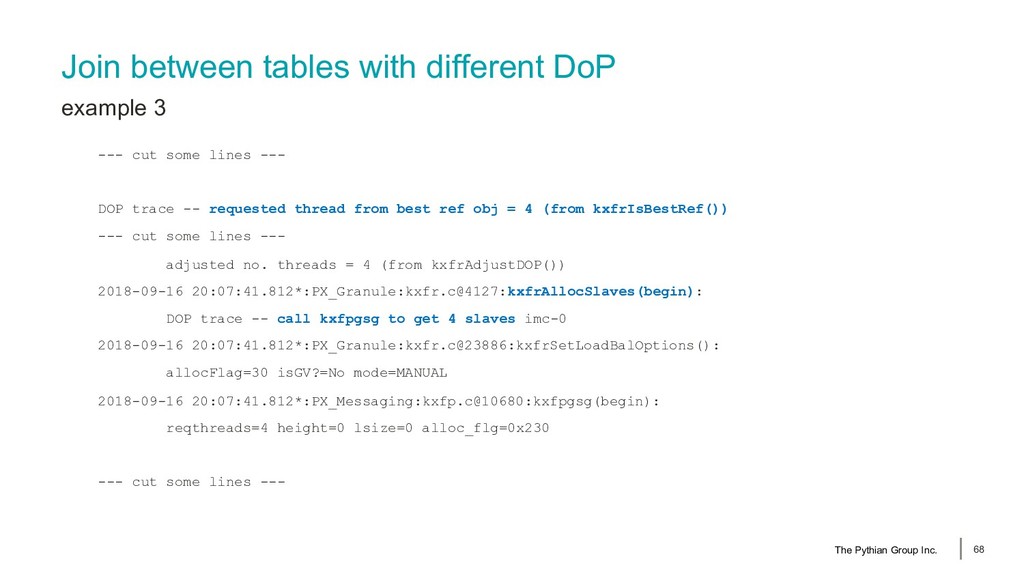
number / CPUs / parallel_max_servers • kxfrAllocSlaves(begin)- how many slaves are requested? • kxfrAllocSlaves(end)- will also show how many PX slaves were allocated (kxfpgsg) • kxfpAdaptDOP - adaptive DoP • DoP reason downgrade available under qerpxSetupAndAllocSlaves() The Pythian Group Inc. 18
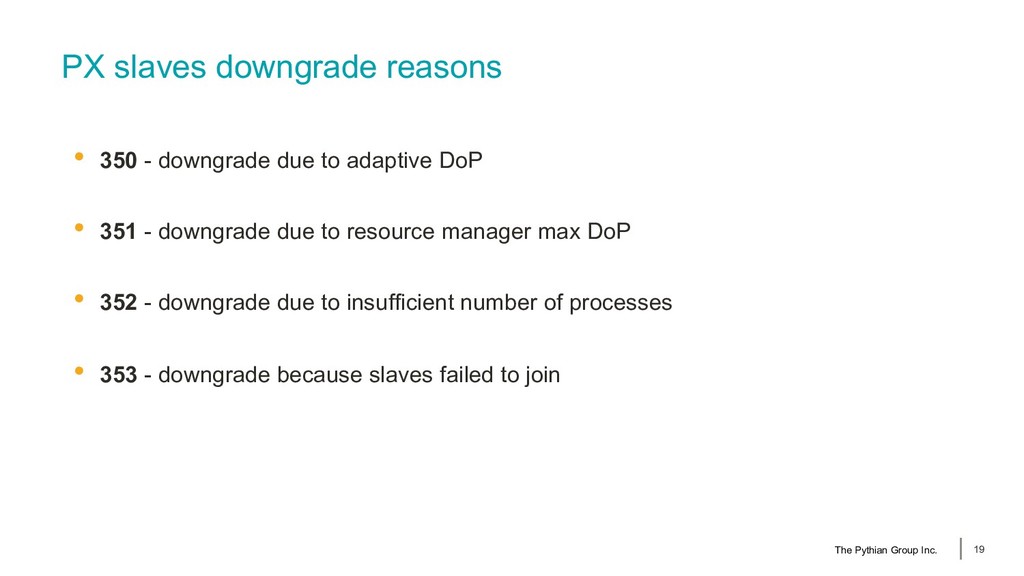
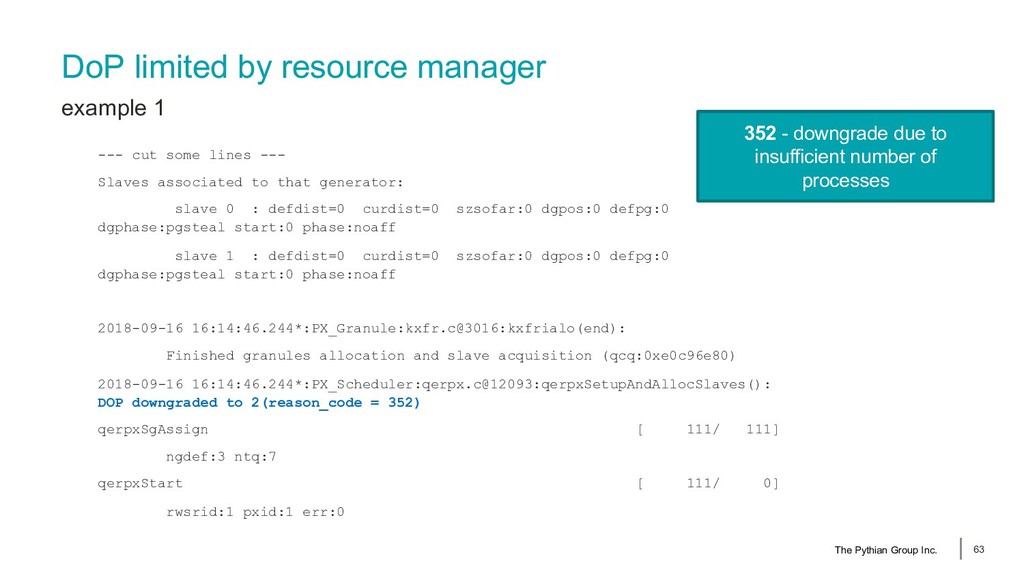
adaptive DoP • 351 - downgrade due to resource manager max DoP • 352 - downgrade due to insufficient number of processes • 353 - downgrade because slaves failed to join The Pythian Group Inc. 19
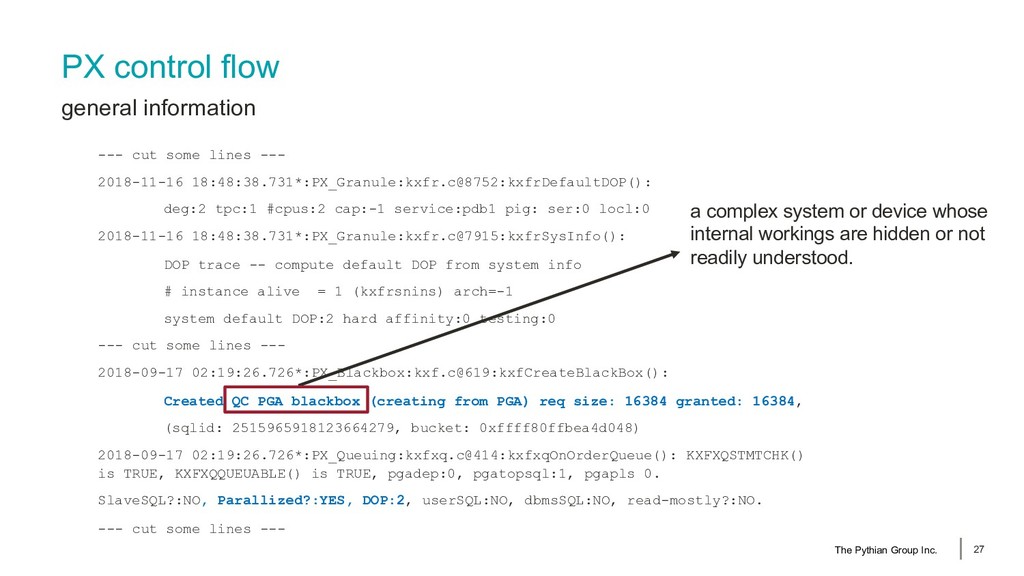
2018-11-16 18:48:38.731*:PX_Granule:kxfr.c@8752:kxfrDefaultDOP(): deg:2 tpc:1 #cpus:2 cap:-1 service:pdb1 pig: ser:0 locl:0 2018-11-16 18:48:38.731*:PX_Granule:kxfr.c@7915:kxfrSysInfo(): DOP trace -- compute default DOP from system info # instance alive = 1 (kxfrsnins) arch=-1 system default DOP:2 hard affinity:0 testing:0 --- cut some lines --- 2018-09-17 02:19:26.726*:PX_Blackbox:kxf.c@619:kxfCreateBlackBox(): Created QC PGA blackbox (creating from PGA) req size: 16384 granted: 16384, (sqlid: 2515965918123664279, bucket: 0xffff80ffbea4d048) 2018-09-17 02:19:26.726*:PX_Queuing:kxfxq.c@414:kxfxqOnOrderQueue(): KXFXQSTMTCHK() is TRUE, KXFXQQUEUABLE() is TRUE, pgadep:0, pgatopsql:1, pgapls 0. SlaveSQL?:NO, Parallized?:YES, DOP:2, userSQL:NO, dbmsSQL:NO, read-mostly?:NO. --- cut some lines --- The Pythian Group Inc. 27 a complex system or device whose internal workings are hidden or not readily understood.
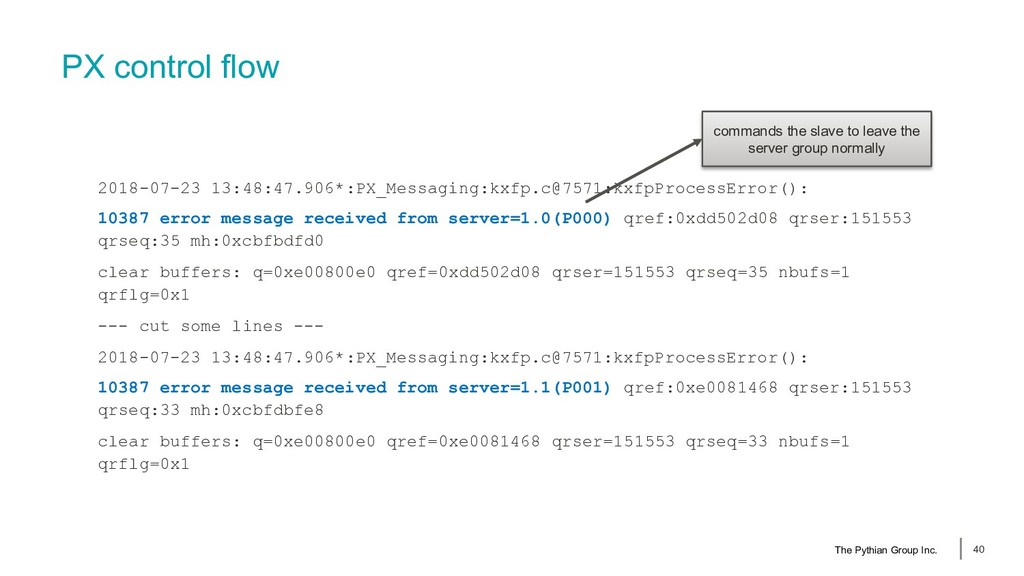
server=1.0(P000) qref:0xdd502d08 qrser:151553 qrseq:35 mh:0xcbfbdfd0 clear buffers: q=0xe00800e0 qref=0xdd502d08 qrser=151553 qrseq=35 nbufs=1 qrflg=0x1 --- cut some lines --- 2018-07-23 13:48:47.906*:PX_Messaging:kxfp.c@7571:kxfpProcessError(): 10387 error message received from server=1.1(P001) qref:0xe0081468 qrser:151553 qrseq:33 mh:0xcbfdbfe8 clear buffers: q=0xe00800e0 qref=0xe0081468 qrser=151553 qrseq=33 nbufs=1 qrflg=0x1 commands the slave to leave the server group normally The Pythian Group Inc. 40
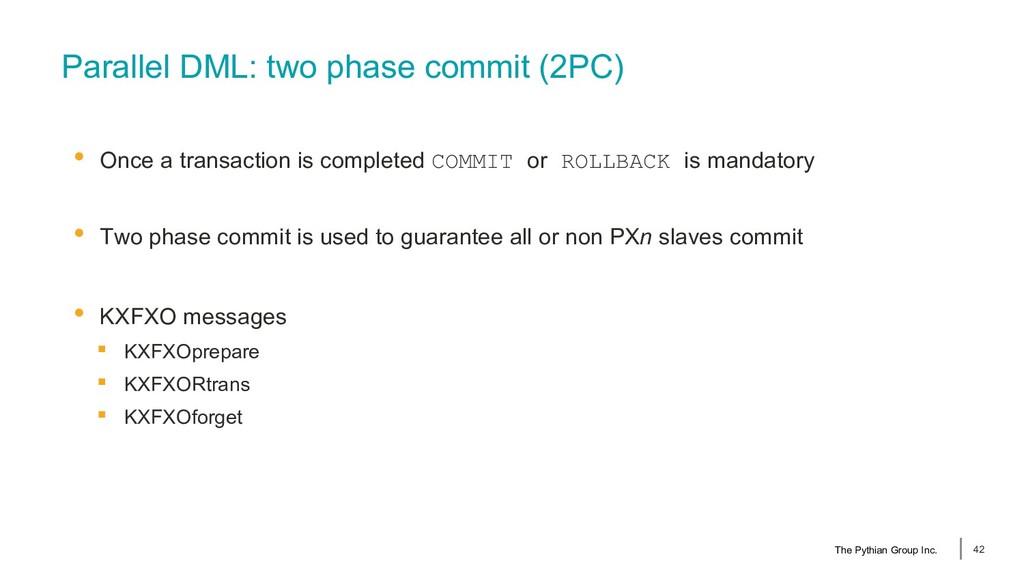
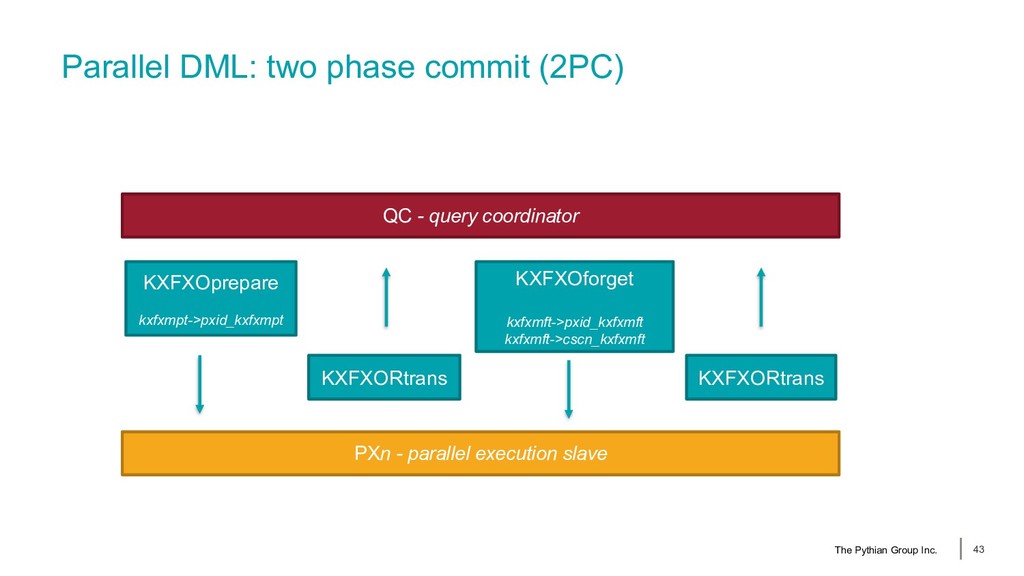
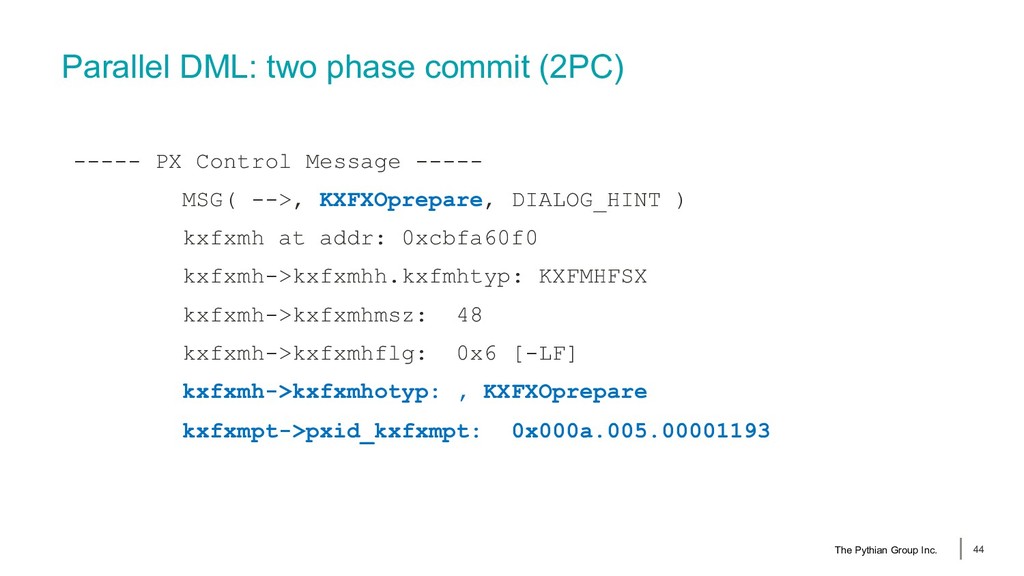
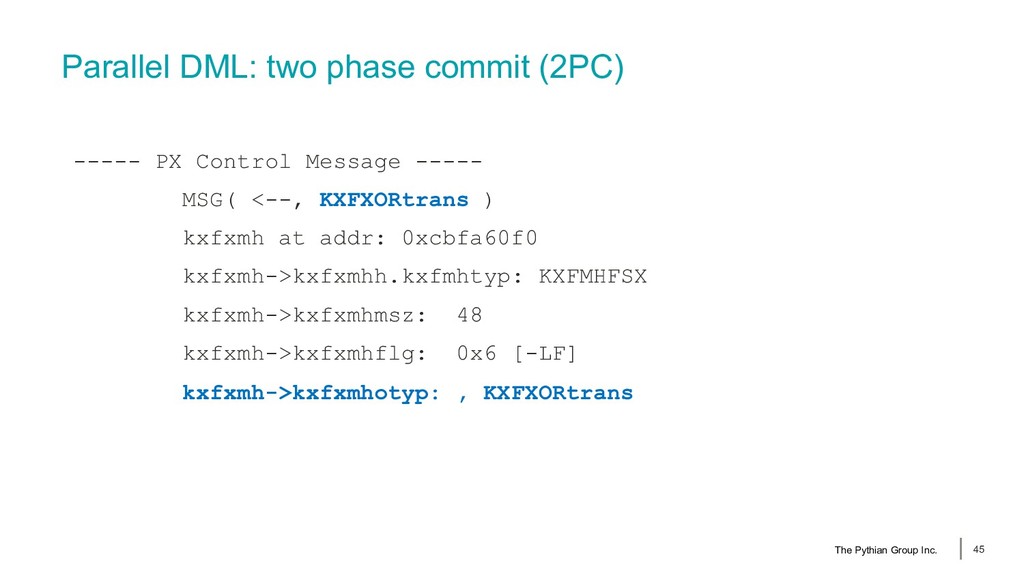
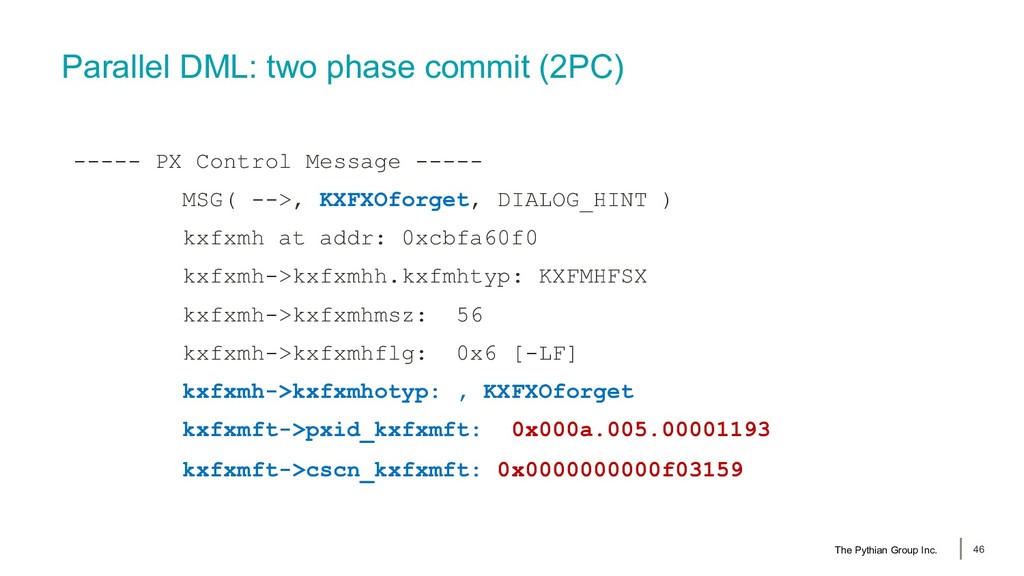
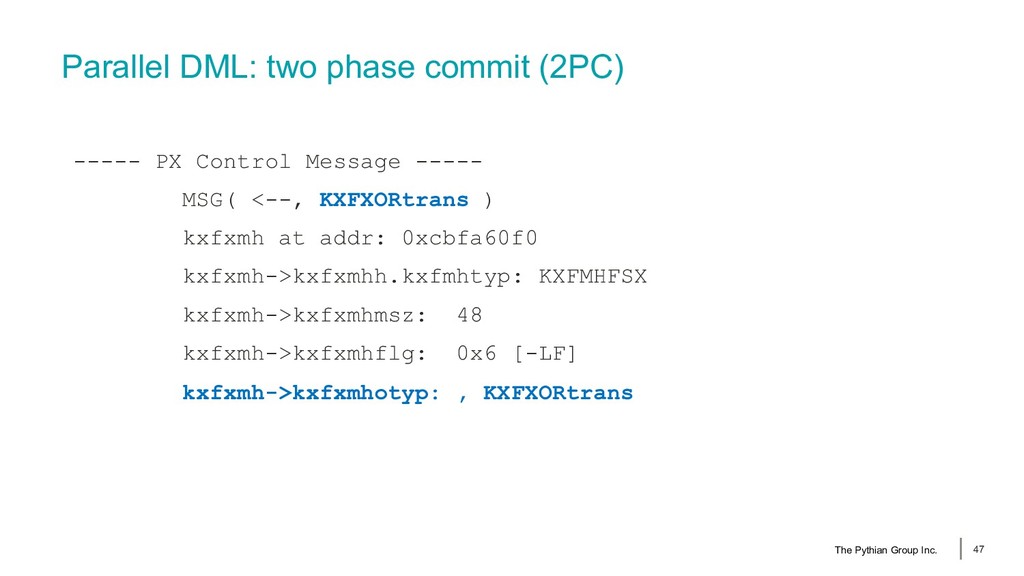
is completed COMMIT or ROLLBACK is mandatory • Two phase commit is used to guarantee all or non PXn slaves commit • KXFXO messages ▪ KXFXOprepare ▪ KXFXORtrans ▪ KXFXOforget The Pythian Group Inc. 42
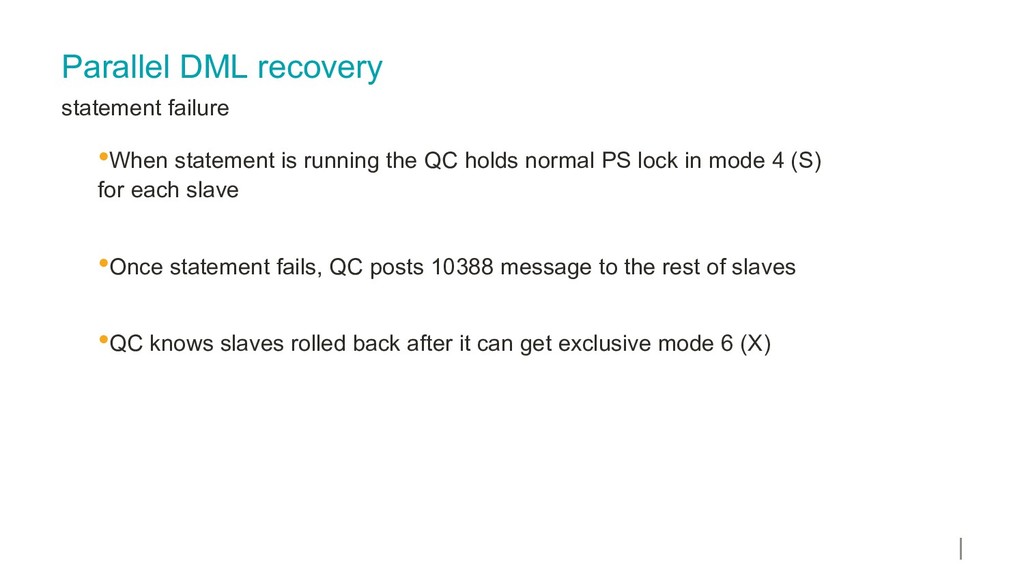
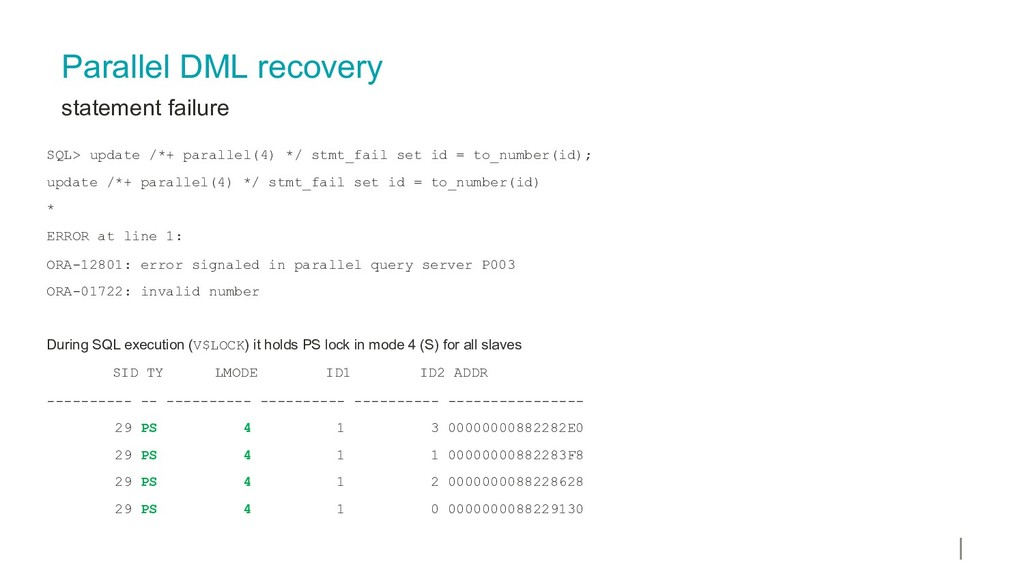
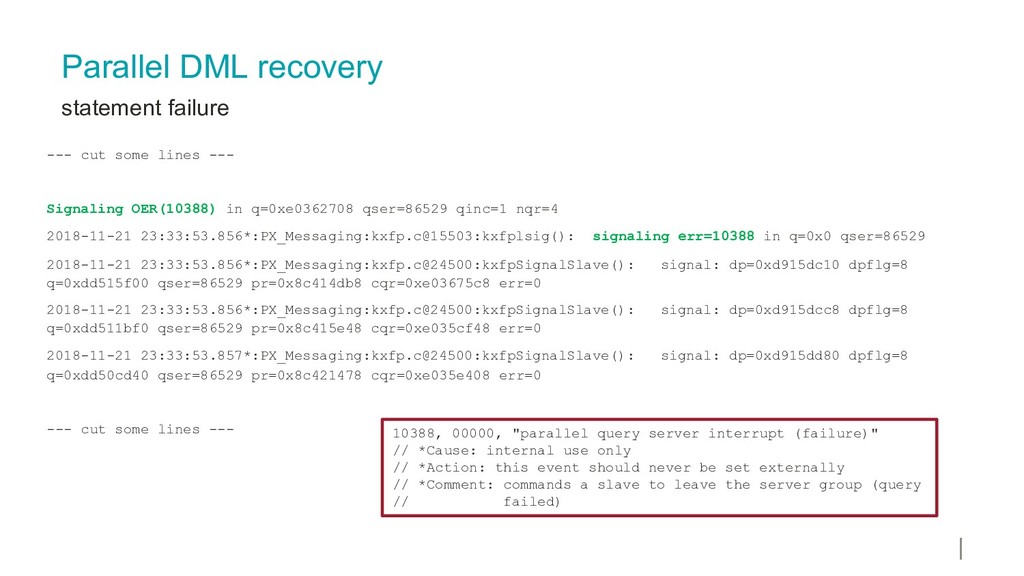
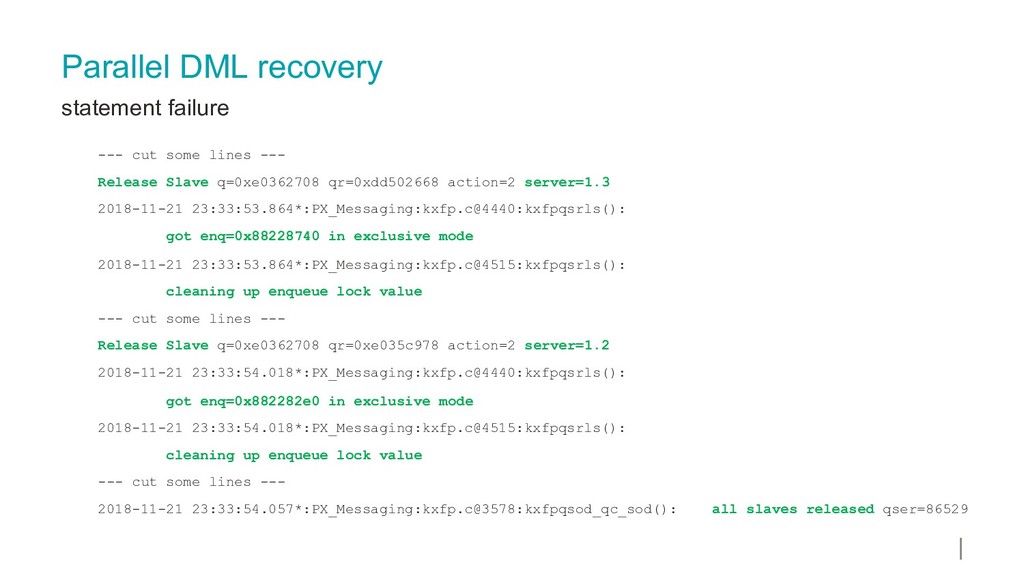
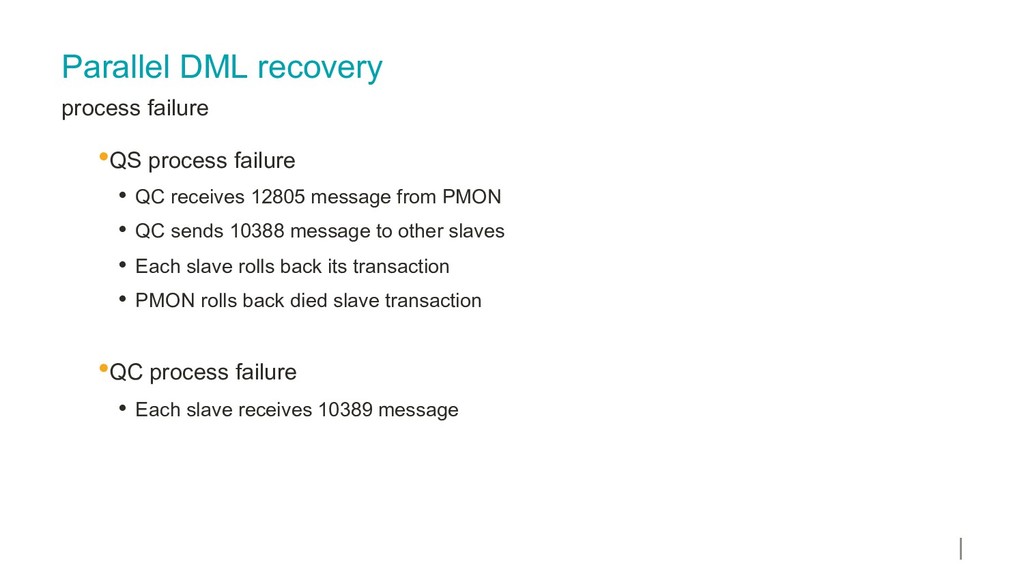
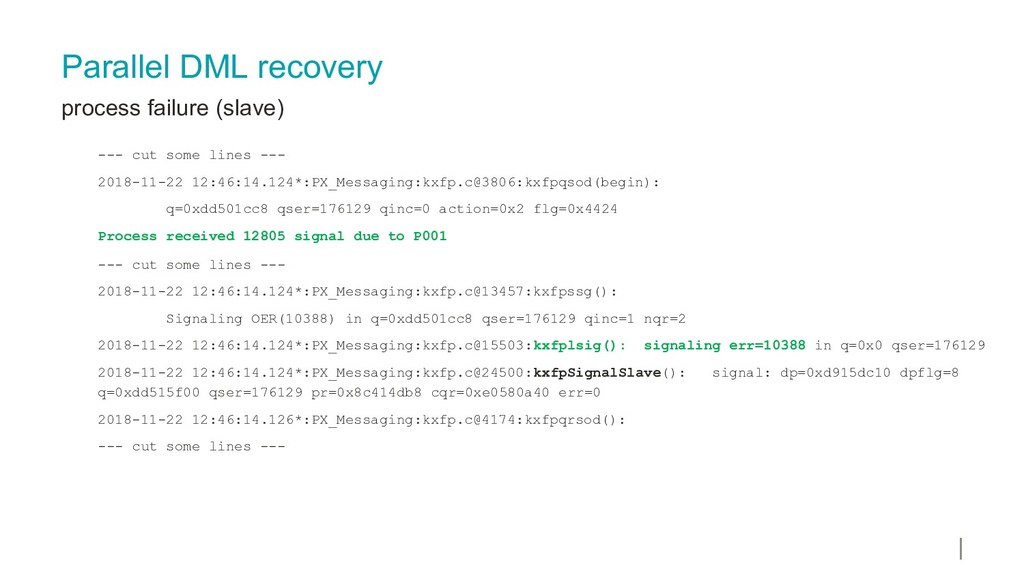
QC holds normal PS lock in mode 4 (S) for each slave •Once statement fails, QC posts 10388 message to the rest of slaves •QC knows slaves rolled back after it can get exclusive mode 6 (X)
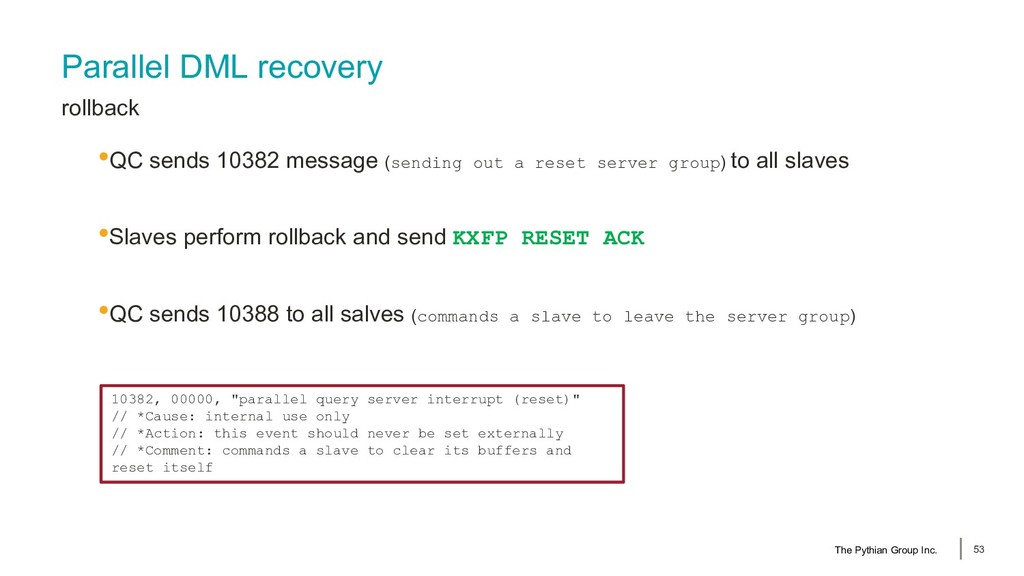
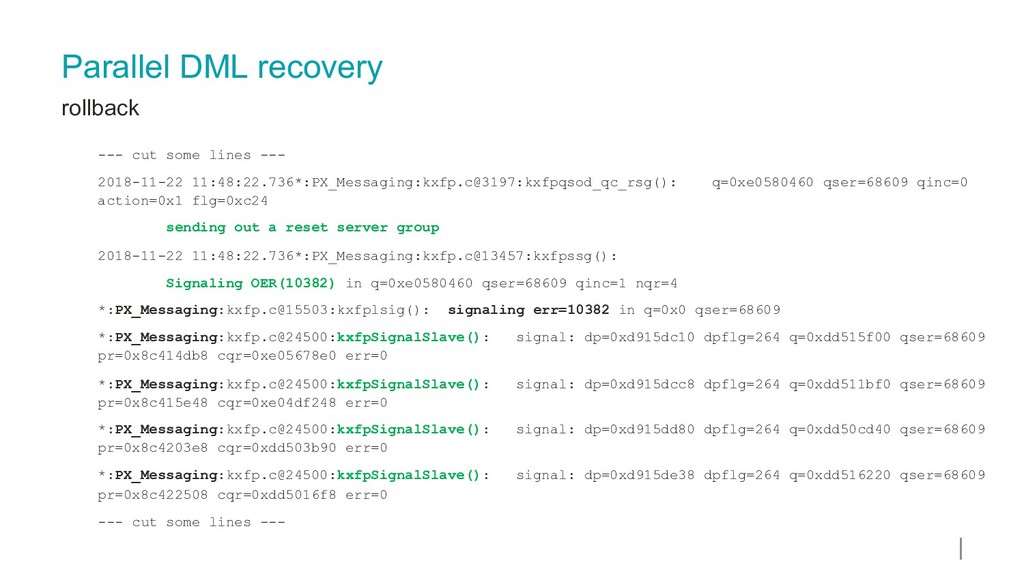
a reset server group) to all slaves •Slaves perform rollback and send KXFP RESET ACK •QC sends 10388 to all salves (commands a slave to leave the server group) The Pythian Group Inc. 53 10382, 00000, "parallel query server interrupt (reset)" // *Cause: internal use only // *Action: this event should never be set externally // *Comment: commands a slave to clear its buffers and reset itself
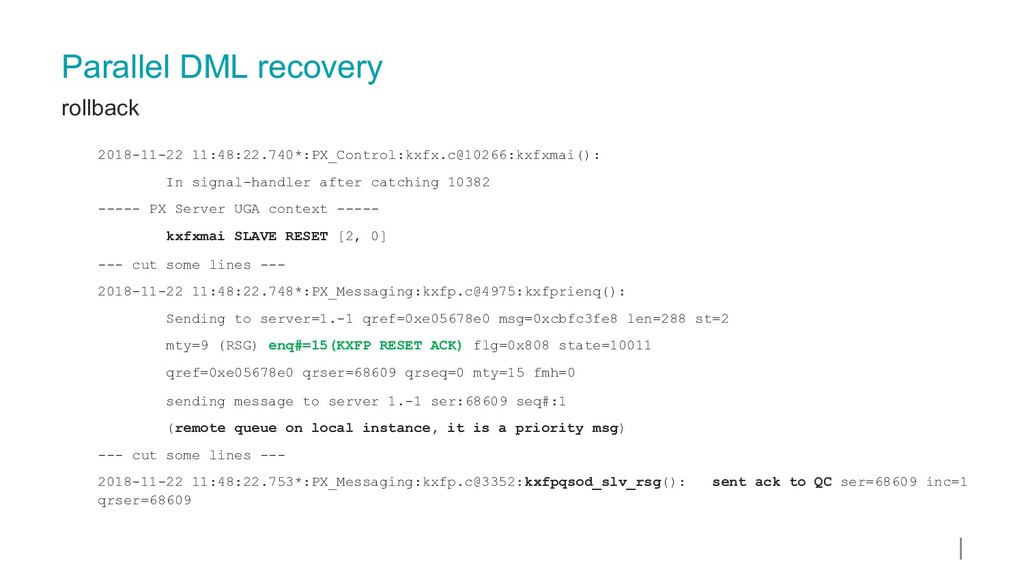
10382 ----- PX Server UGA context ----- kxfxmai SLAVE RESET [2, 0] --- cut some lines --- 2018-11-22 11:48:22.748*:PX_Messaging:kxfp.c@4975:kxfprienq(): Sending to server=1.-1 qref=0xe05678e0 msg=0xcbfc3fe8 len=288 st=2 mty=9 (RSG) enq#=15(KXFP RESET ACK) flg=0x808 state=10011 qref=0xe05678e0 qrser=68609 qrseq=0 mty=15 fmh=0 sending message to server 1.-1 ser:68609 seq#:1 (remote queue on local instance, it is a priority msg) --- cut some lines --- 2018-11-22 11:48:22.753*:PX_Messaging:kxfp.c@3352:kxfpqsod_slv_rsg(): sent ack to QC ser=68609 inc=1 qrser=68609
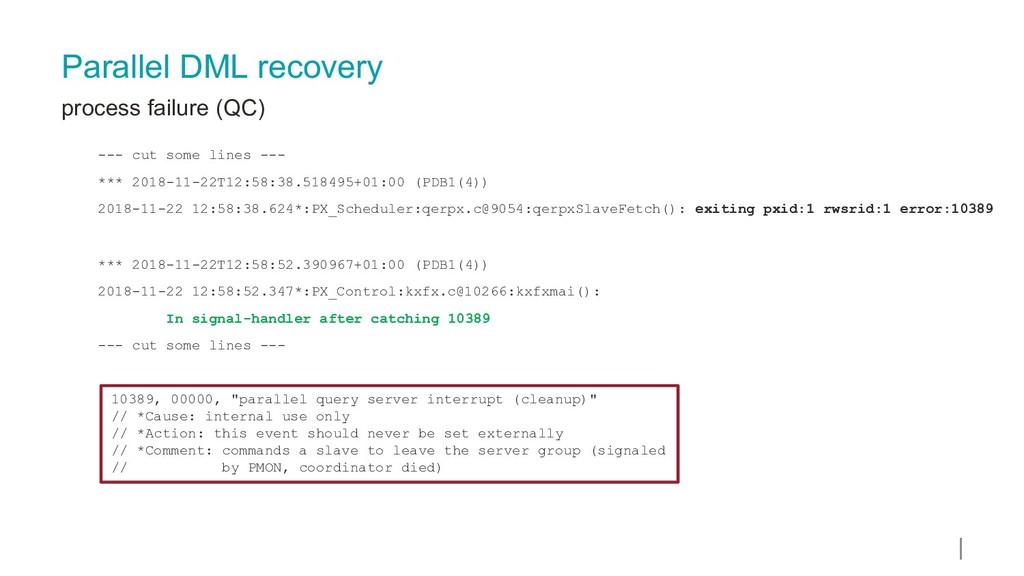
receives 12805 message from PMON • QC sends 10388 message to other slaves • Each slave rolls back its transaction • PMON rolls back died slave transaction •QC process failure • Each slave receives 10389 message
--- *** 2018-11-22T12:58:38.518495+01:00 (PDB1(4)) 2018-11-22 12:58:38.624*:PX_Scheduler:qerpx.c@9054:qerpxSlaveFetch(): exiting pxid:1 rwsrid:1 error:10389 *** 2018-11-22T12:58:52.390967+01:00 (PDB1(4)) 2018-11-22 12:58:52.347*:PX_Control:kxfx.c@10266:kxfxmai(): In signal-handler after catching 10389 --- cut some lines --- 10389, 00000, "parallel query server interrupt (cleanup)" // *Cause: internal use only // *Action: this event should never be set externally // *Comment: commands a slave to leave the server group (signaled // by PMON, coordinator died)
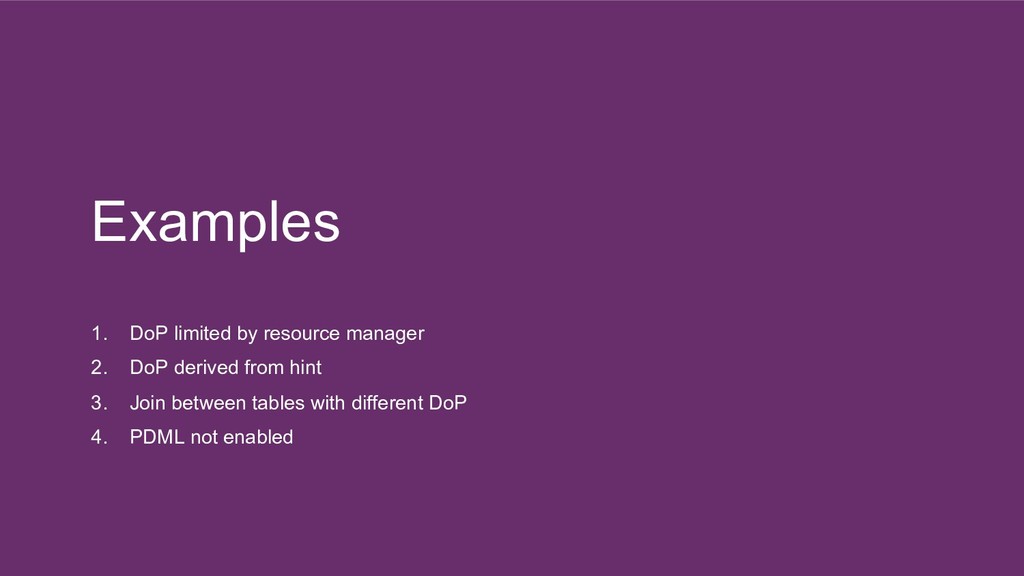
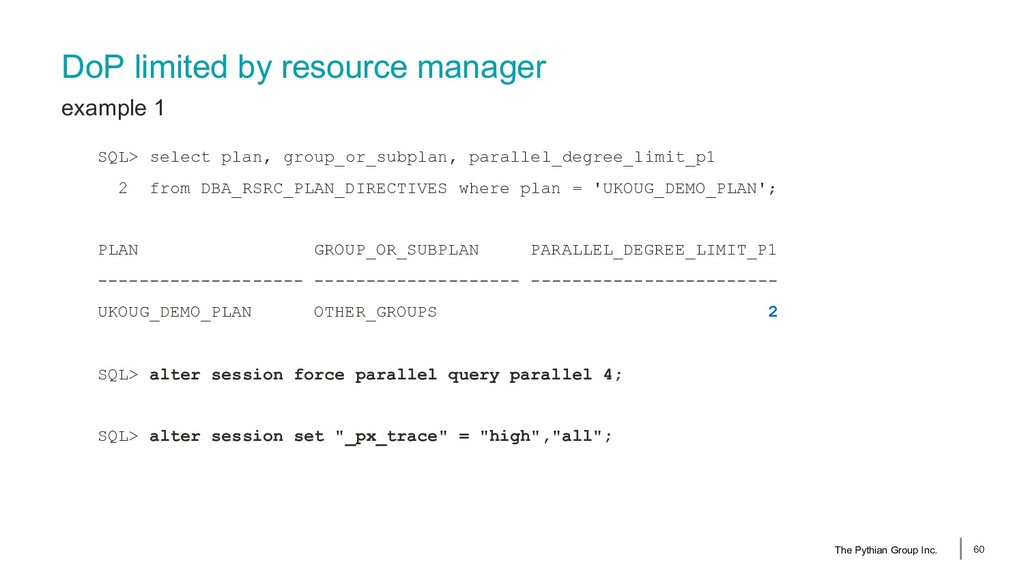
group_or_subplan, parallel_degree_limit_p1 2 from DBA_RSRC_PLAN_DIRECTIVES where plan = 'UKOUG_DEMO_PLAN'; PLAN GROUP_OR_SUBPLAN PARALLEL_DEGREE_LIMIT_P1 -------------------- -------------------- ------------------------ UKOUG_DEMO_PLAN OTHER_GROUPS 2 SQL> alter session force parallel query parallel 4; SQL> alter session set "_px_trace" = "high","all"; The Pythian Group Inc. 60
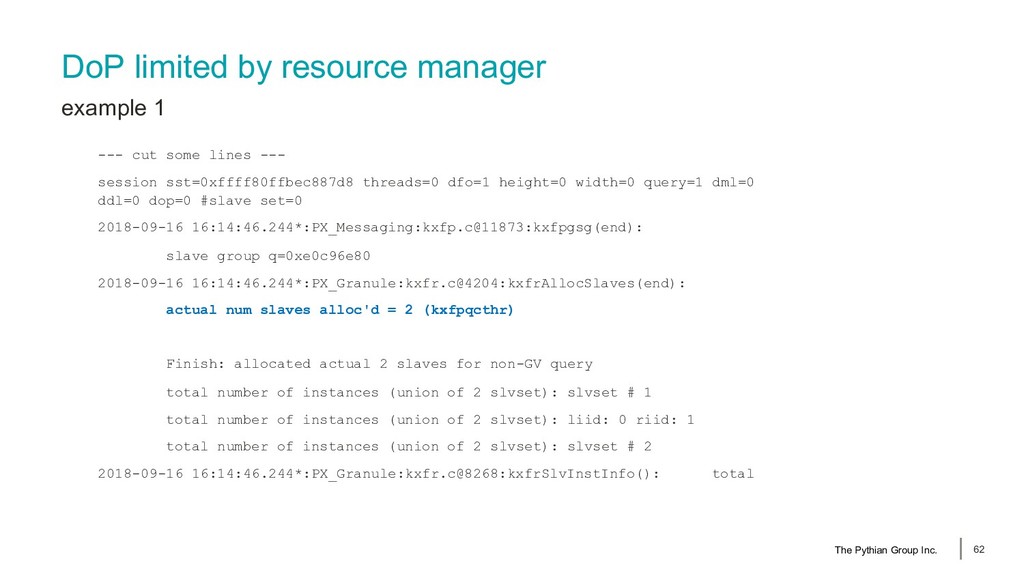
lines --- session sst=0xffff80ffbec887d8 threads=0 dfo=1 height=0 width=0 query=1 dml=0 ddl=0 dop=0 #slave set=0 2018-09-16 16:14:46.244*:PX_Messaging:kxfp.c@11873:kxfpgsg(end): slave group q=0xe0c96e80 2018-09-16 16:14:46.244*:PX_Granule:kxfr.c@4204:kxfrAllocSlaves(end): actual num slaves alloc'd = 2 (kxfpqcthr) Finish: allocated actual 2 slaves for non-GV query total number of instances (union of 2 slvset): slvset # 1 total number of instances (union of 2 slvset): liid: 0 riid: 1 total number of instances (union of 2 slvset): slvset # 2 2018-09-16 16:14:46.244*:PX_Granule:kxfr.c@8268:kxfrSlvInstInfo(): total The Pythian Group Inc. 62
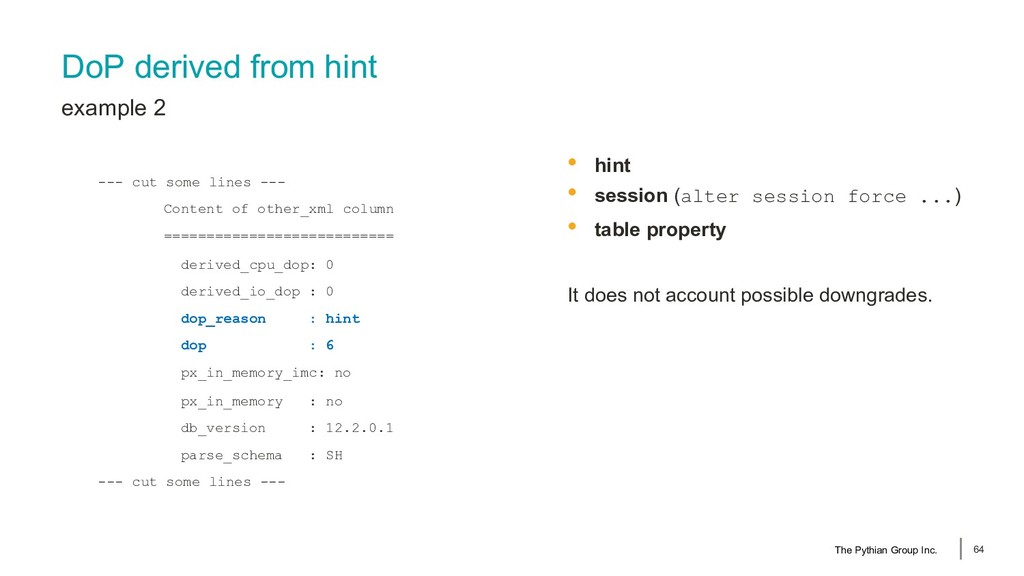
--- Content of other_xml column =========================== derived_cpu_dop: 0 derived_io_dop : 0 dop_reason : hint dop : 6 px_in_memory_imc: no px_in_memory : no db_version : 12.2.0.1 parse_schema : SH --- cut some lines --- The Pythian Group Inc. 64 • hint • session (alter session force ...) • table property It does not account possible downgrades.
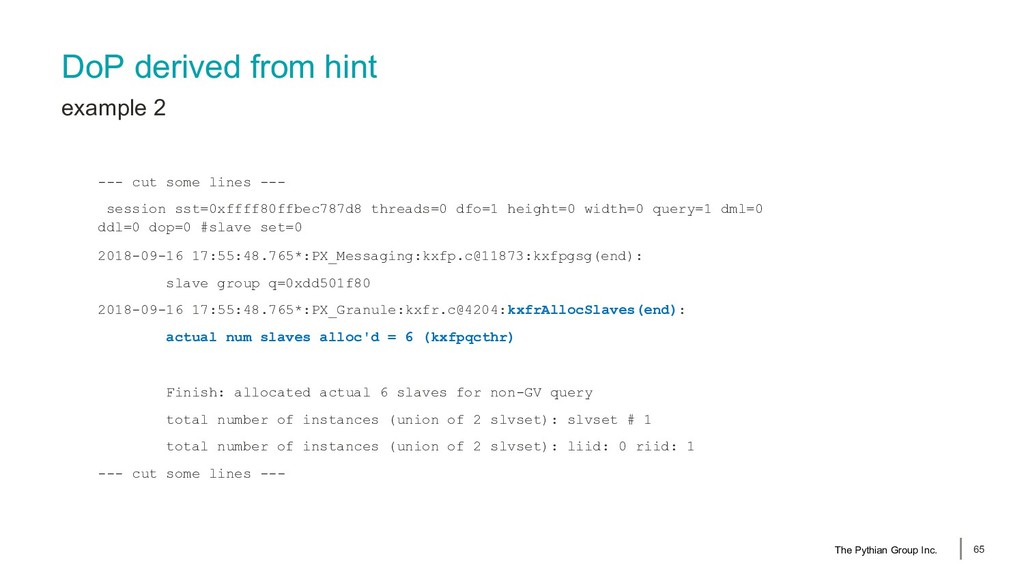
--- session sst=0xffff80ffbec787d8 threads=0 dfo=1 height=0 width=0 query=1 dml=0 ddl=0 dop=0 #slave set=0 2018-09-16 17:55:48.765*:PX_Messaging:kxfp.c@11873:kxfpgsg(end): slave group q=0xdd501f80 2018-09-16 17:55:48.765*:PX_Granule:kxfr.c@4204:kxfrAllocSlaves(end): actual num slaves alloc'd = 6 (kxfpqcthr) Finish: allocated actual 6 slaves for non-GV query total number of instances (union of 2 slvset): slvset # 1 total number of instances (union of 2 slvset): liid: 0 riid: 1 --- cut some lines --- The Pythian Group Inc. 65
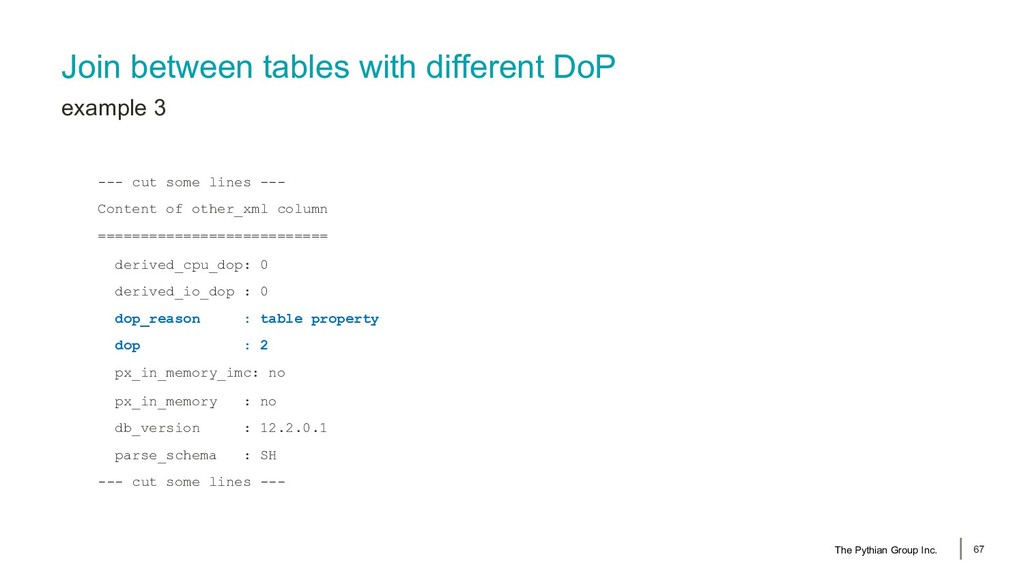
some lines --- Content of other_xml column =========================== derived_cpu_dop: 0 derived_io_dop : 0 dop_reason : table property dop : 2 px_in_memory_imc: no px_in_memory : no db_version : 12.2.0.1 parse_schema : SH --- cut some lines --- The Pythian Group Inc. 67
its slaves USERNAME SID SERIAL# STATUS SERV SQL_ID --------------- ---------- ---------- --------- ---- ------------- SH 1919 25163 QC 534p3qxg51cw4 SH 25 19975 IN USE P000 39mjdqdary80p SH 1923 42908 IN USE P001 39mjdqdary80p The Pythian Group Inc. 72
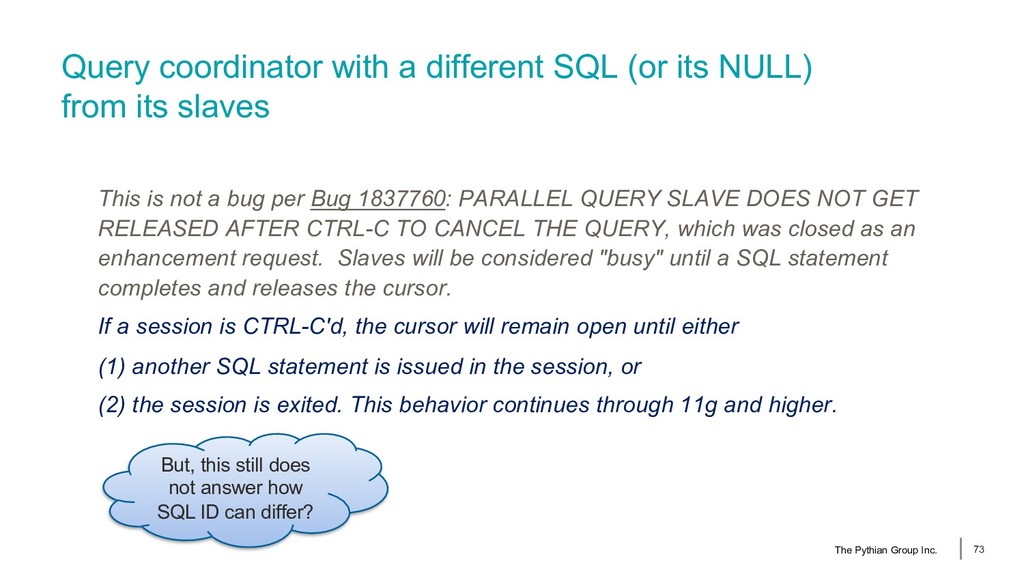
its slaves This is not a bug per Bug 1837760: PARALLEL QUERY SLAVE DOES NOT GET RELEASED AFTER CTRL-C TO CANCEL THE QUERY, which was closed as an enhancement request. Slaves will be considered "busy" until a SQL statement completes and releases the cursor. If a session is CTRL-C'd, the cursor will remain open until either (1) another SQL statement is issued in the session, or (2) the session is exited. This behavior continues through 11g and higher. The Pythian Group Inc. 73 But, this still does not answer how SQL ID can differ?
• You can see actual granules allocations • You can see execution flow / messaging between processes • Trace files are generated for each process including coordinator Summary The Pythian Group Inc. 74


 iarsov
 ueponx
 hiracky16
 kizawa2020
 4o1sobblue
 riyaamemiya
 maimyyym
 kenichiodo
 pfn
 kakehashi
 kash1064
 jozono
 marktimemedia
 elsirapls
 panda_program
 tonyrice
 chikuwait
 tapps
 aleyda
 auna
 quramy
 honnibal
 cassininazir
 skipperchong