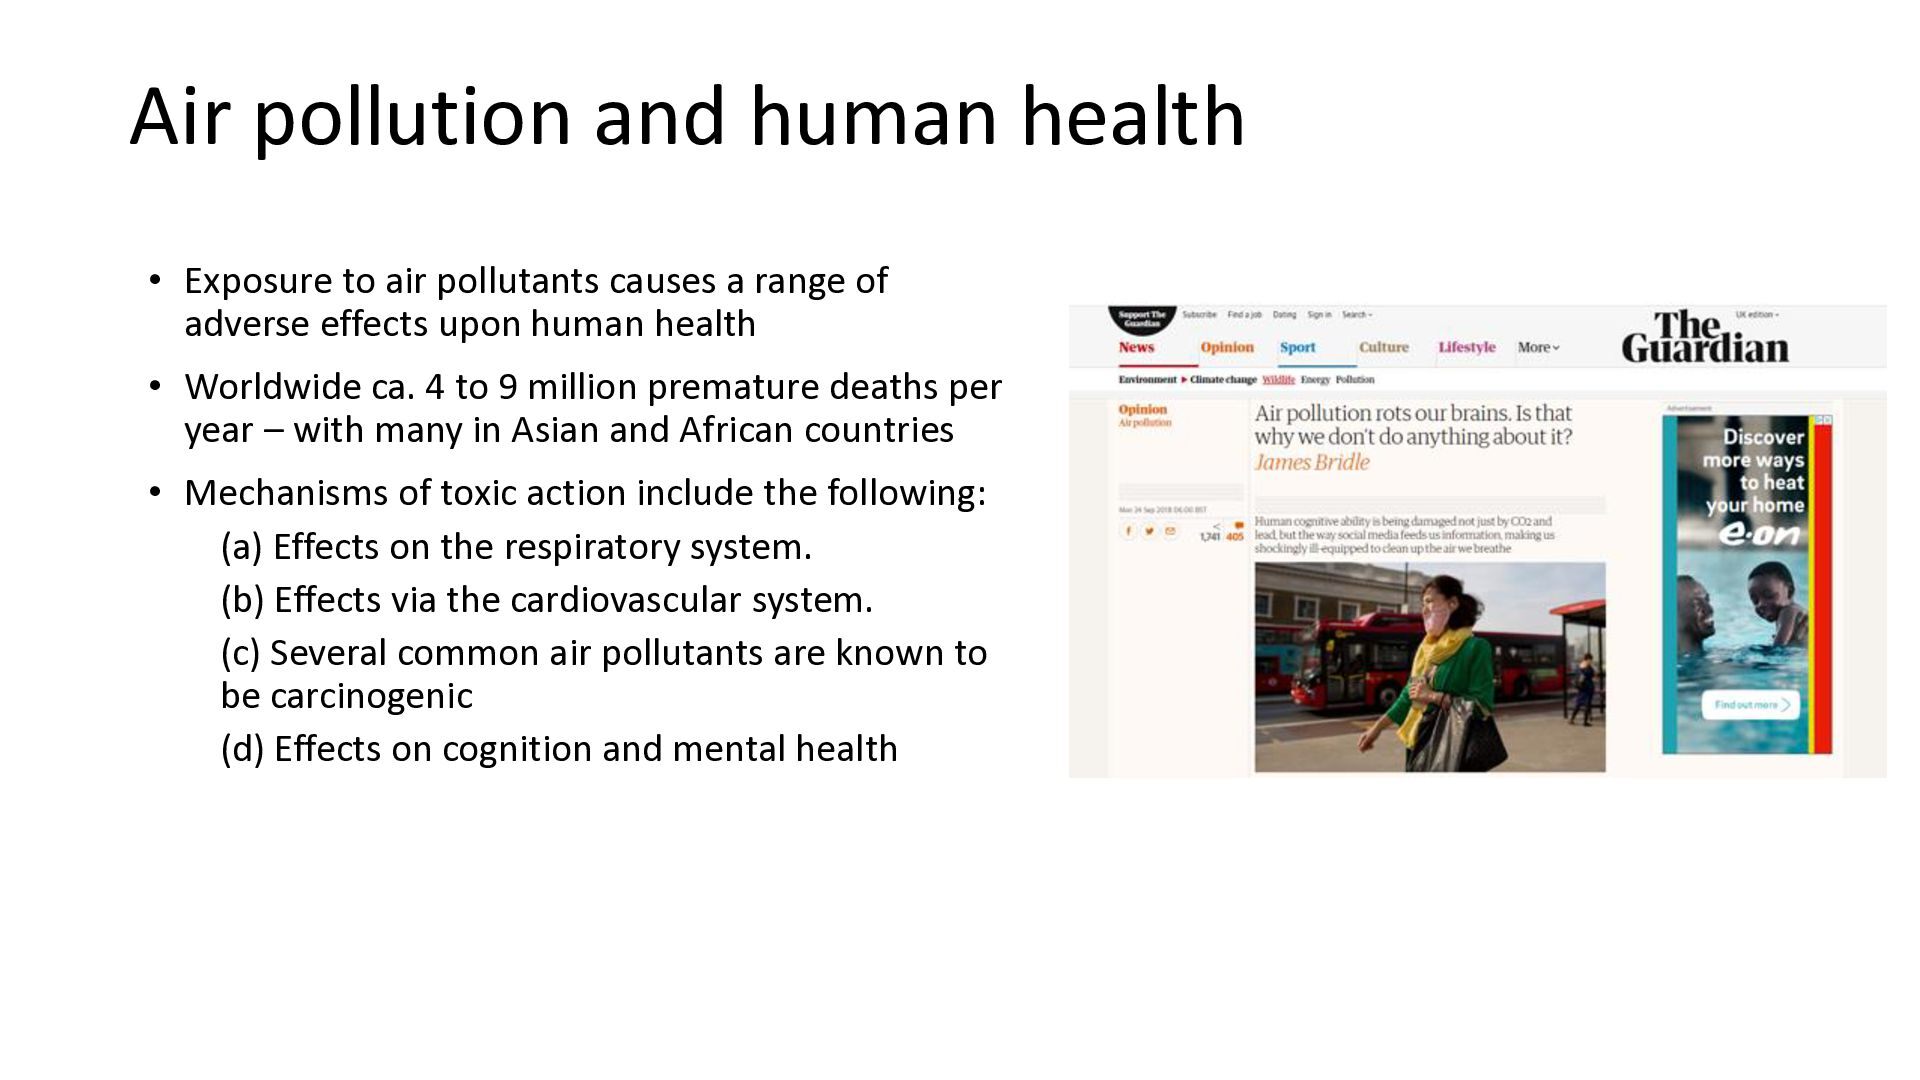
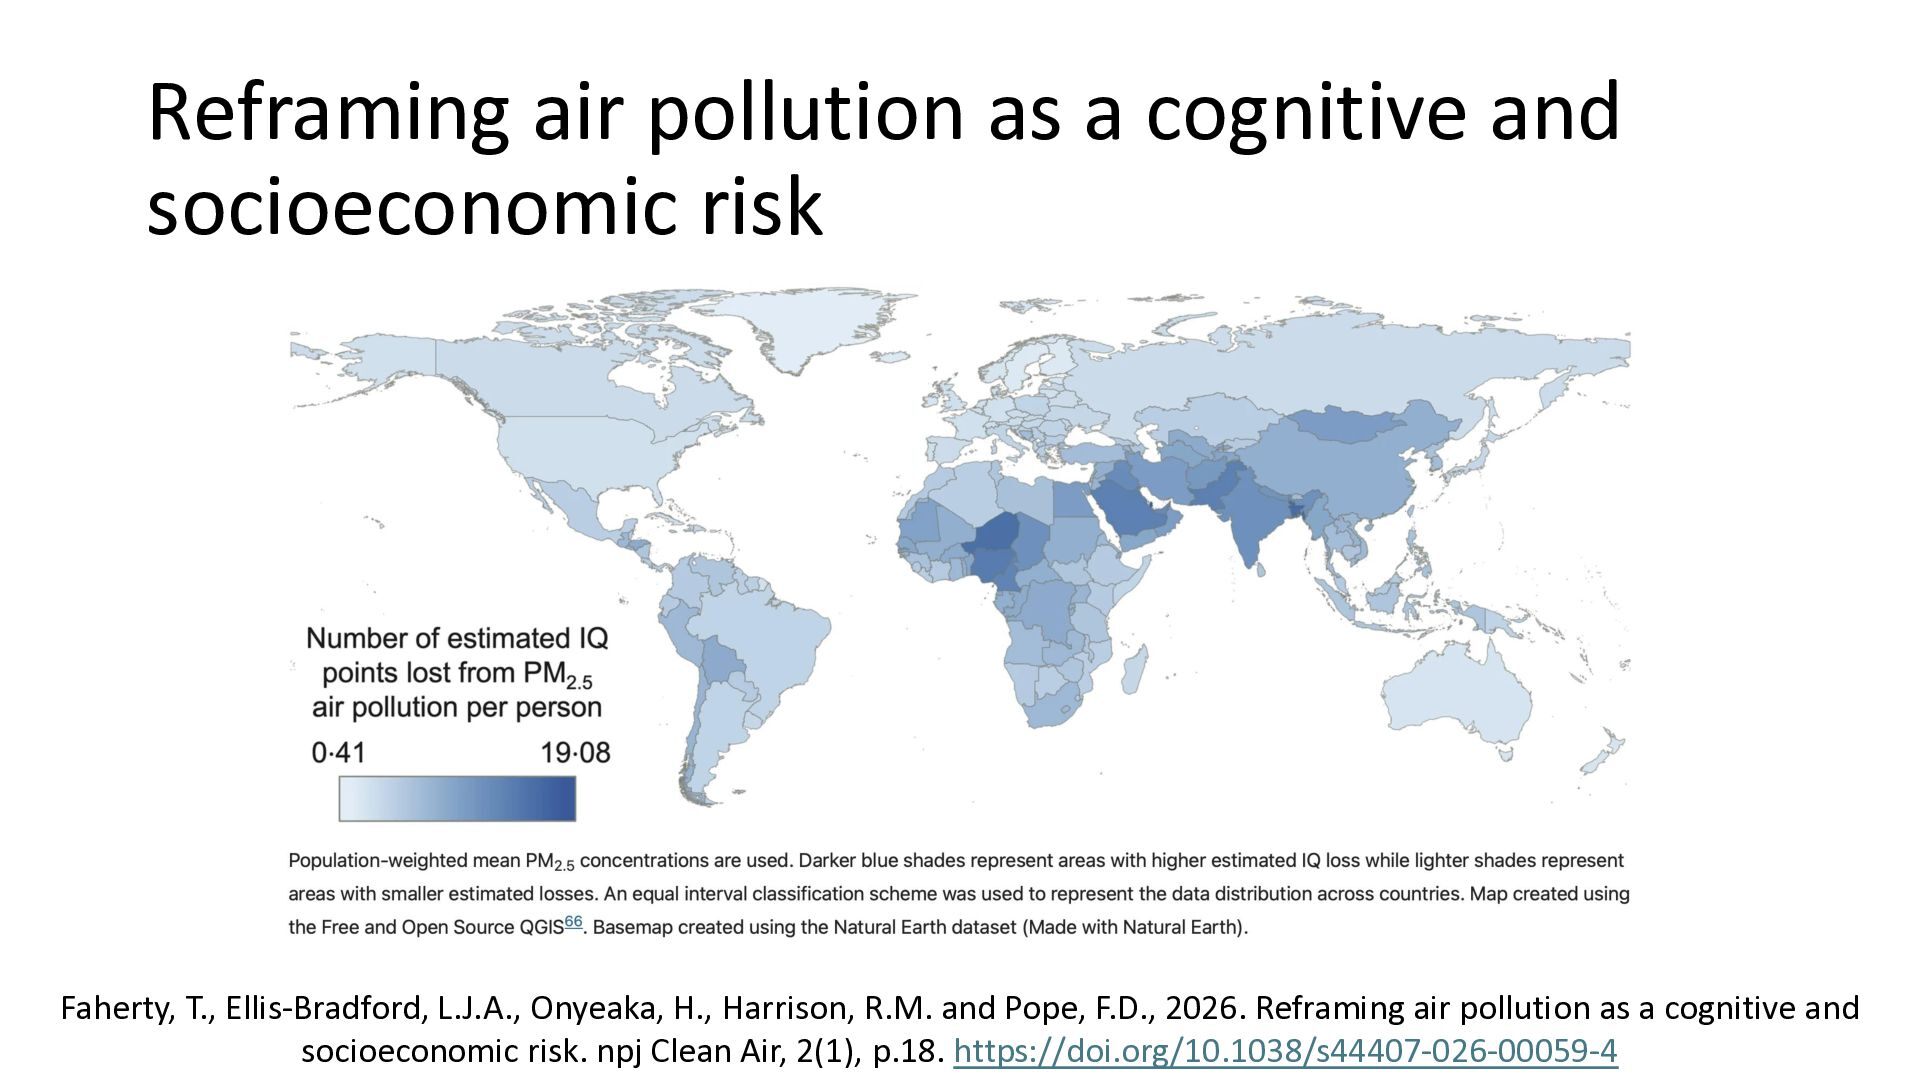
causes a range of adverse effects upon human health • Worldwide ca. 4 to 9 million premature deaths per year – with many in Asian and African countries • Mechanisms of toxic action include the following: (a) Effects on the respiratory system. (b) Effects via the cardiovascular system. (c) Several common air pollutants are known to be carcinogenic (d) Effects on cognition and mental health
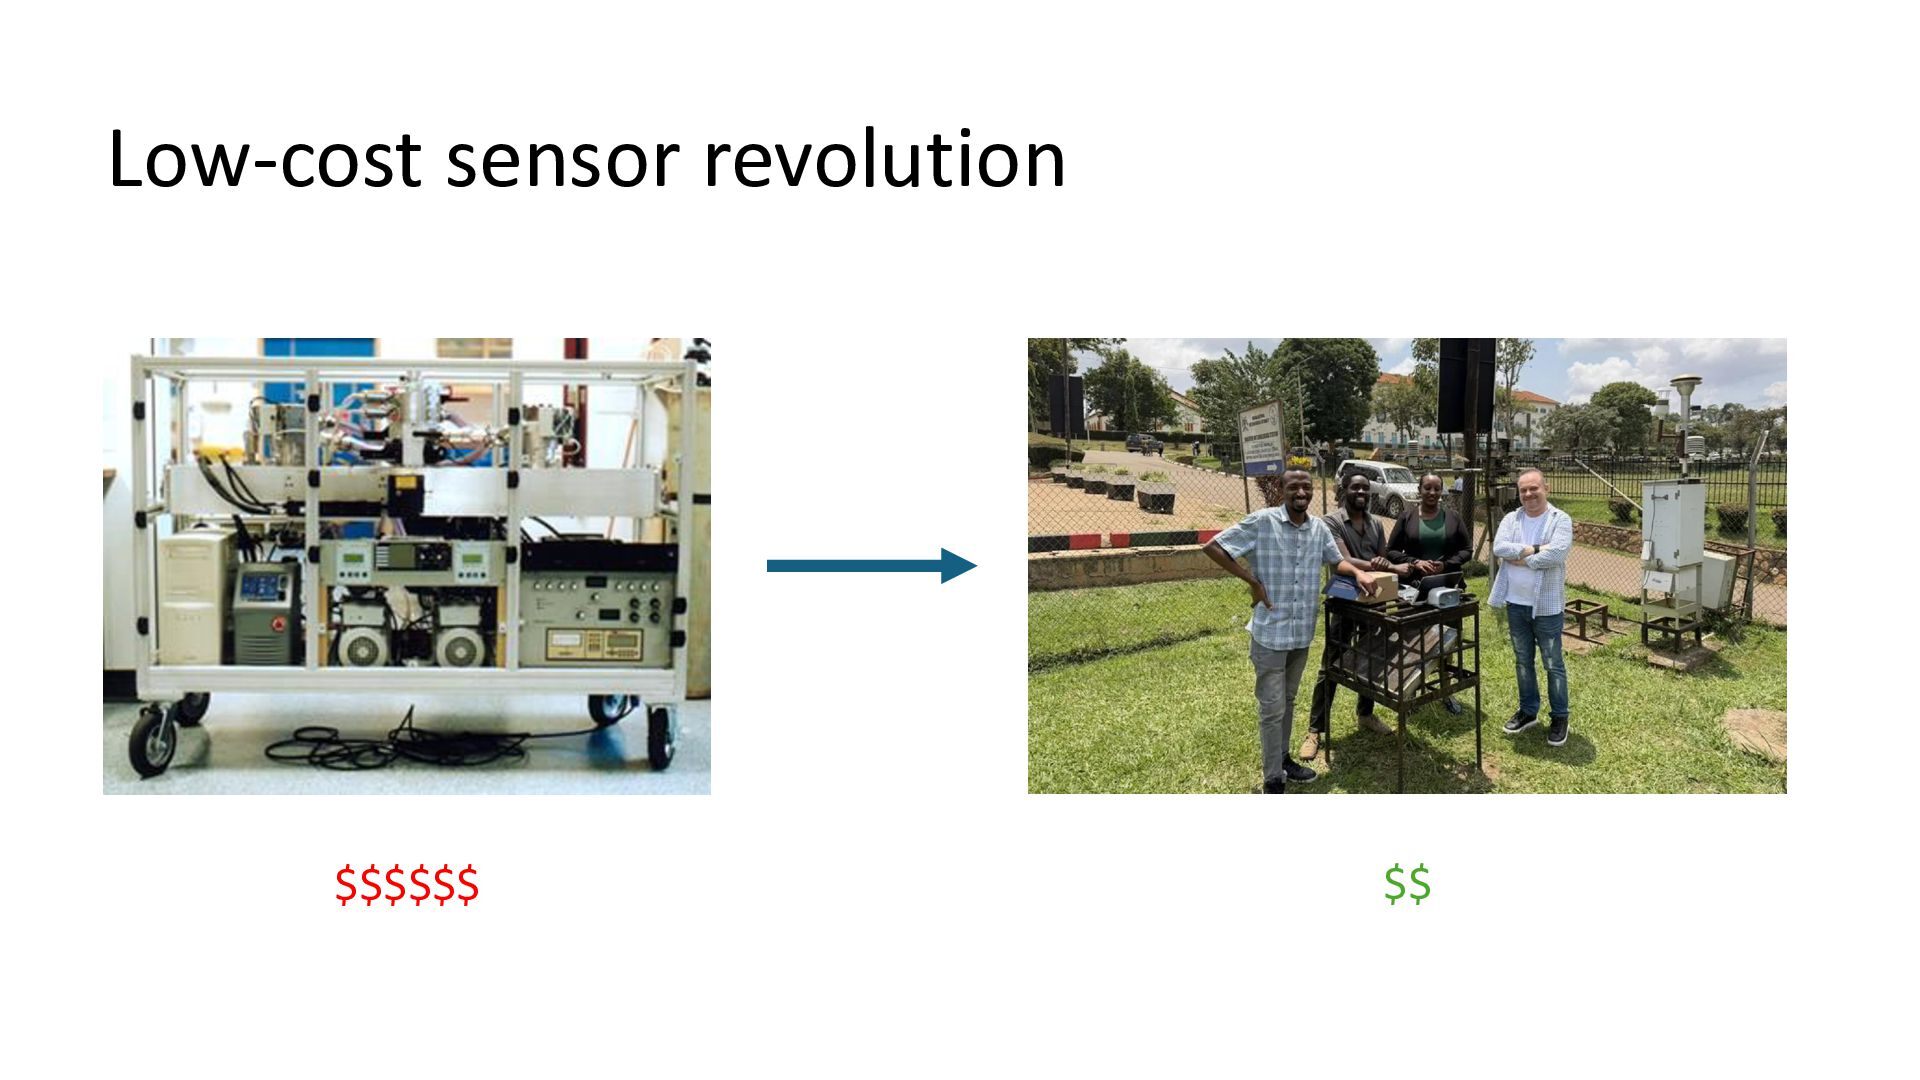
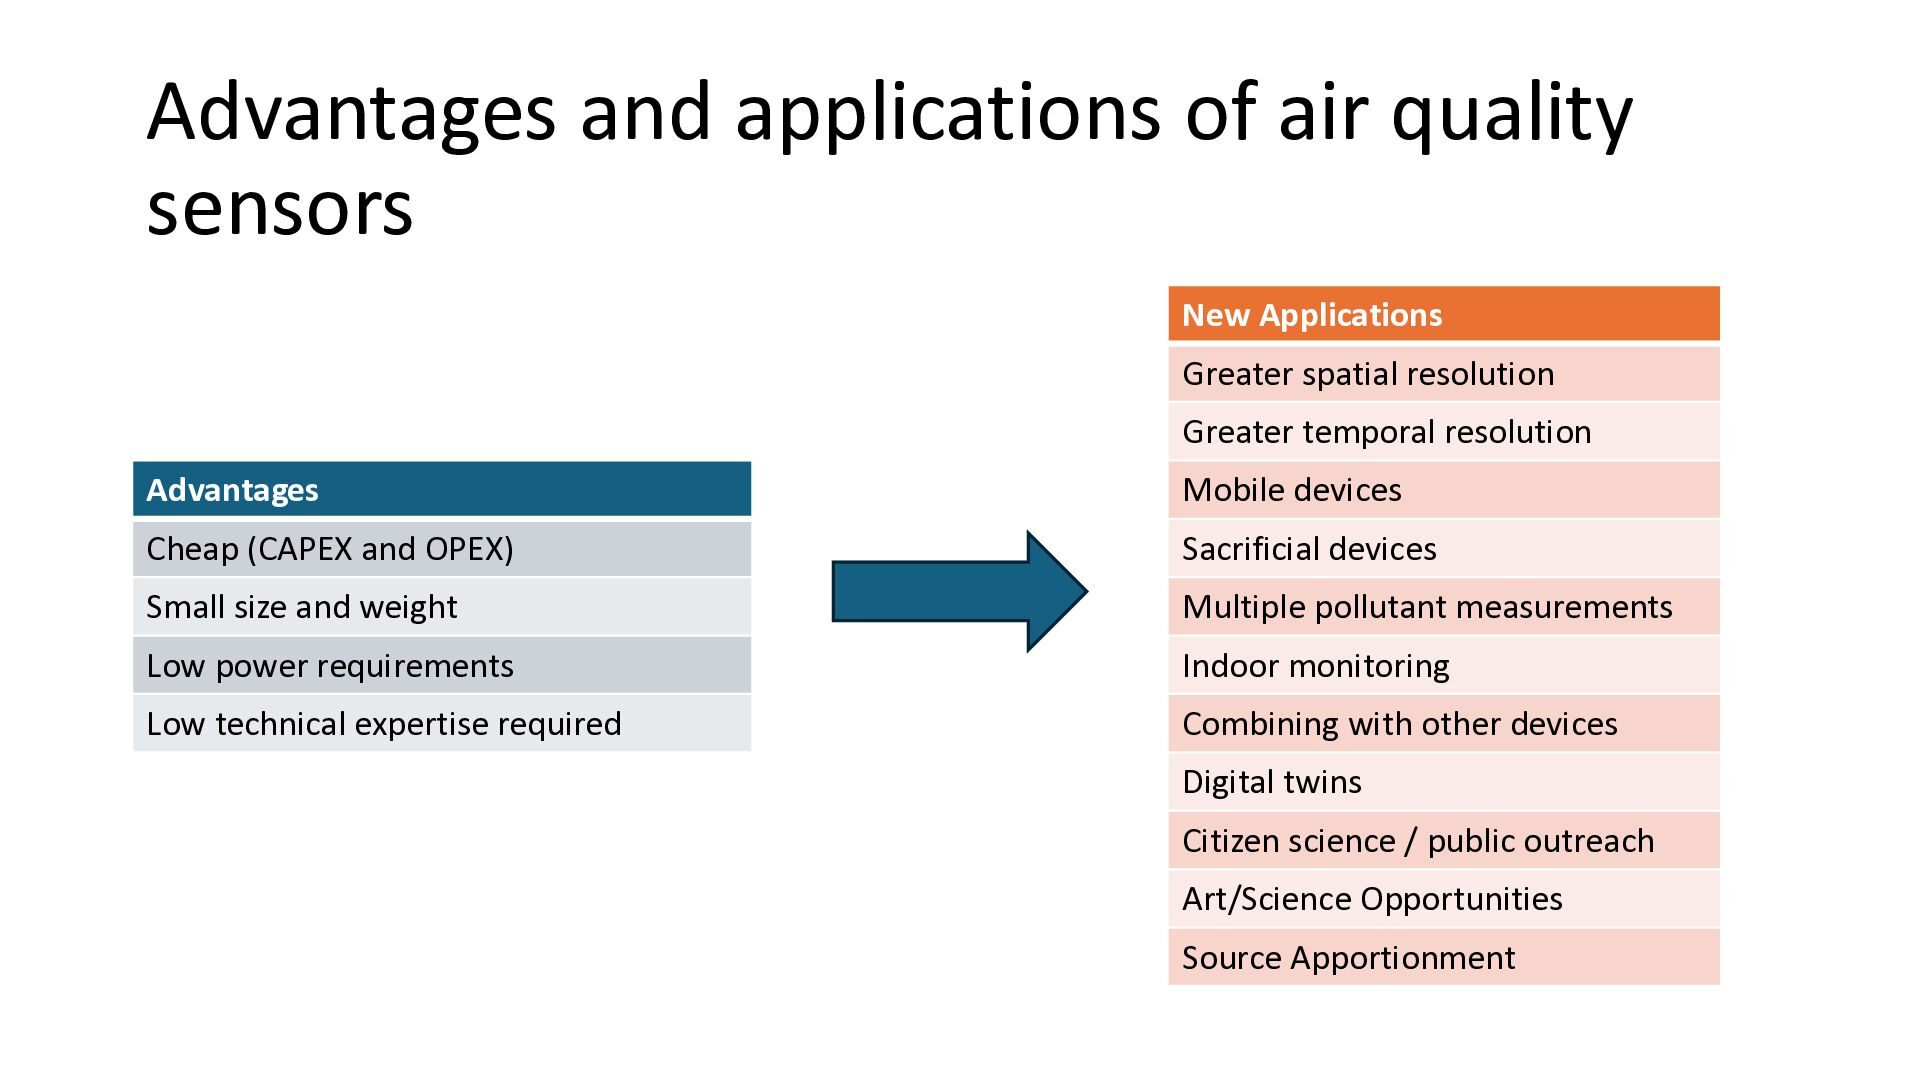
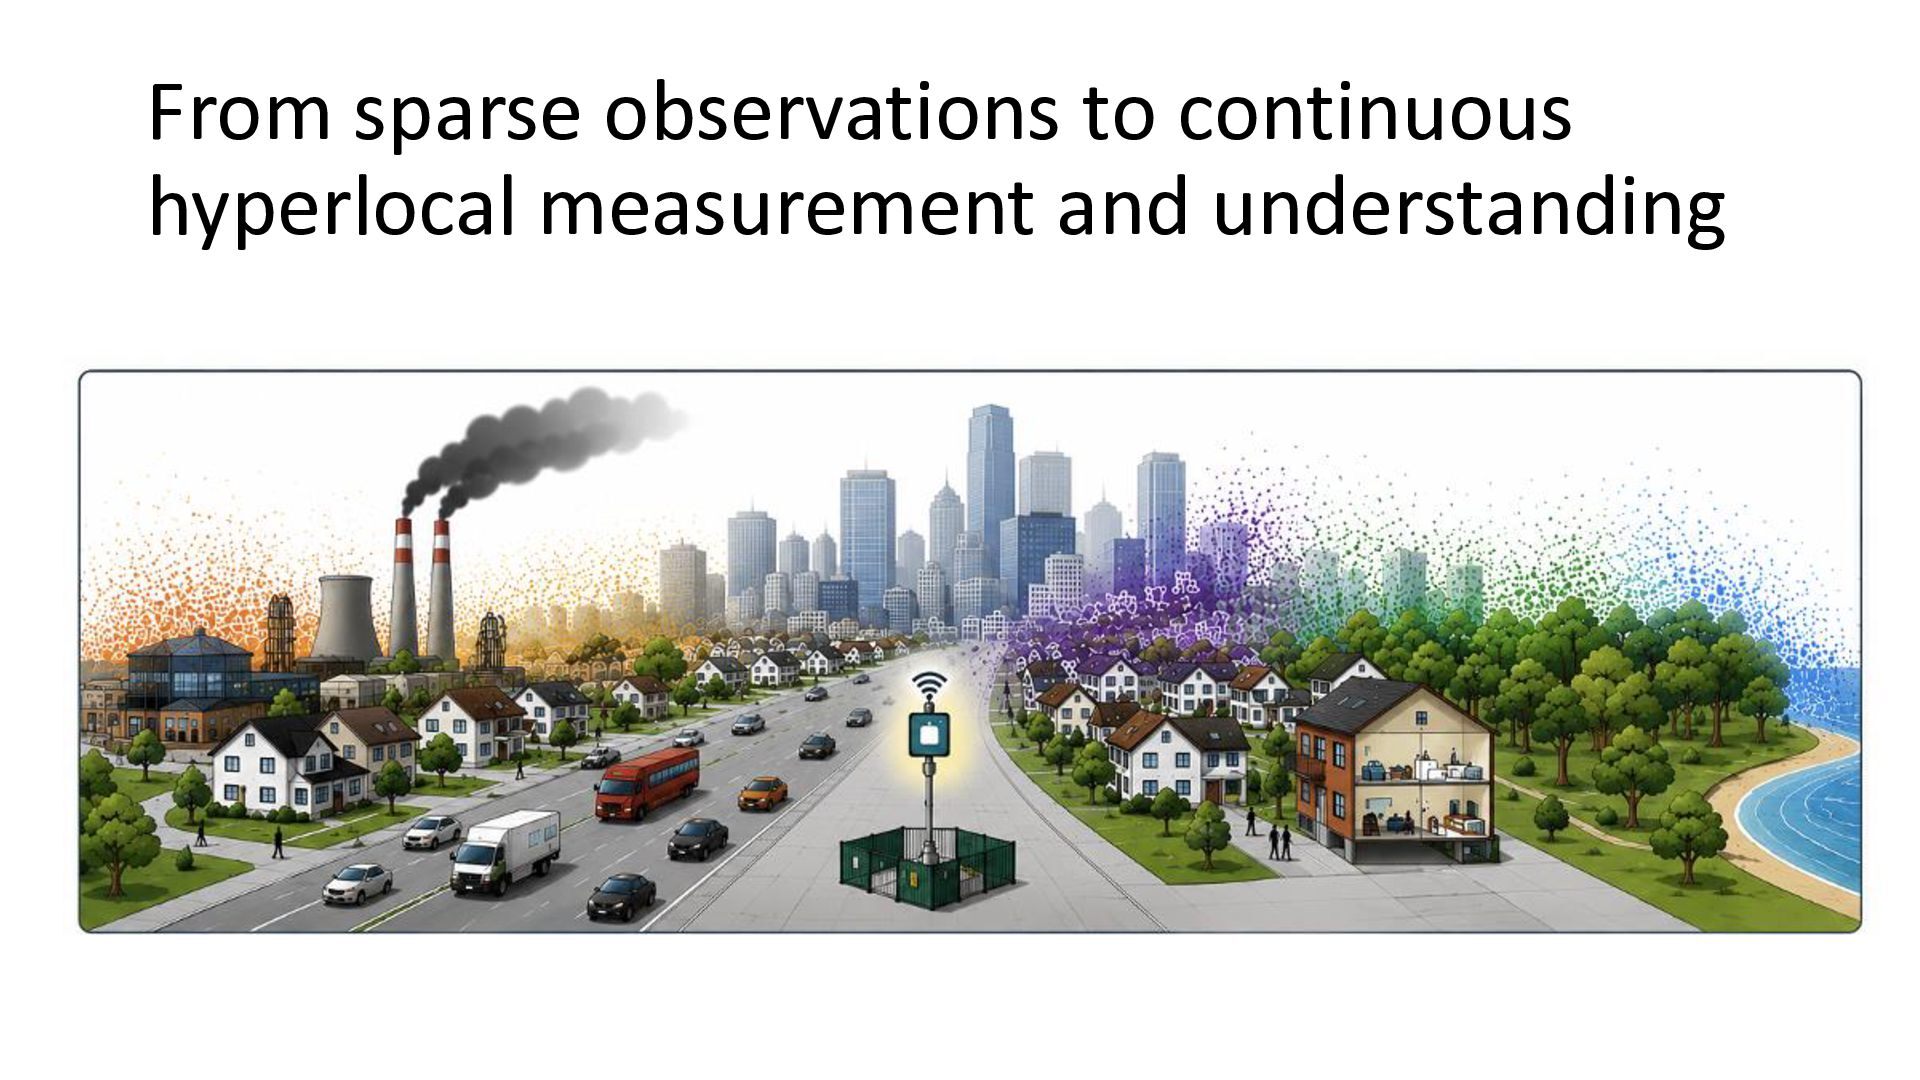
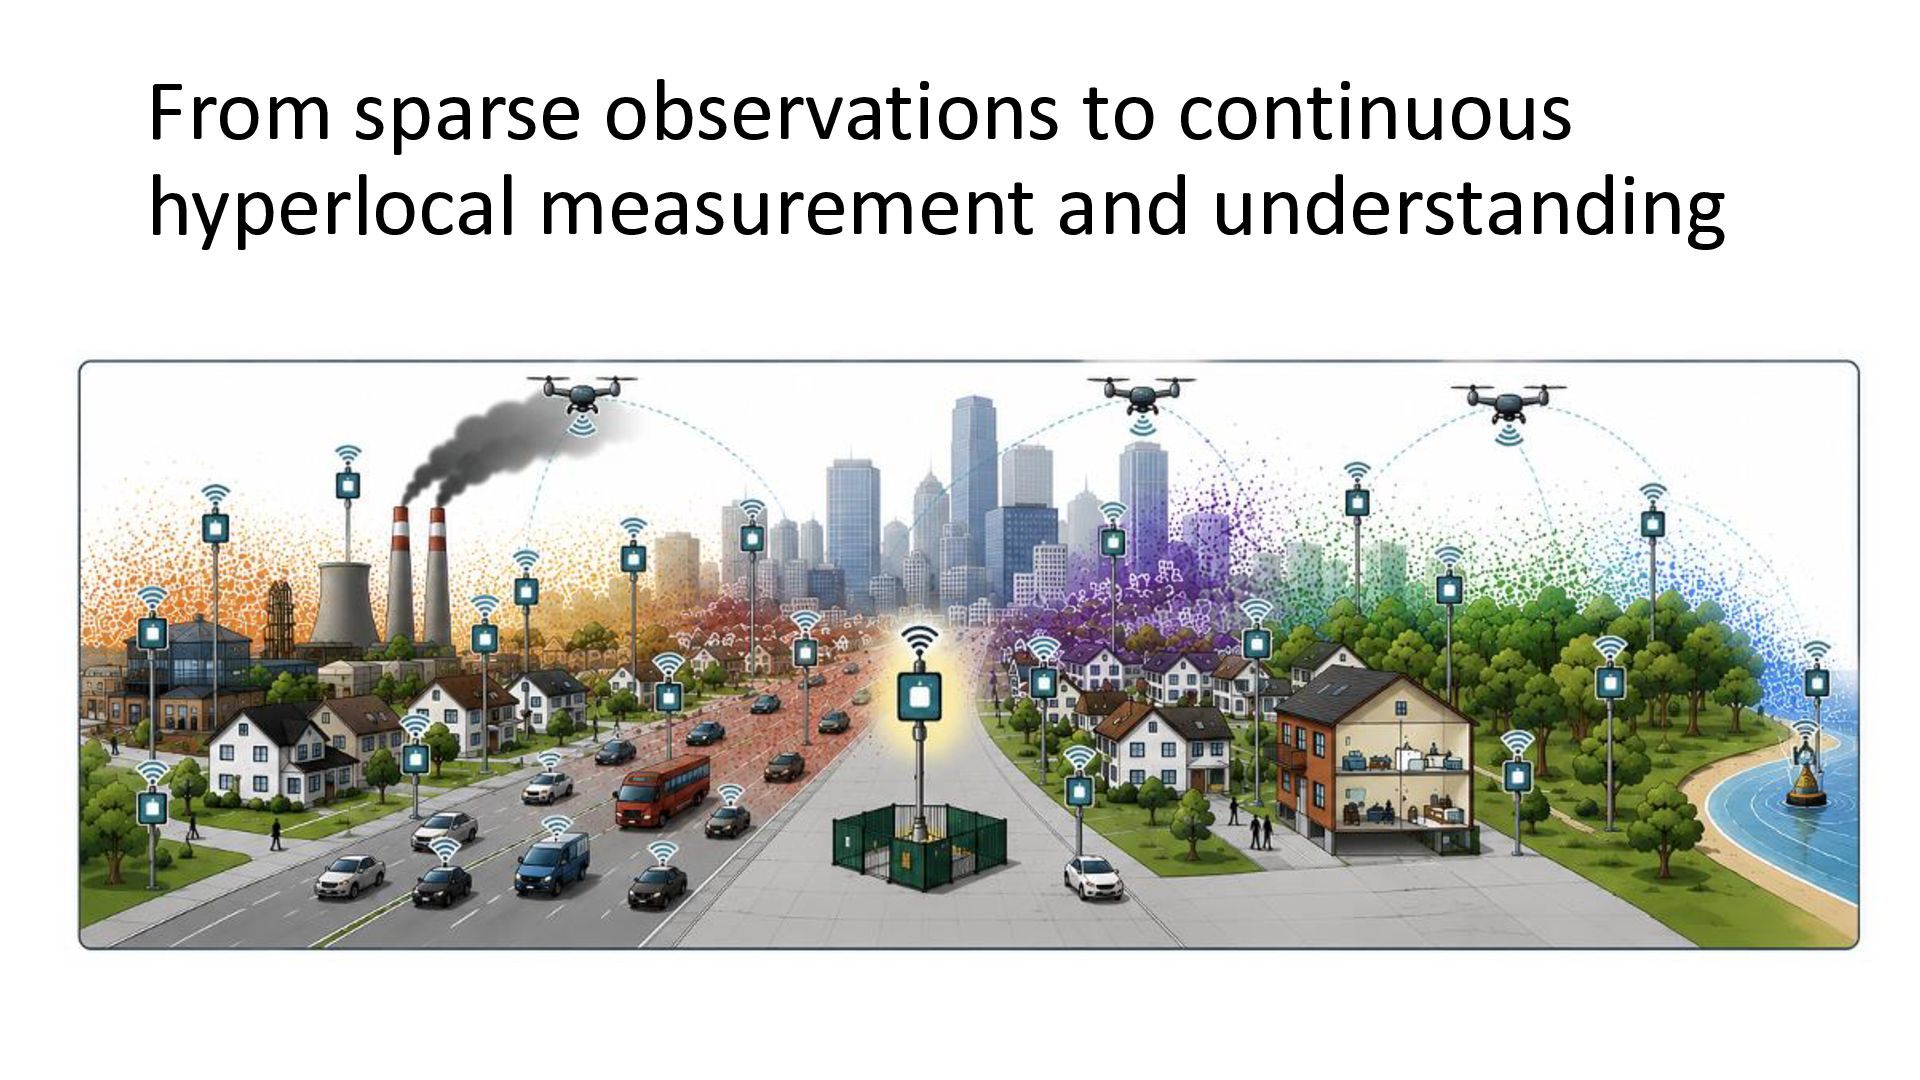
spatial resolution Greater temporal resolution Advantages Mobile devices Cheap (CAPEX and OPEX) Sacrificial devices Small size and weight Multiple pollutant measurements Low power requirements Indoor monitoring Low technical expertise required Combining with other devices Digital twins Citizen science / public outreach Art/Science Opportunities Source Apportionment
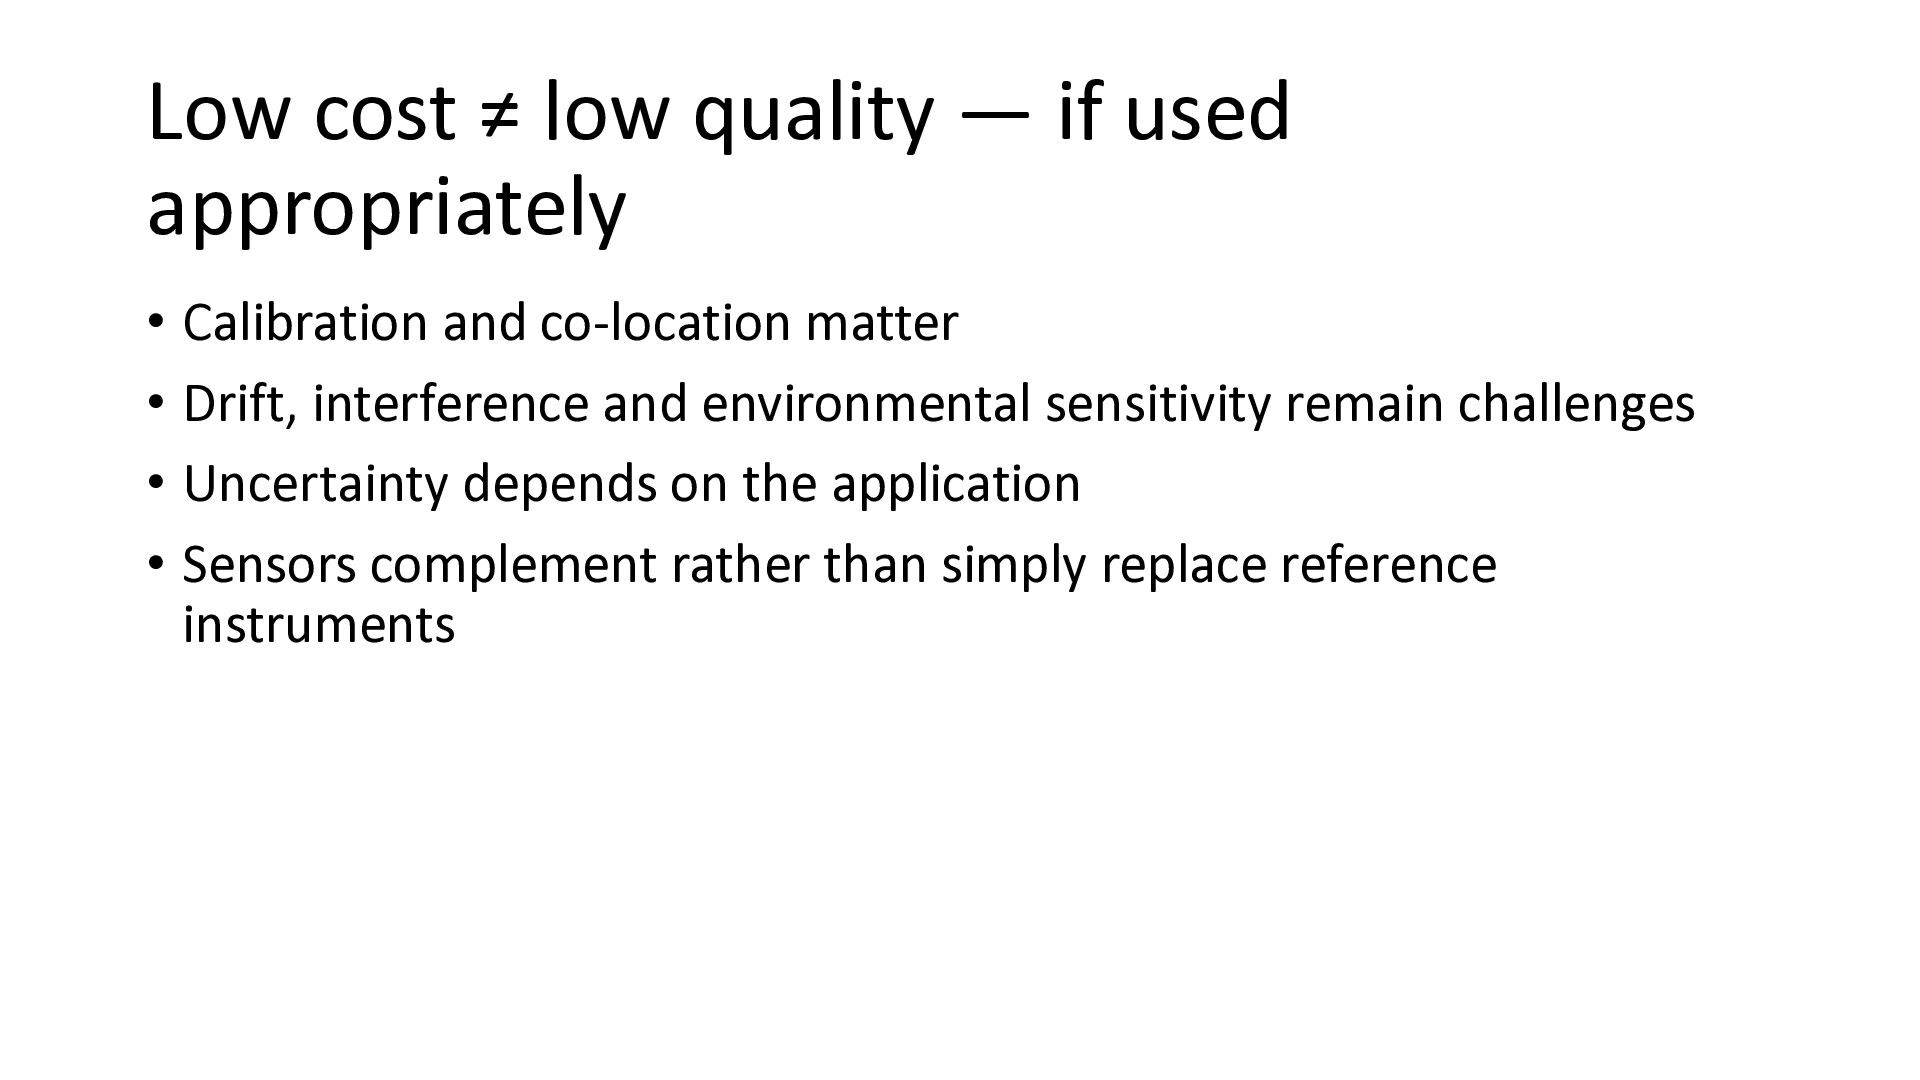
Calibration and co-location matter • Drift, interference and environmental sensitivity remain challenges • Uncertainty depends on the application • Sensors complement rather than simply replace reference instruments
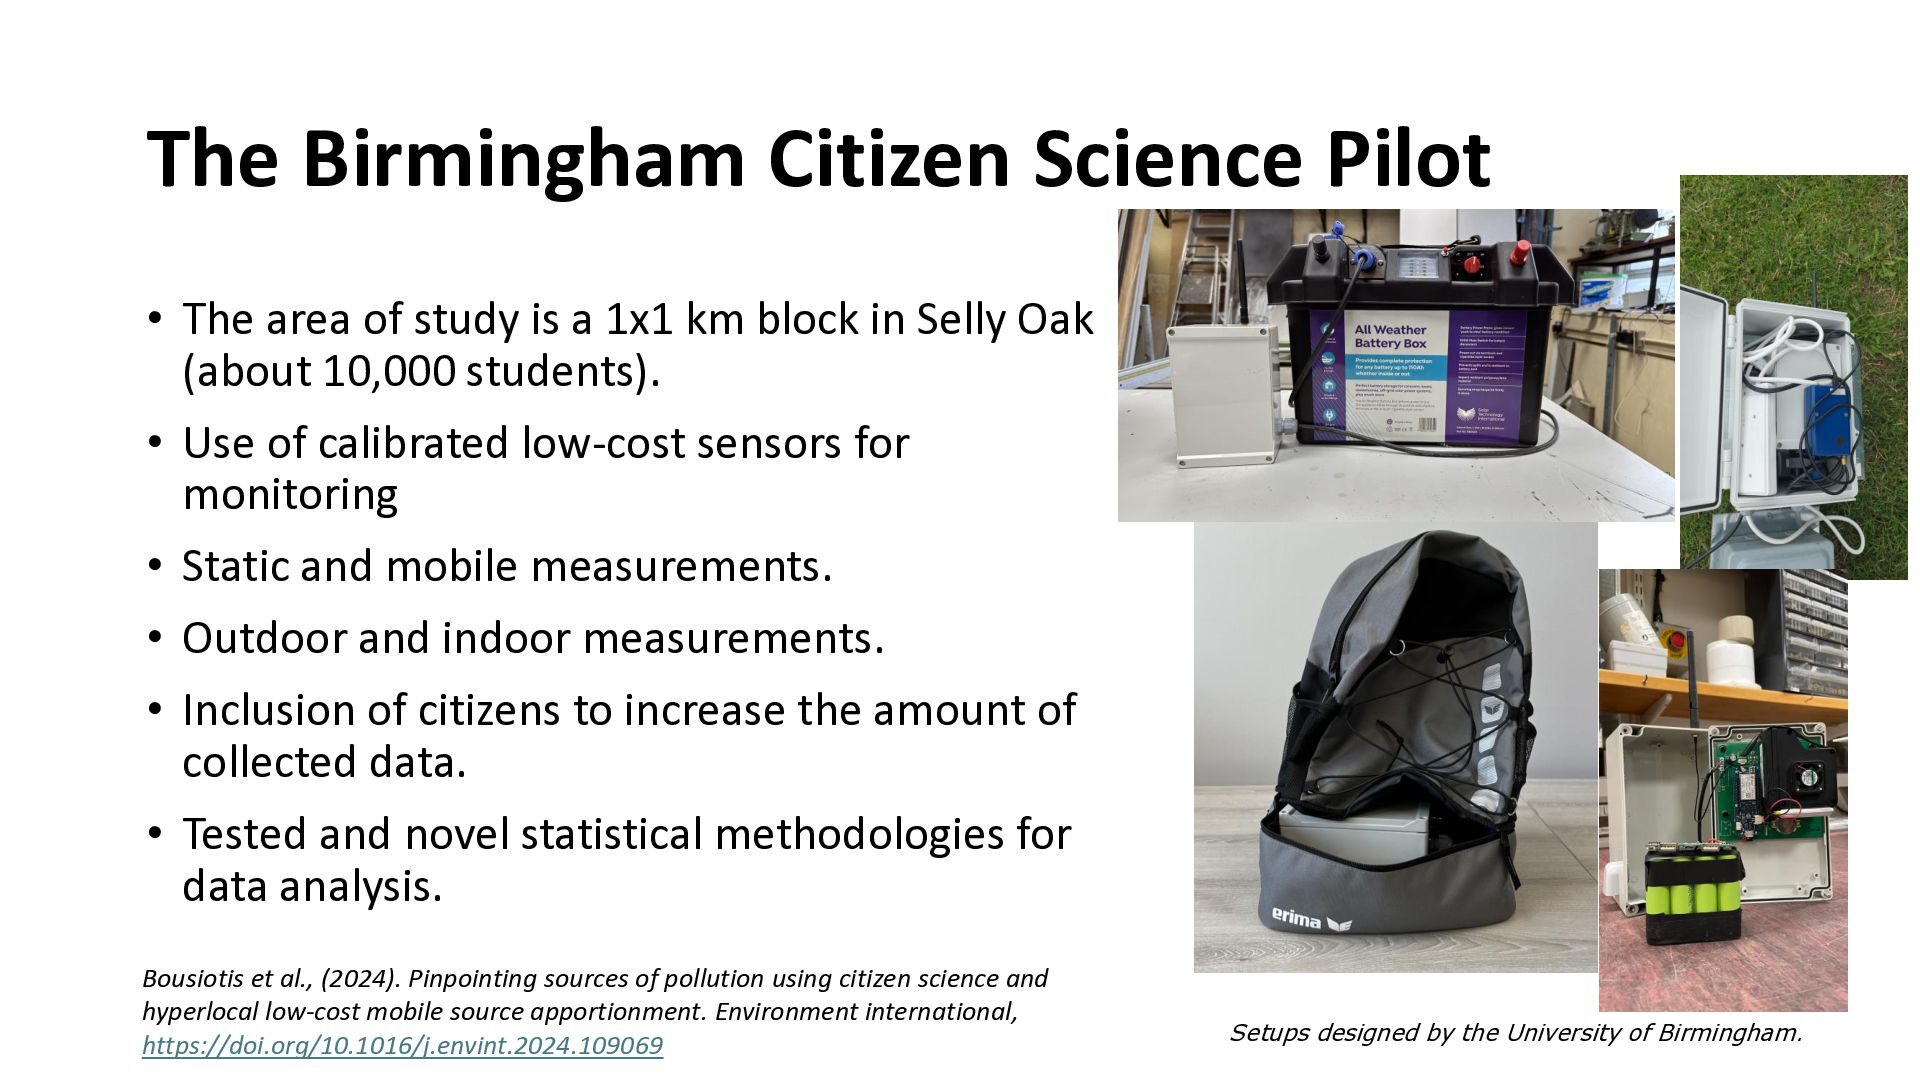
is a 1x1 km block in Selly Oak (about 10,000 students). • Use of calibrated low-cost sensors for monitoring • Static and mobile measurements. • Outdoor and indoor measurements. • Inclusion of citizens to increase the amount of collected data. • Tested and novel statistical methodologies for data analysis. Bousiotis et al., (2024). Pinpointing sources of pollution using citizen science and hyperlocal low-cost mobile source apportionment. Environment international, https://doi.org/10.1016/j.envint.2024.109069 Setups designed by the University of Birmingham.
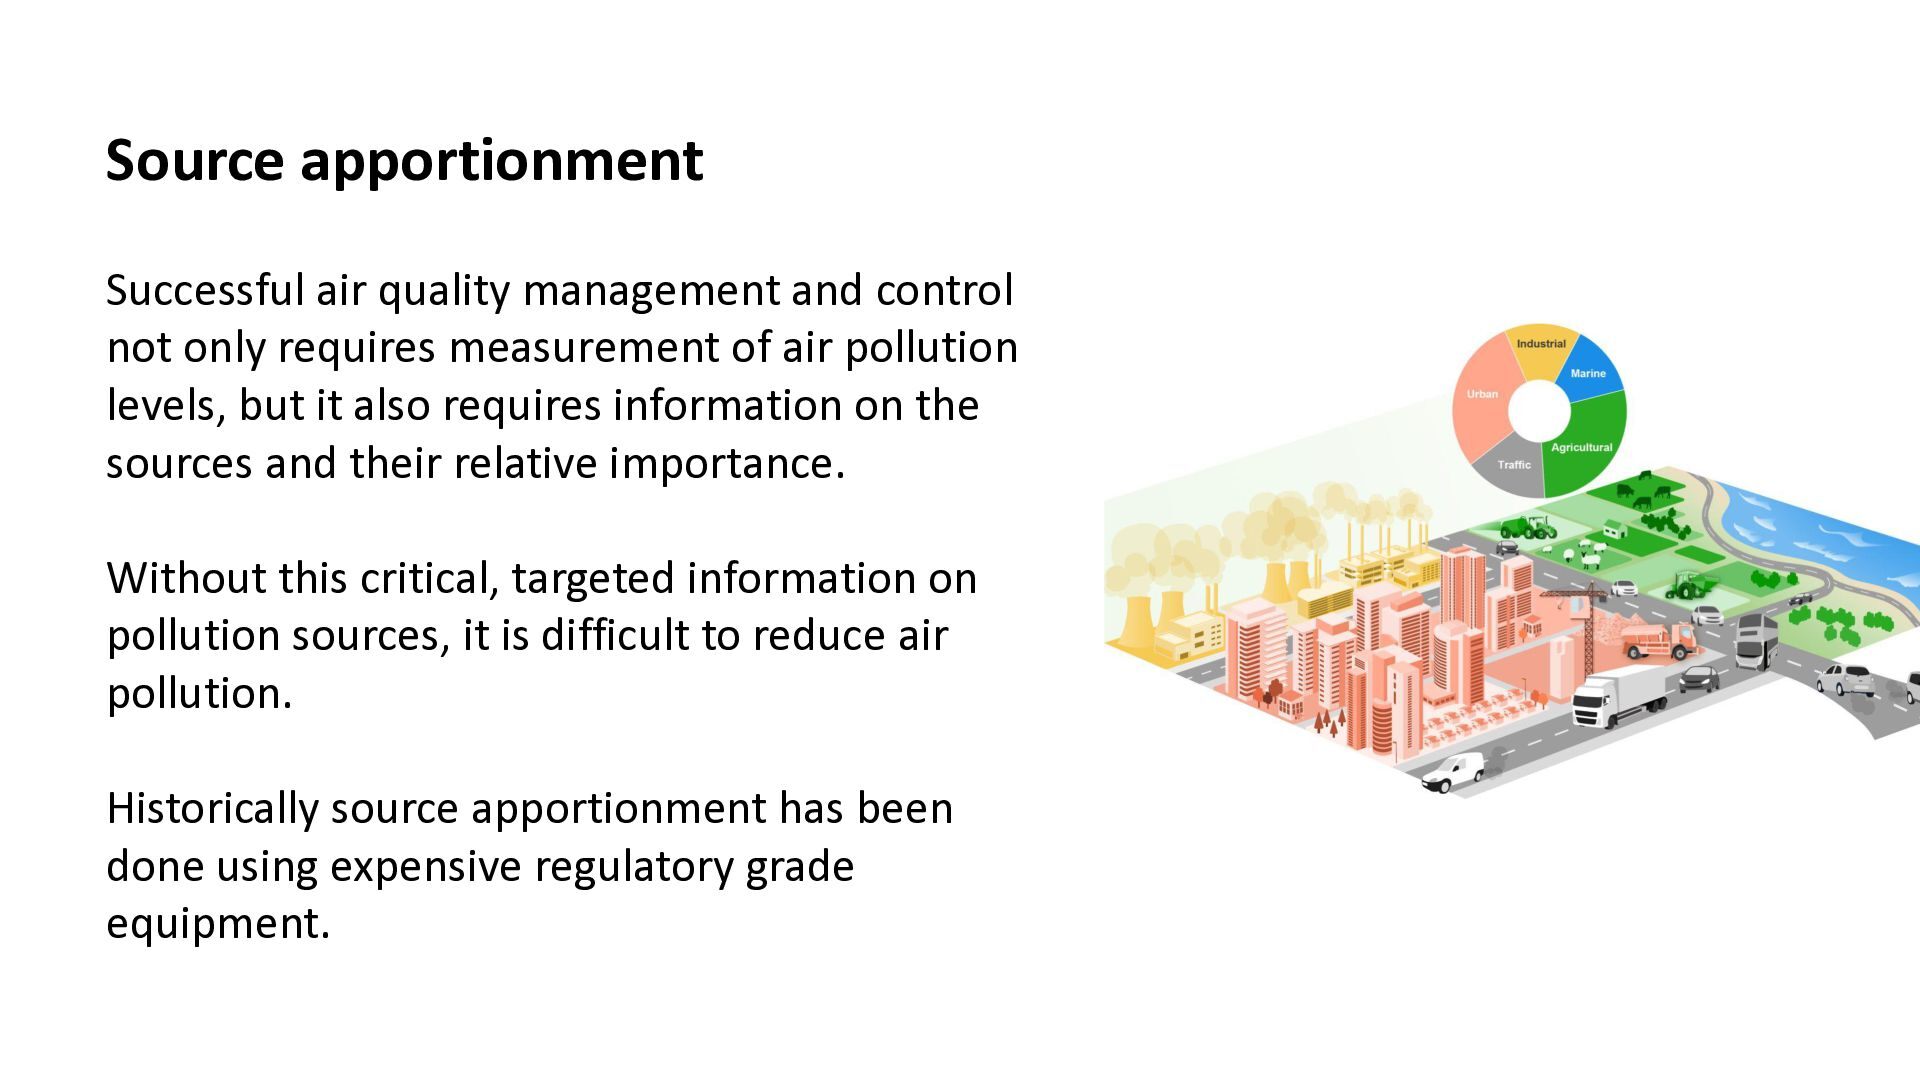
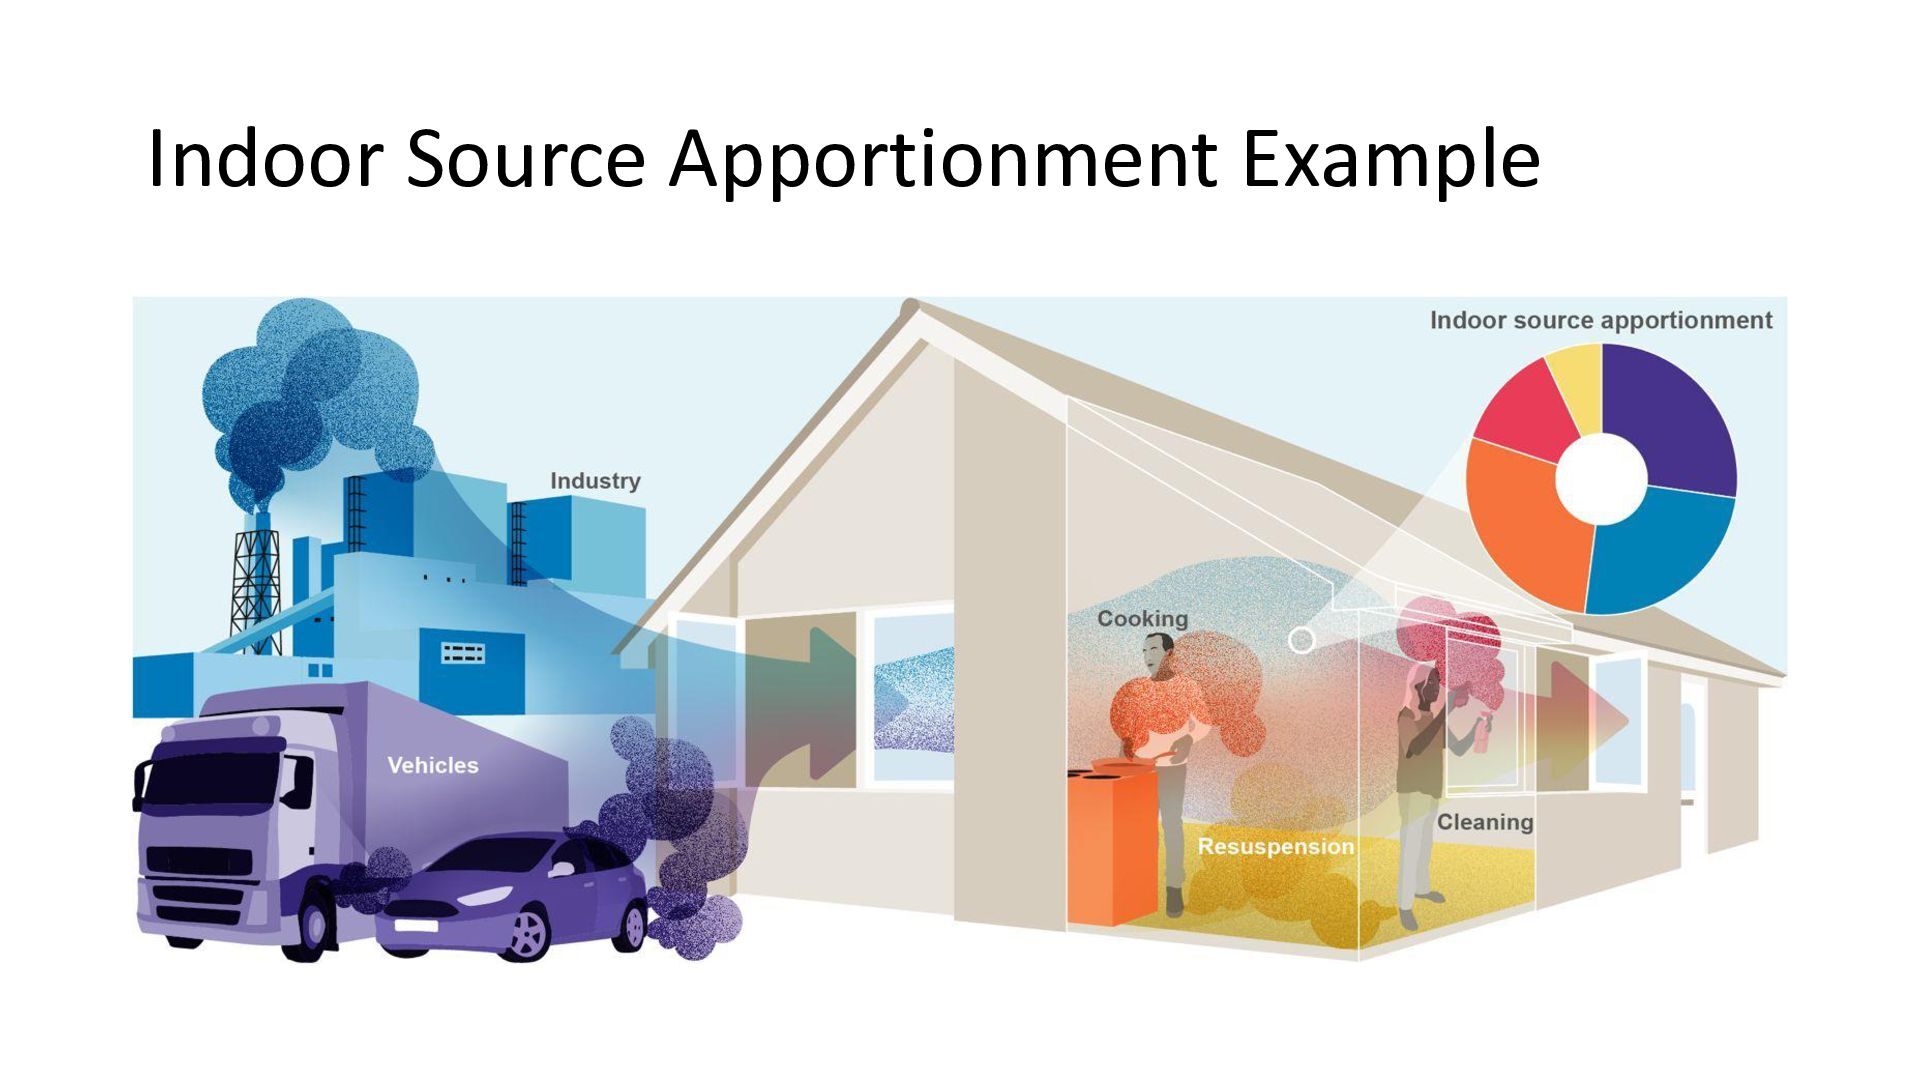
requires measurement of air pollution levels, but it also requires information on the sources and their relative importance. Without this critical, targeted information on pollution sources, it is difficult to reduce air pollution. Historically source apportionment has been done using expensive regulatory grade equipment.
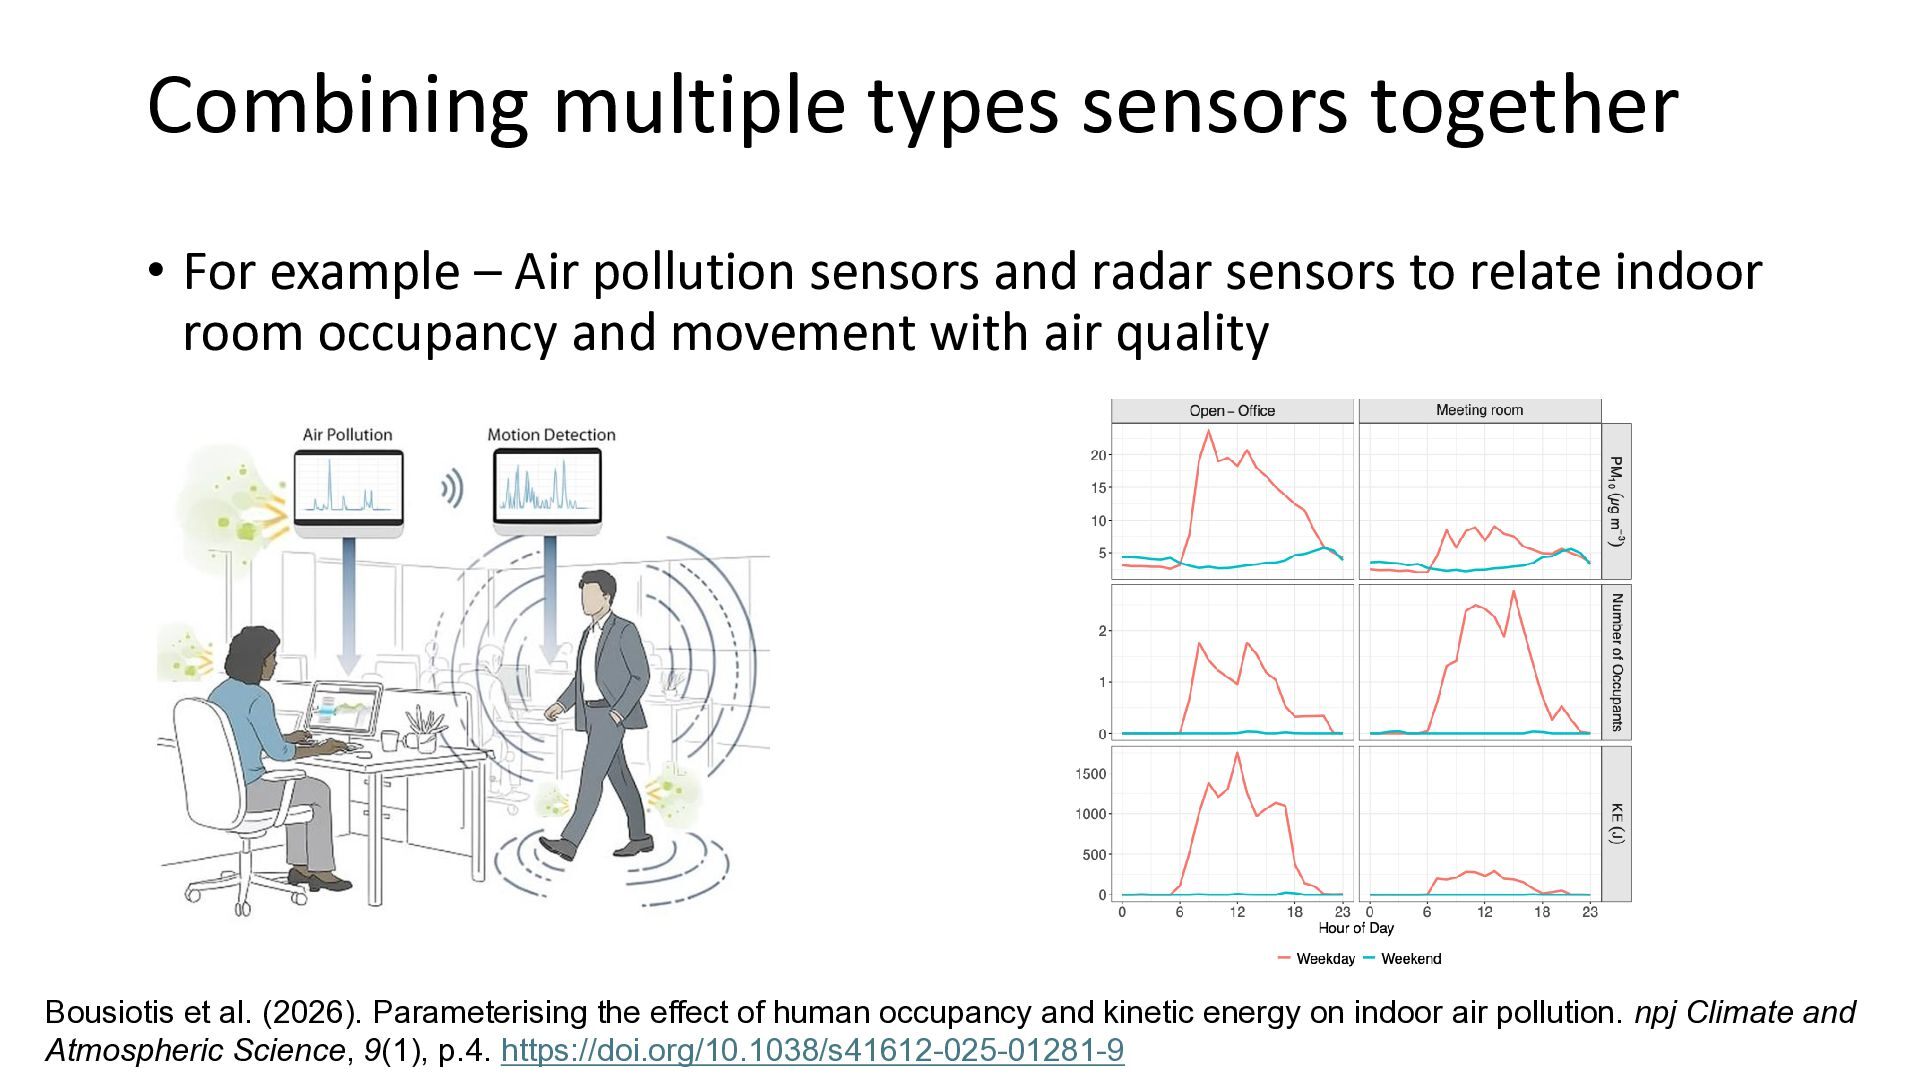
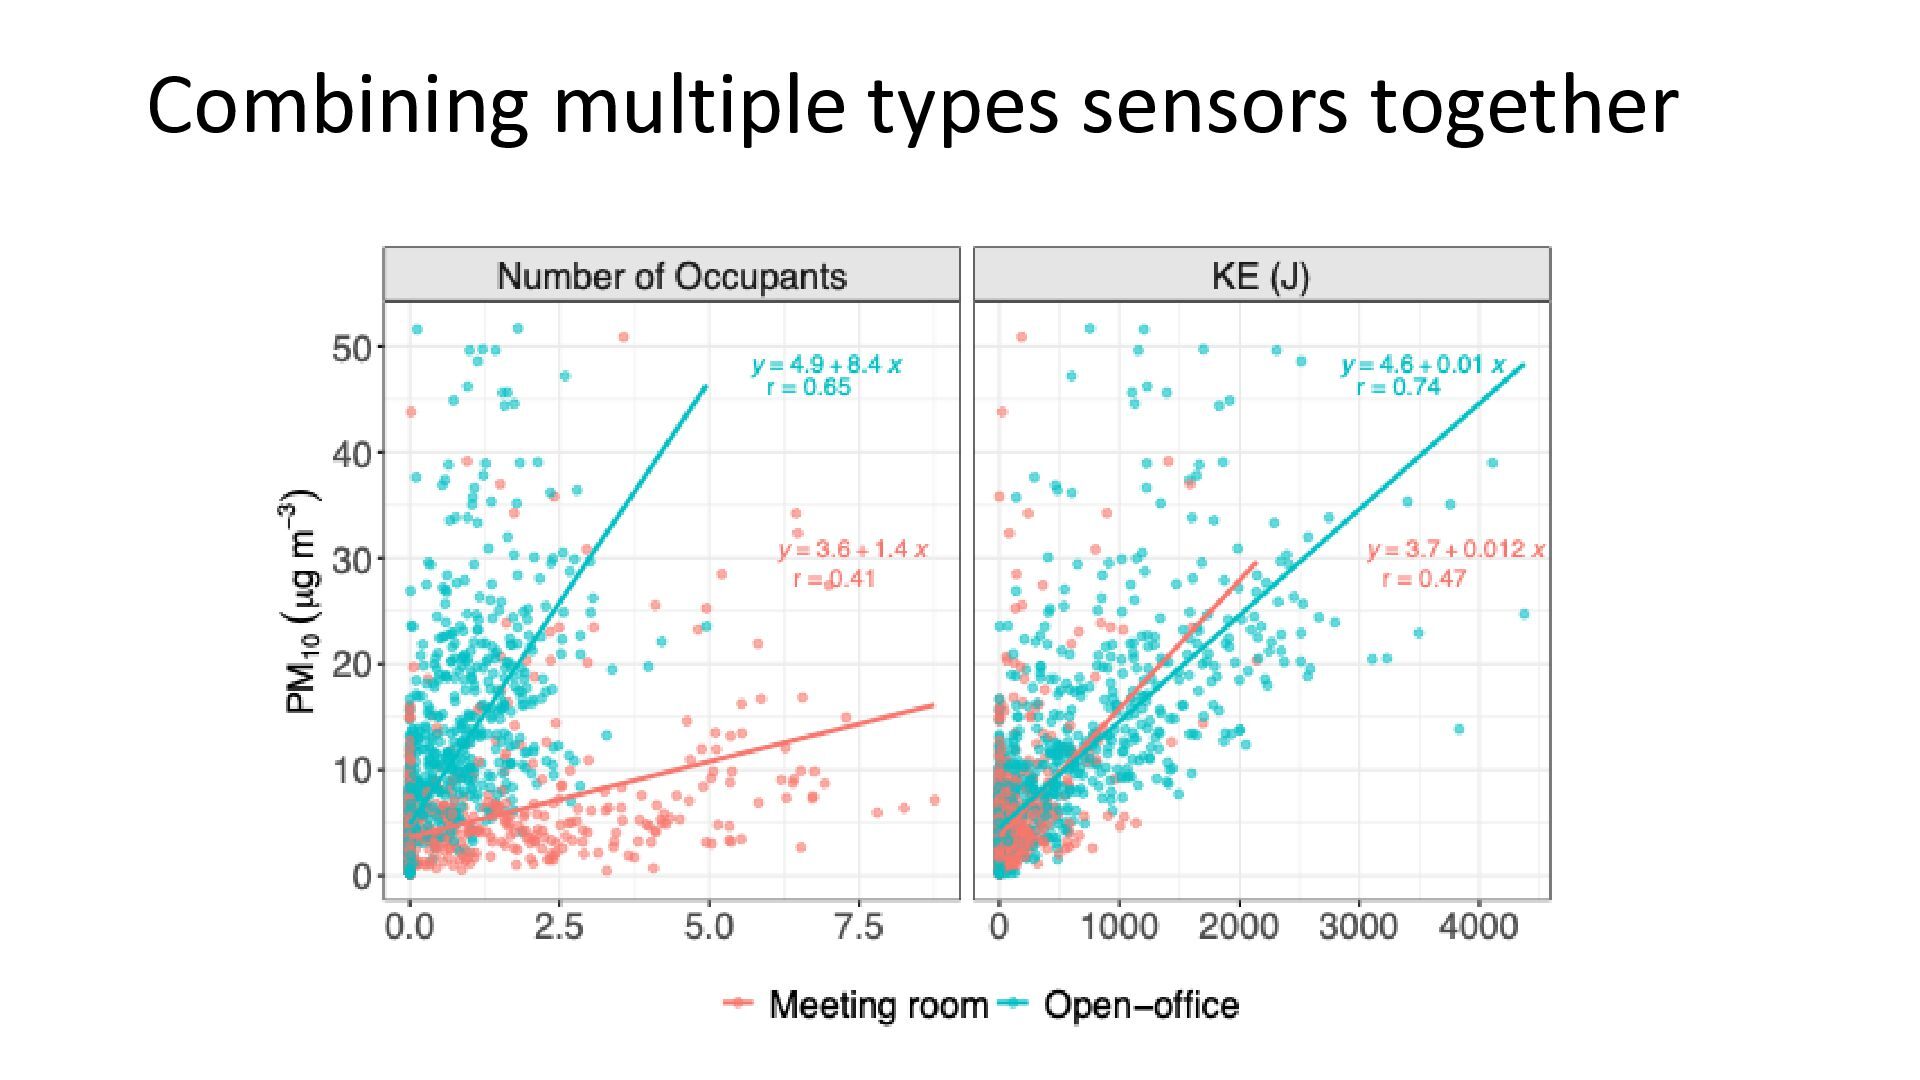
pollution sensors and radar sensors to relate indoor room occupancy and movement with air quality Bousiotis et al. (2026). Parameterising the effect of human occupancy and kinetic energy on indoor air pollution. npj Climate and Atmospheric Science, 9(1), p.4. https://doi.org/10.1038/s41612-025-01281-9
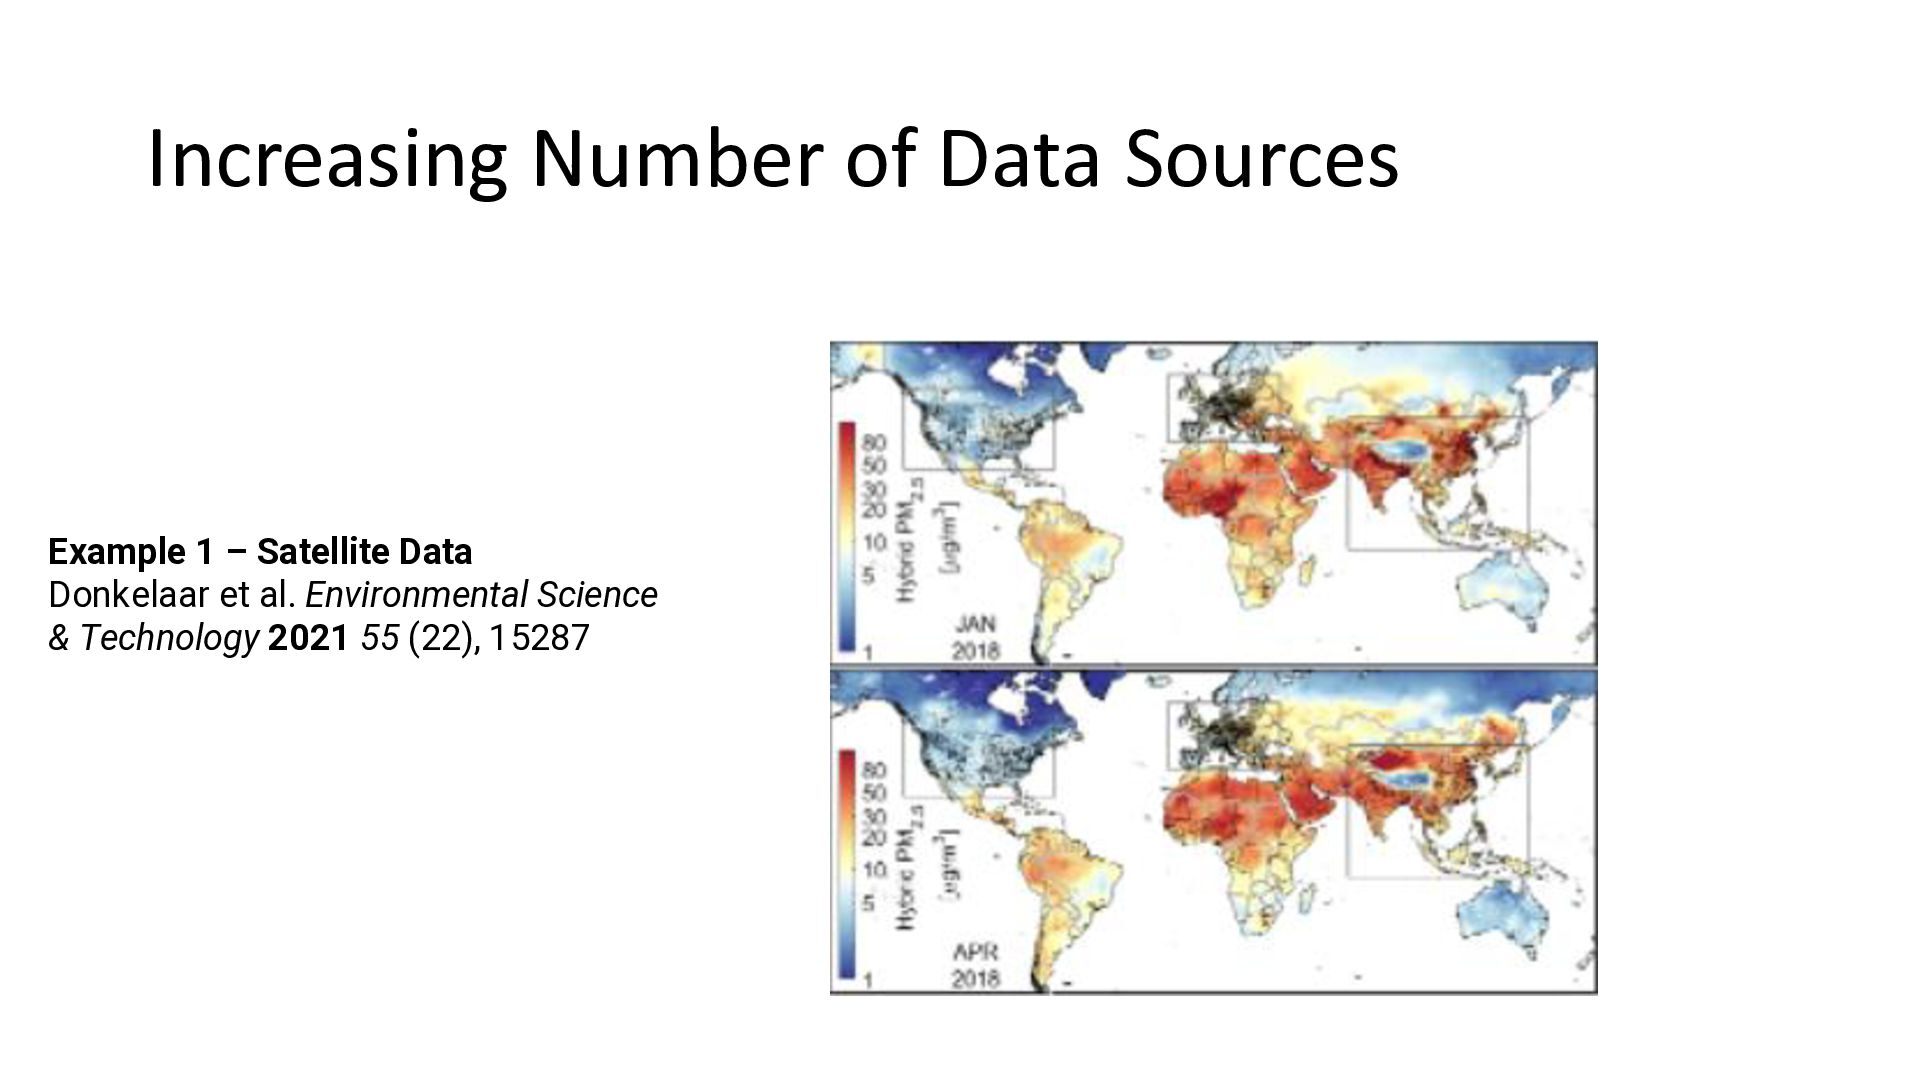
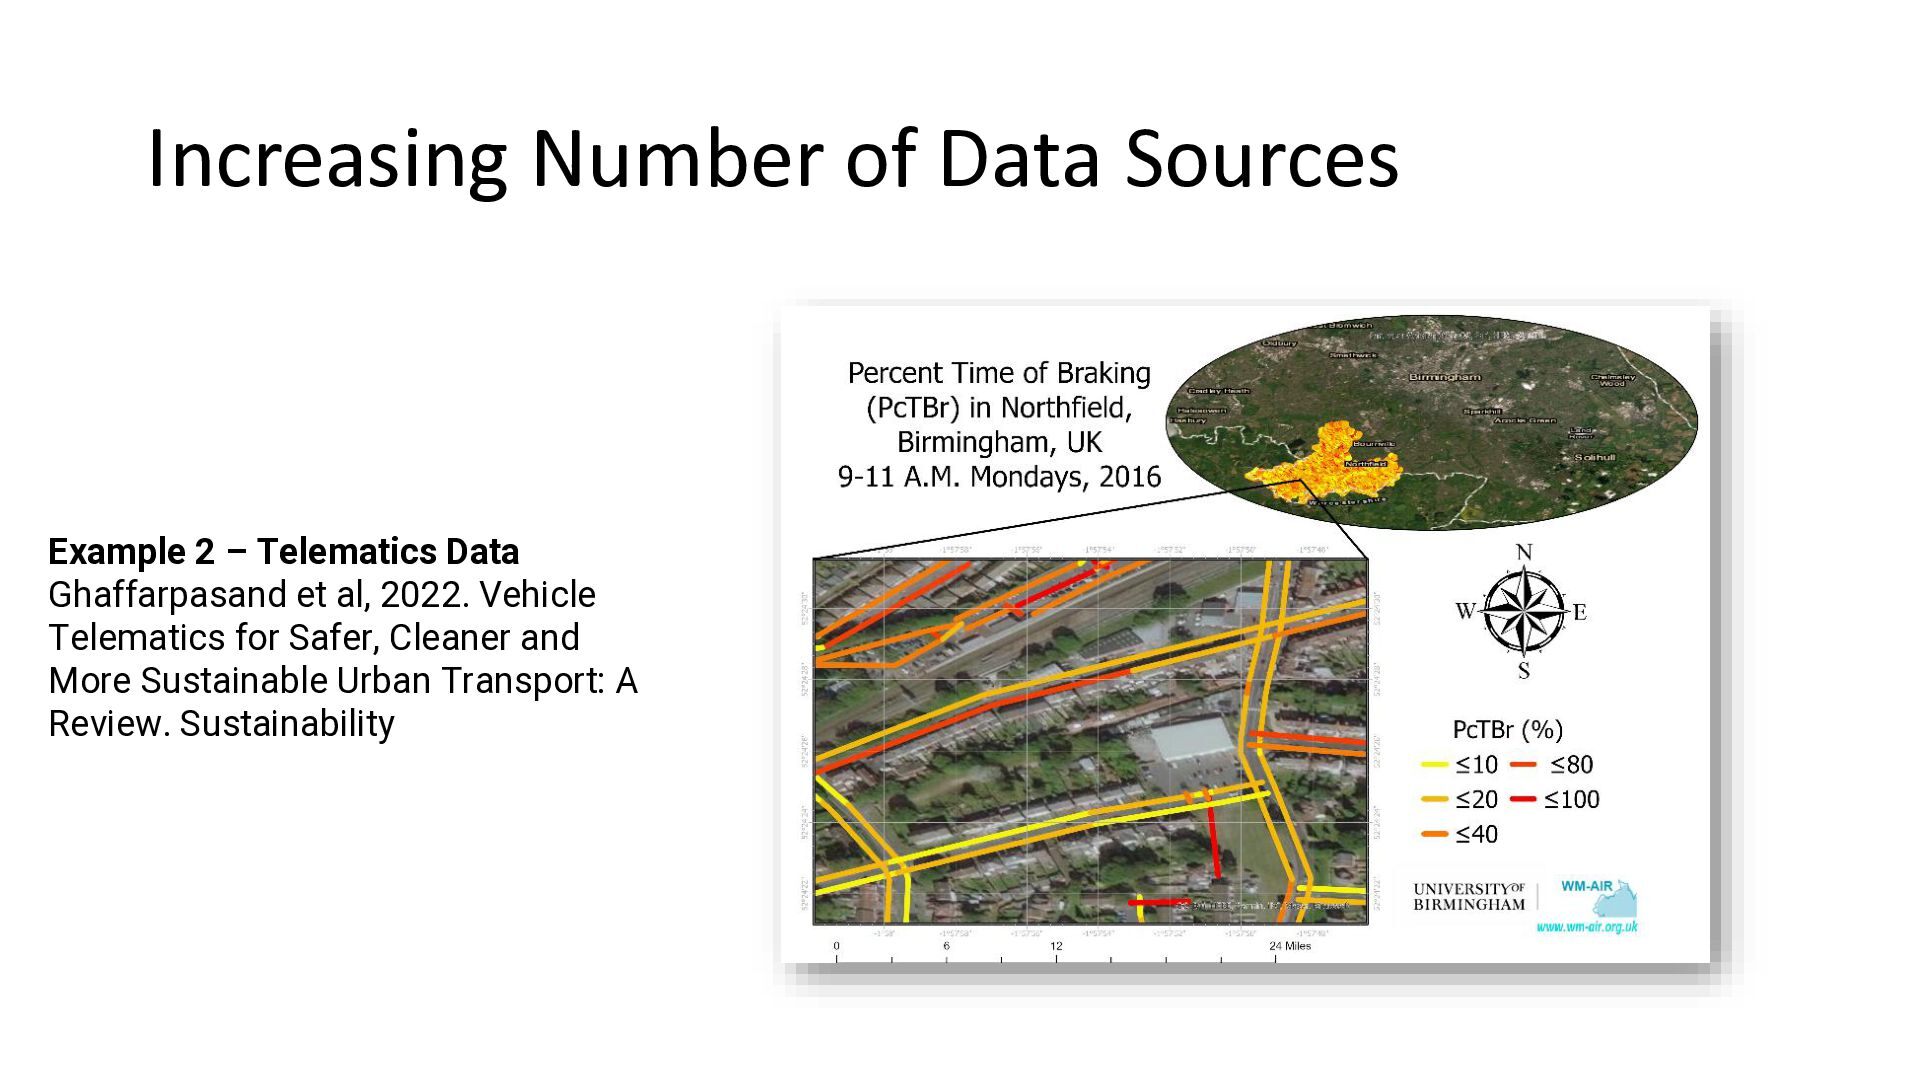
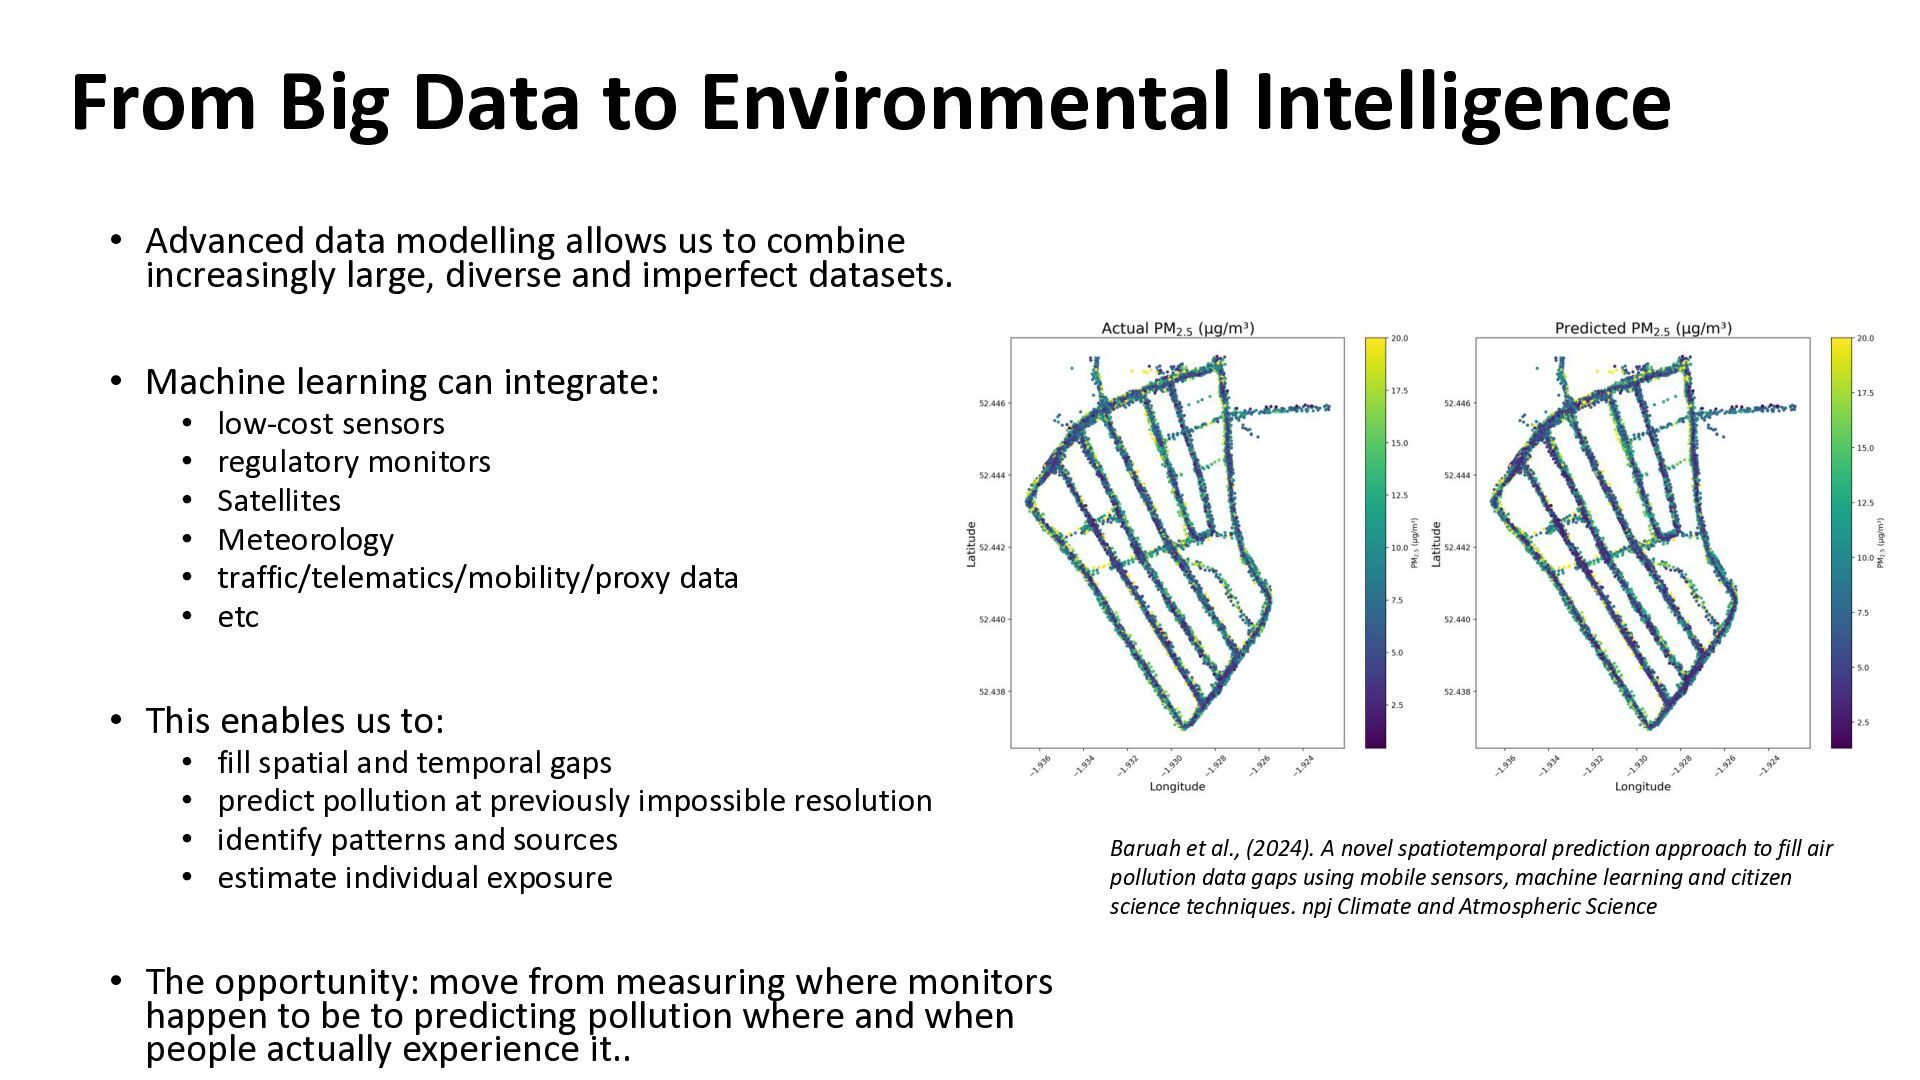
allows us to combine increasingly large, diverse and imperfect datasets. • Machine learning can integrate: • • • • • • low-cost sensors regulatory monitors Satellites Meteorology traffic/telematics/mobility/proxy data etc • This enables us to: • • • • fill spatial and temporal gaps predict pollution at previously impossible resolution identify patterns and sources estimate individual exposure • The opportunity: move from measuring where monitors happen to be to predicting pollution where and when people actually experience it.. Baruah et al., (2024). A novel spatiotemporal prediction approach to fill air pollution data gaps using mobile sensors, machine learning and citizen science techniques. npj Climate and Atmospheric Science
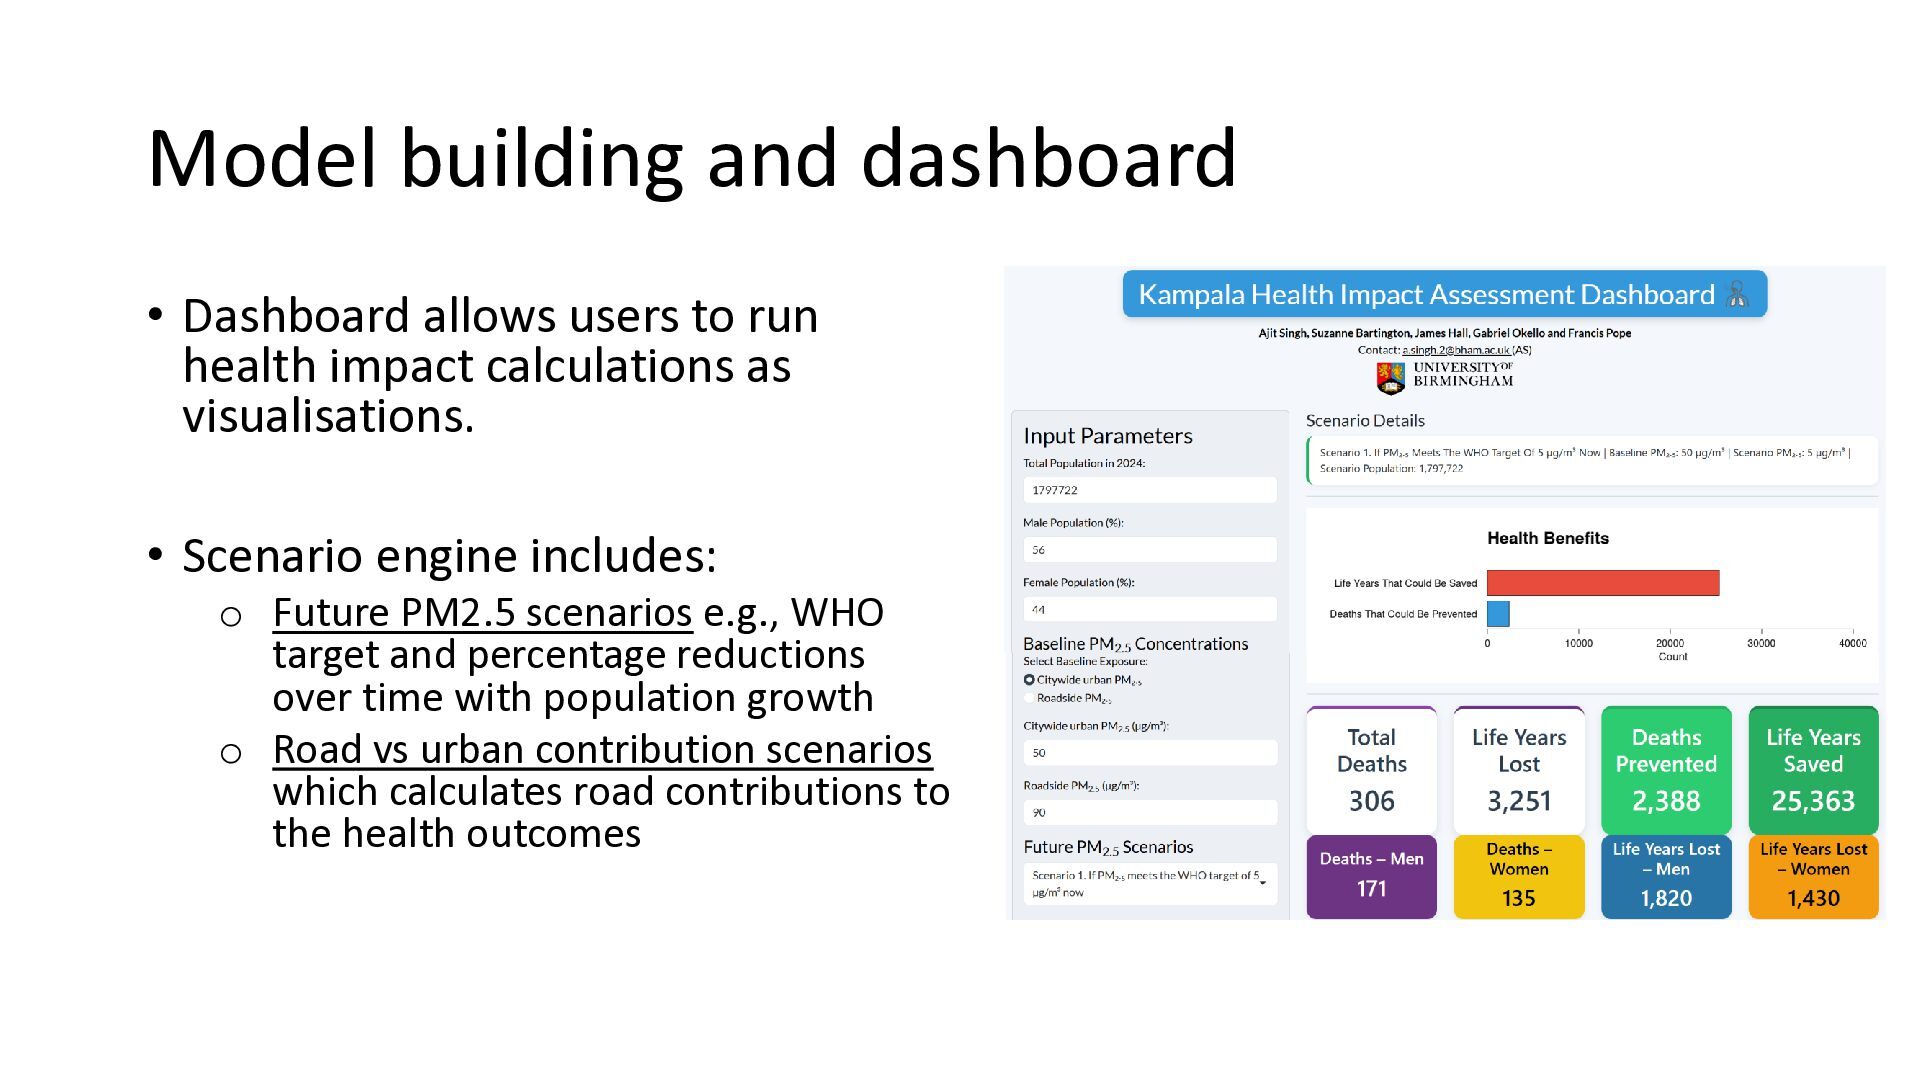
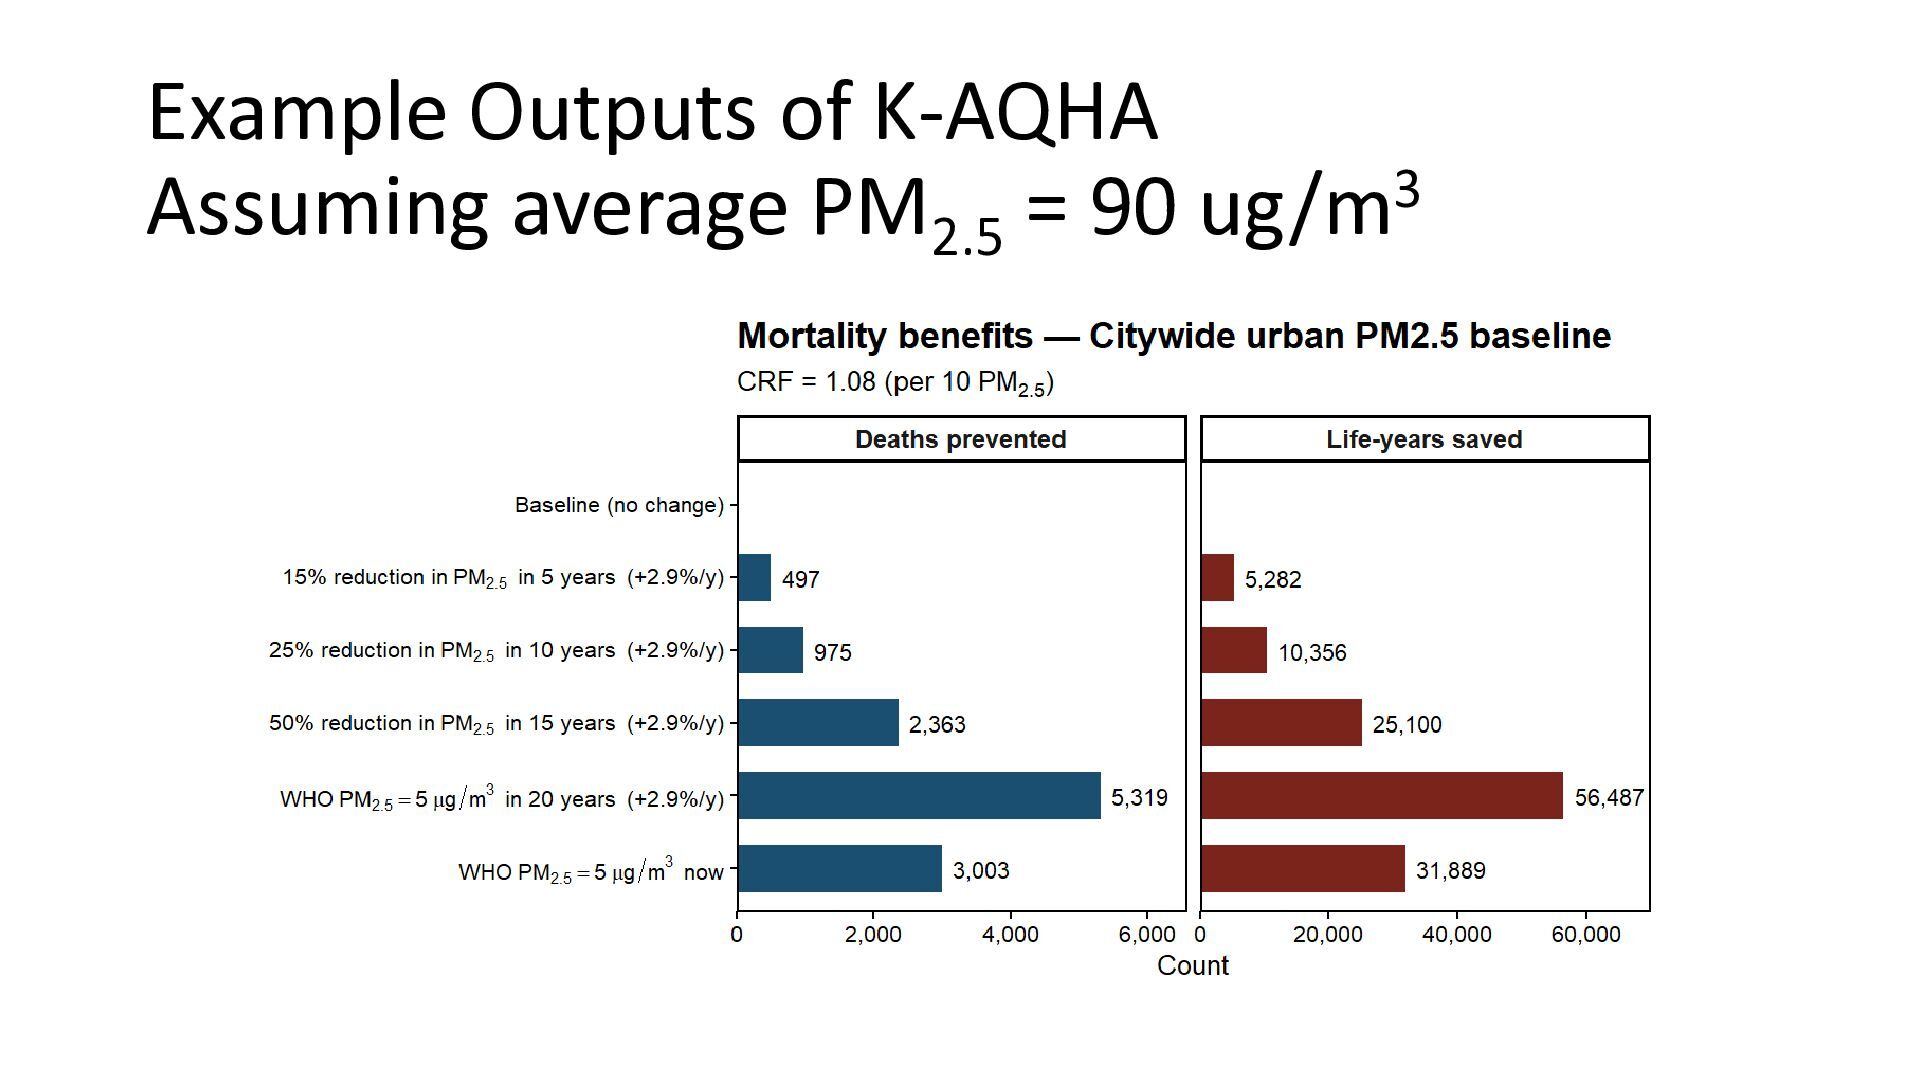
health impact calculations as visualisations. • Scenario engine includes: o Future PM2.5 scenarios e.g., WHO target and percentage reductions over time with population growth o Road vs urban contribution scenarios which calculates road contributions to the health outcomes
hyperlocal monitoring of pollution and exposure. • Combining air-quality sensors with other data sources provides new insight into pollution sources and human behaviour. • The next step is environmental intelligence: integrating diverse datasets and advanced modelling to move from simply measuring pollution to understanding, predicting and managing it.


 iesevents
 kevinliebholz
 tmiket
 tomoyanonymous
 notwaldorf
 soudai
 watany
 hannesfritz
 quramy
 marcelosomers
 tammyeverts
 caitiem20
 cassininazir