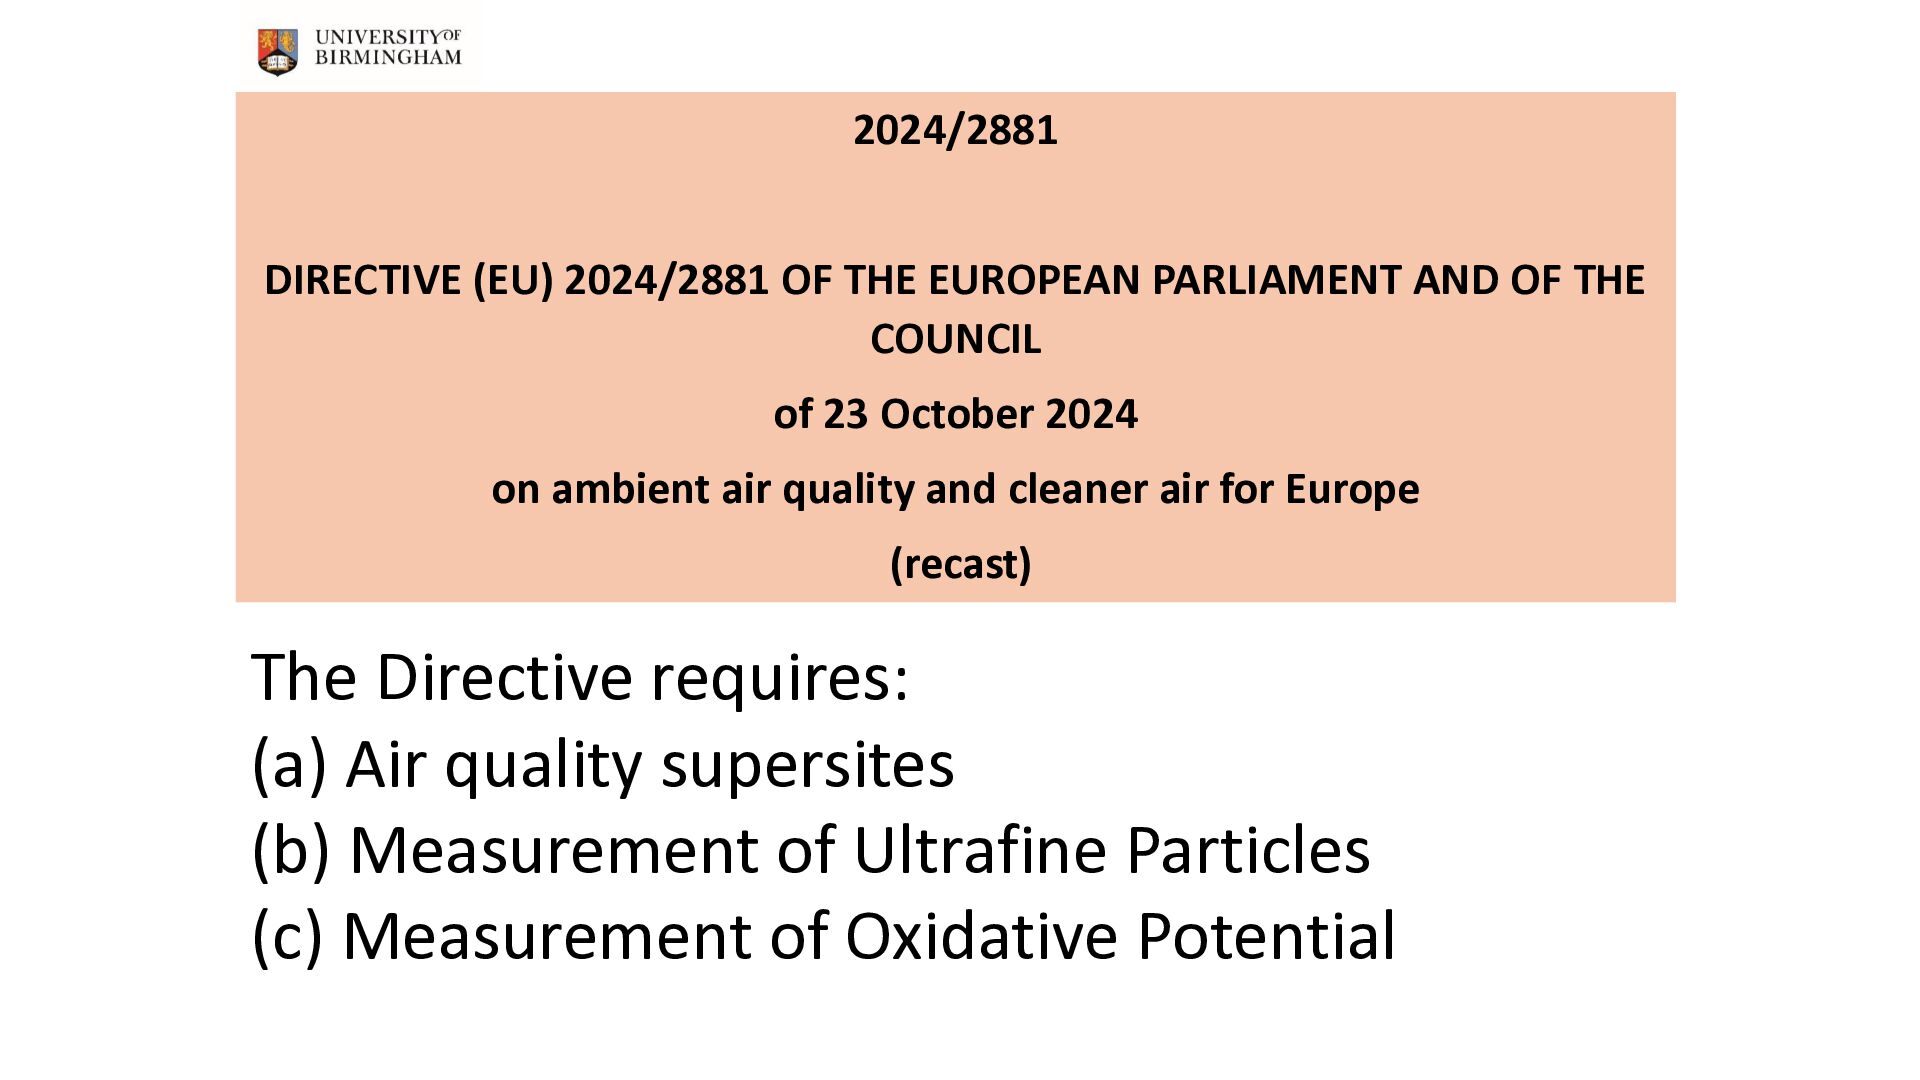
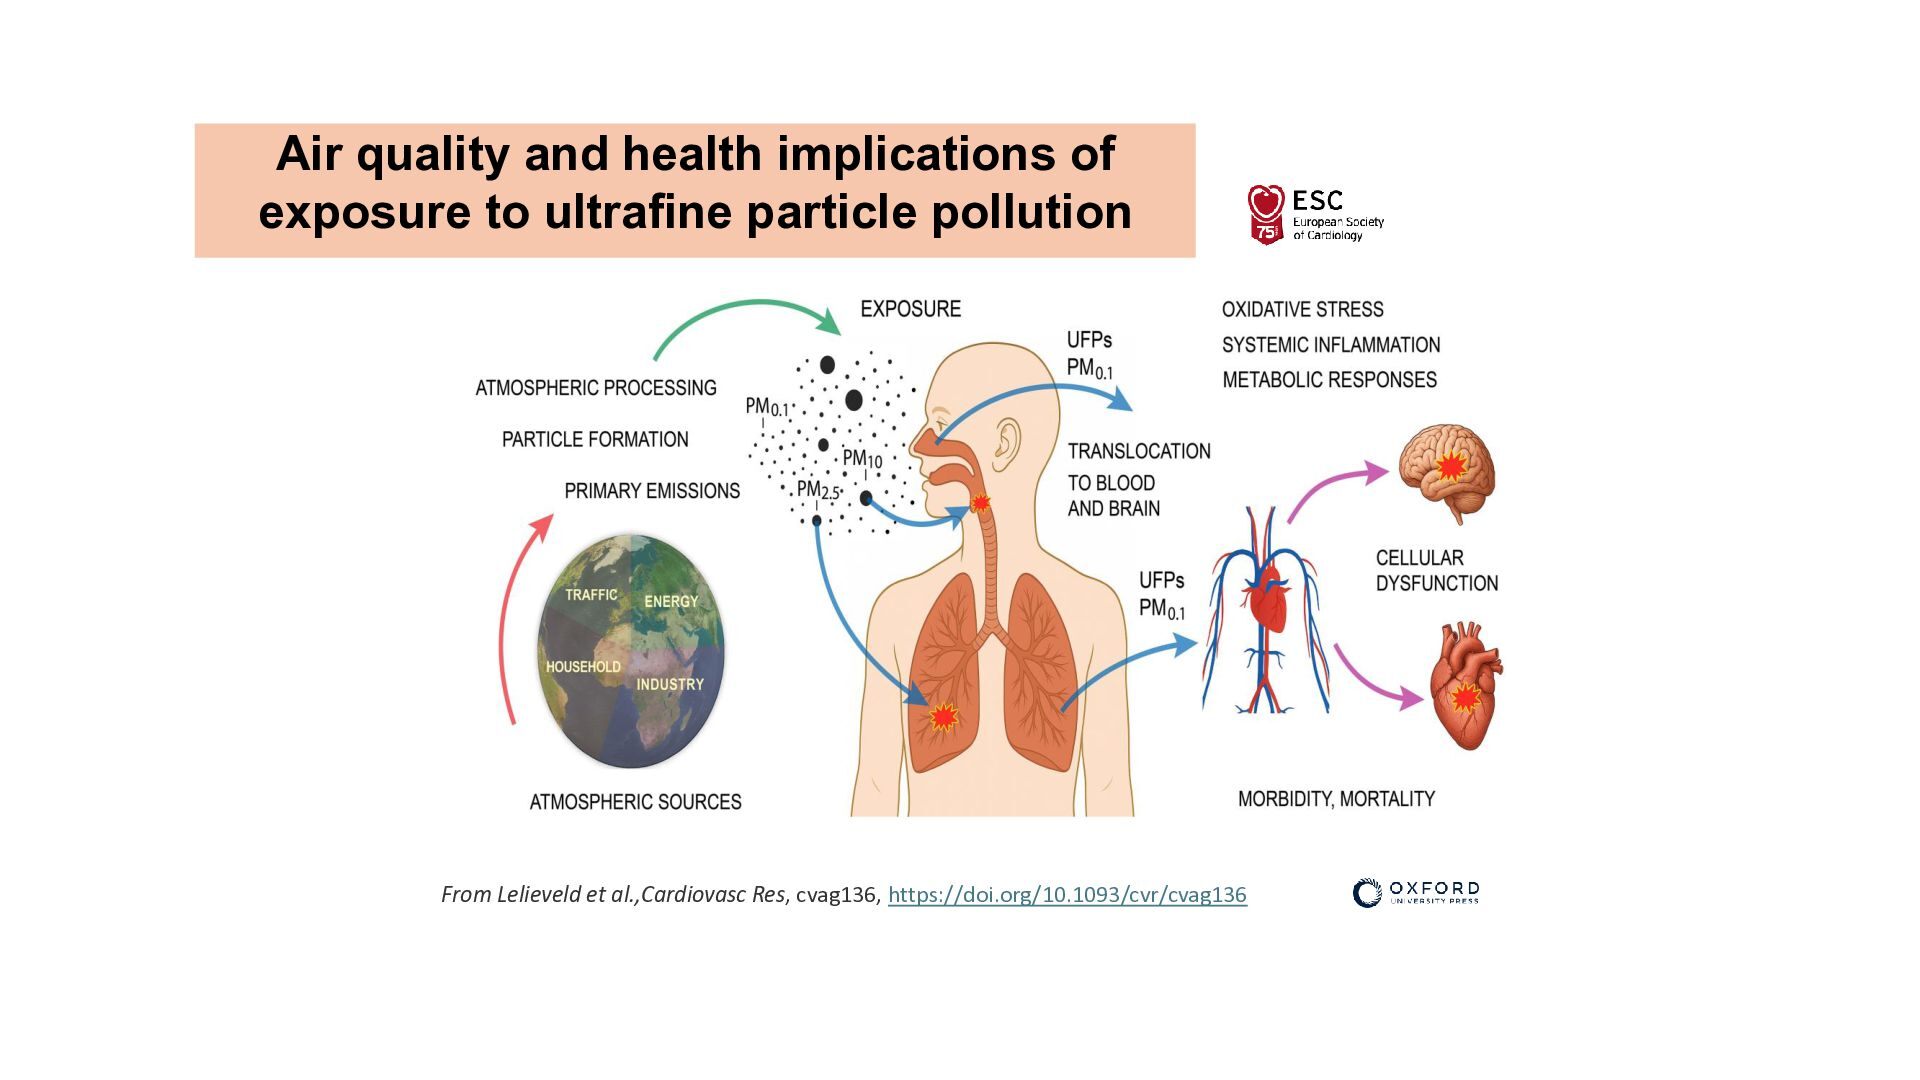
THE COUNCIL of 23 October 2024 on ambient air quality and cleaner air for Europe (recast) The Directive requires: (a) Air quality supersites (b) Measurement of Ultrafine Particles (c) Measurement of Oxidative Potential
near real-time characterisation of atmospheric composition • Defra support for supersites in Birmingham, Manchester and London • Elucidate air quality trends and key processes
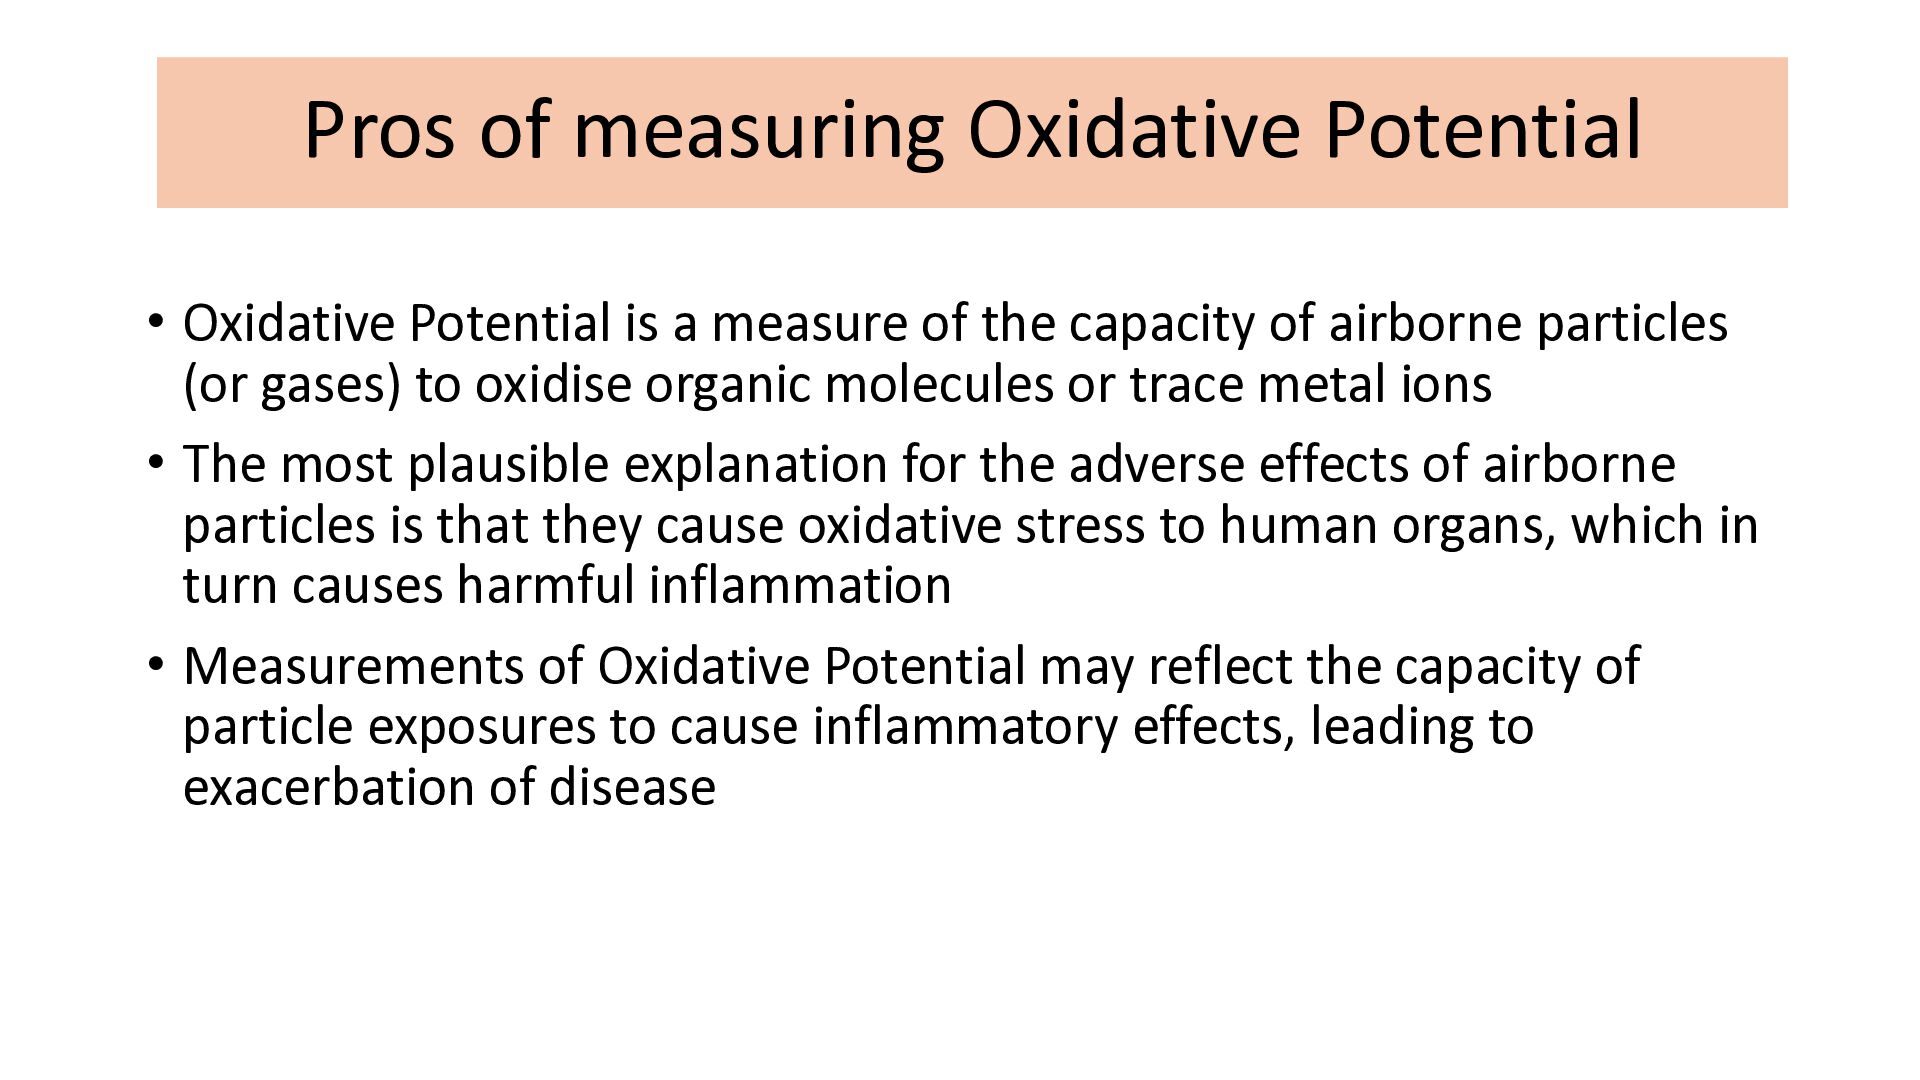
measure of the capacity of airborne particles (or gases) to oxidise organic molecules or trace metal ions • The most plausible explanation for the adverse effects of airborne particles is that they cause oxidative stress to human organs, which in turn causes harmful inflammation • Measurements of Oxidative Potential may reflect the capacity of particle exposures to cause inflammatory effects, leading to exacerbation of disease
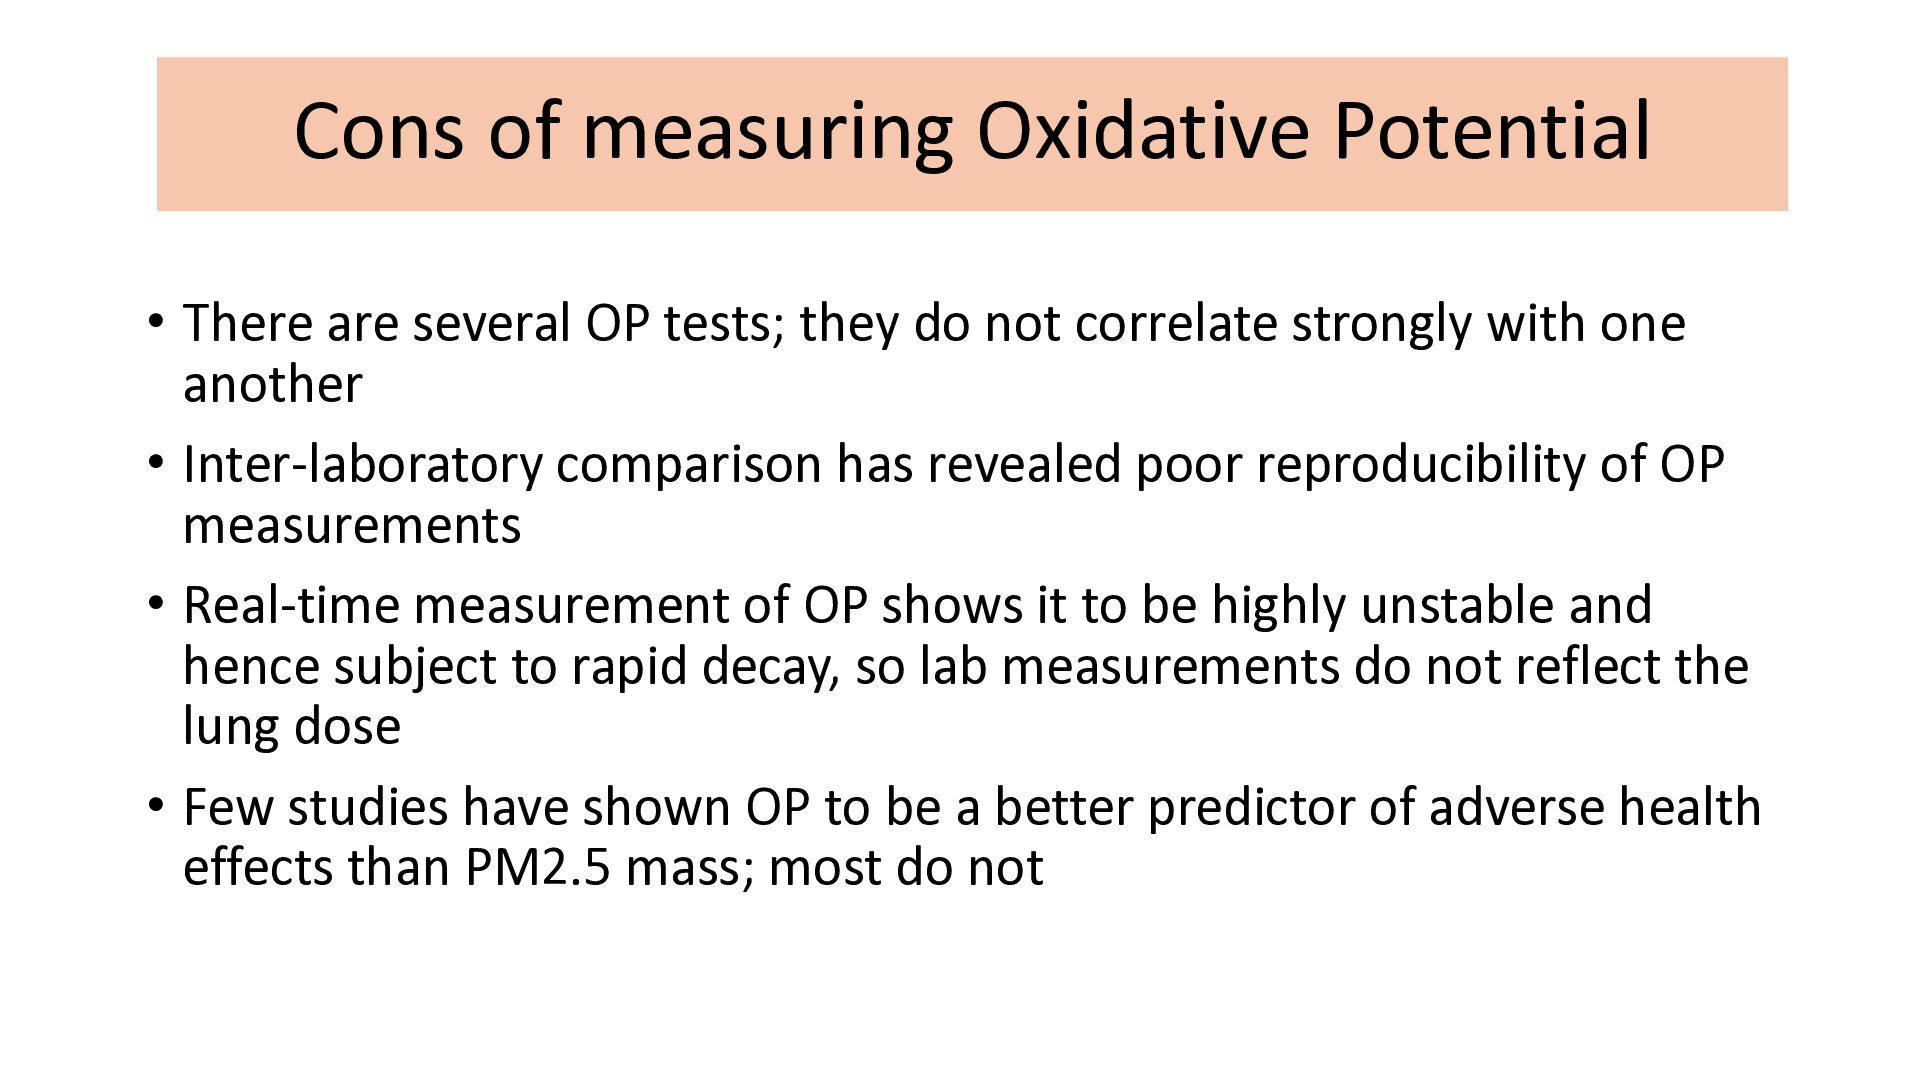
tests; they do not correlate strongly with one another • Inter-laboratory comparison has revealed poor reproducibility of OP measurements • Real-time measurement of OP shows it to be highly unstable and hence subject to rapid decay, so lab measurements do not reflect the lung dose • Few studies have shown OP to be a better predictor of adverse health effects than PM2.5 mass; most do not
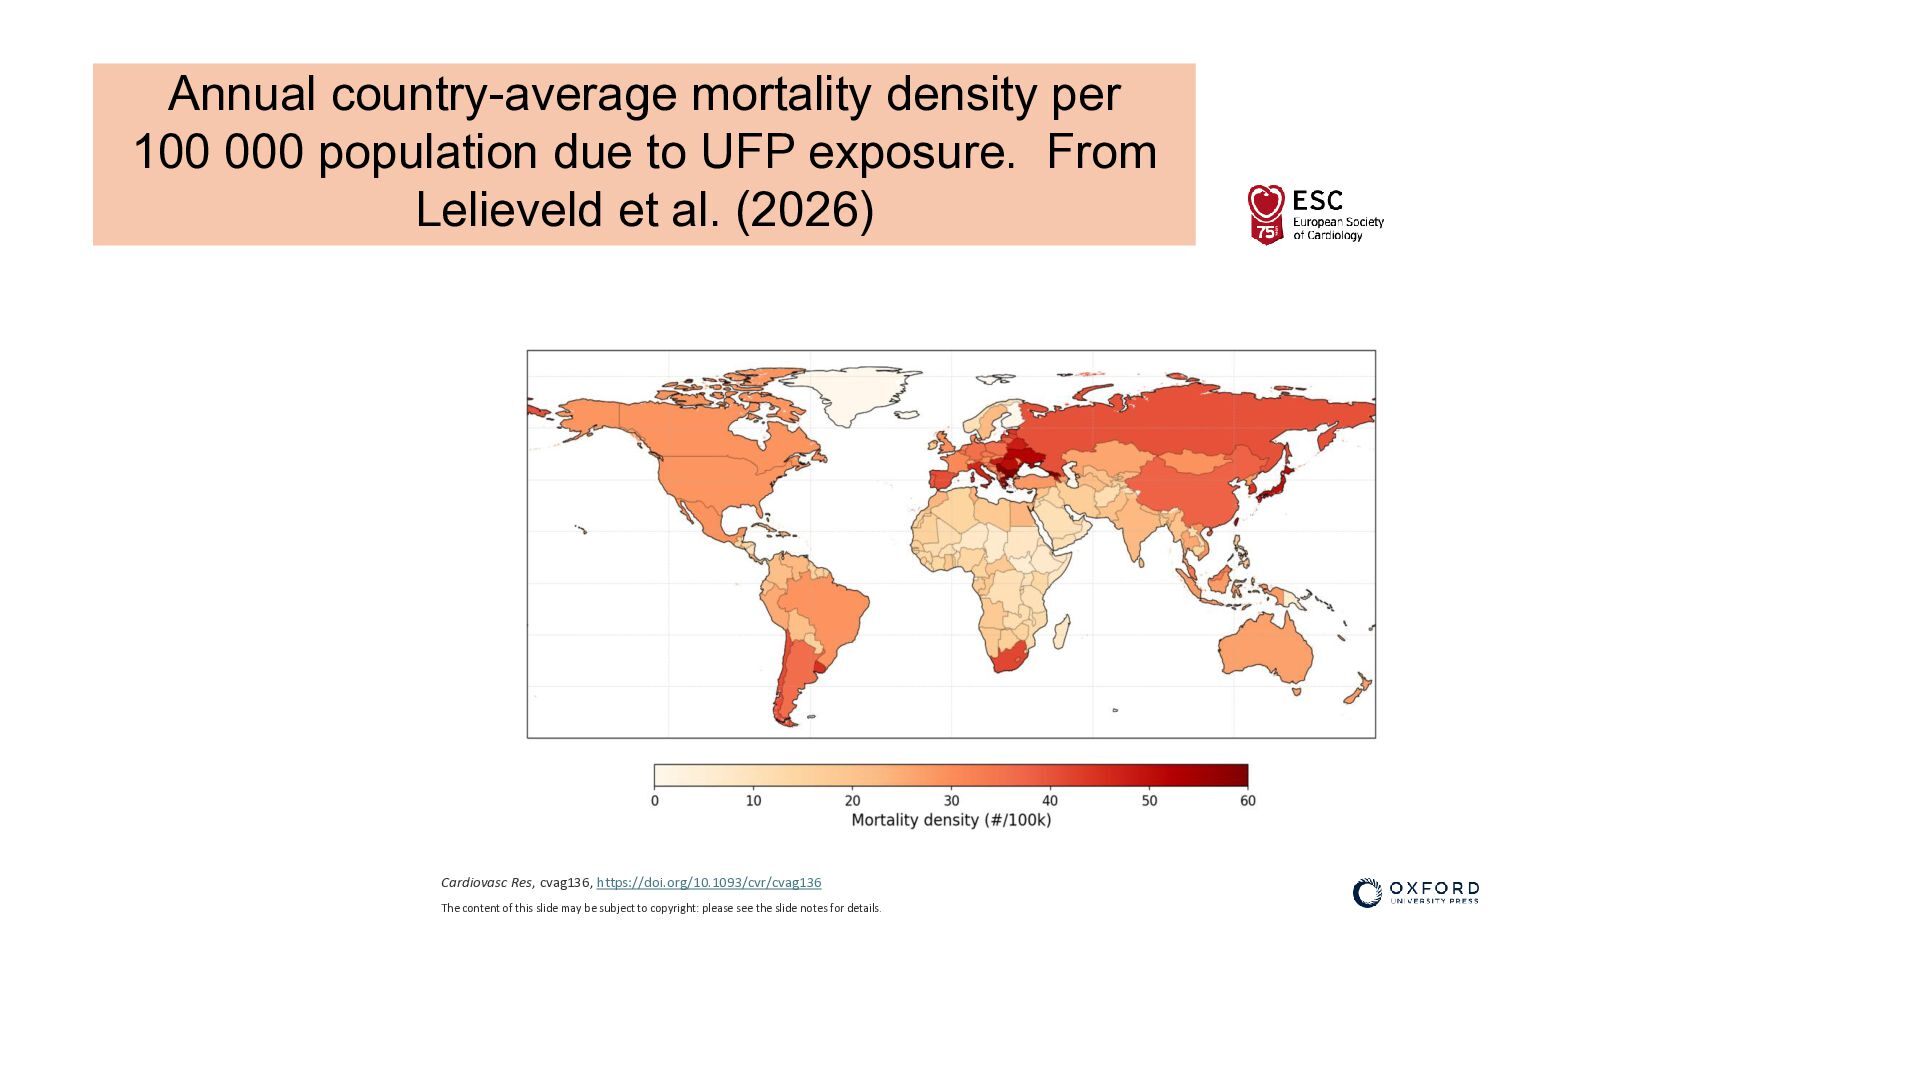
UFP exposure. From Lelieveld et al. (2026) Cardiovasc Res, cvag136, https://doi.org/10.1093/cvr/cvag136 The content of this slide may be subject to copyright: please see the slide notes for details.
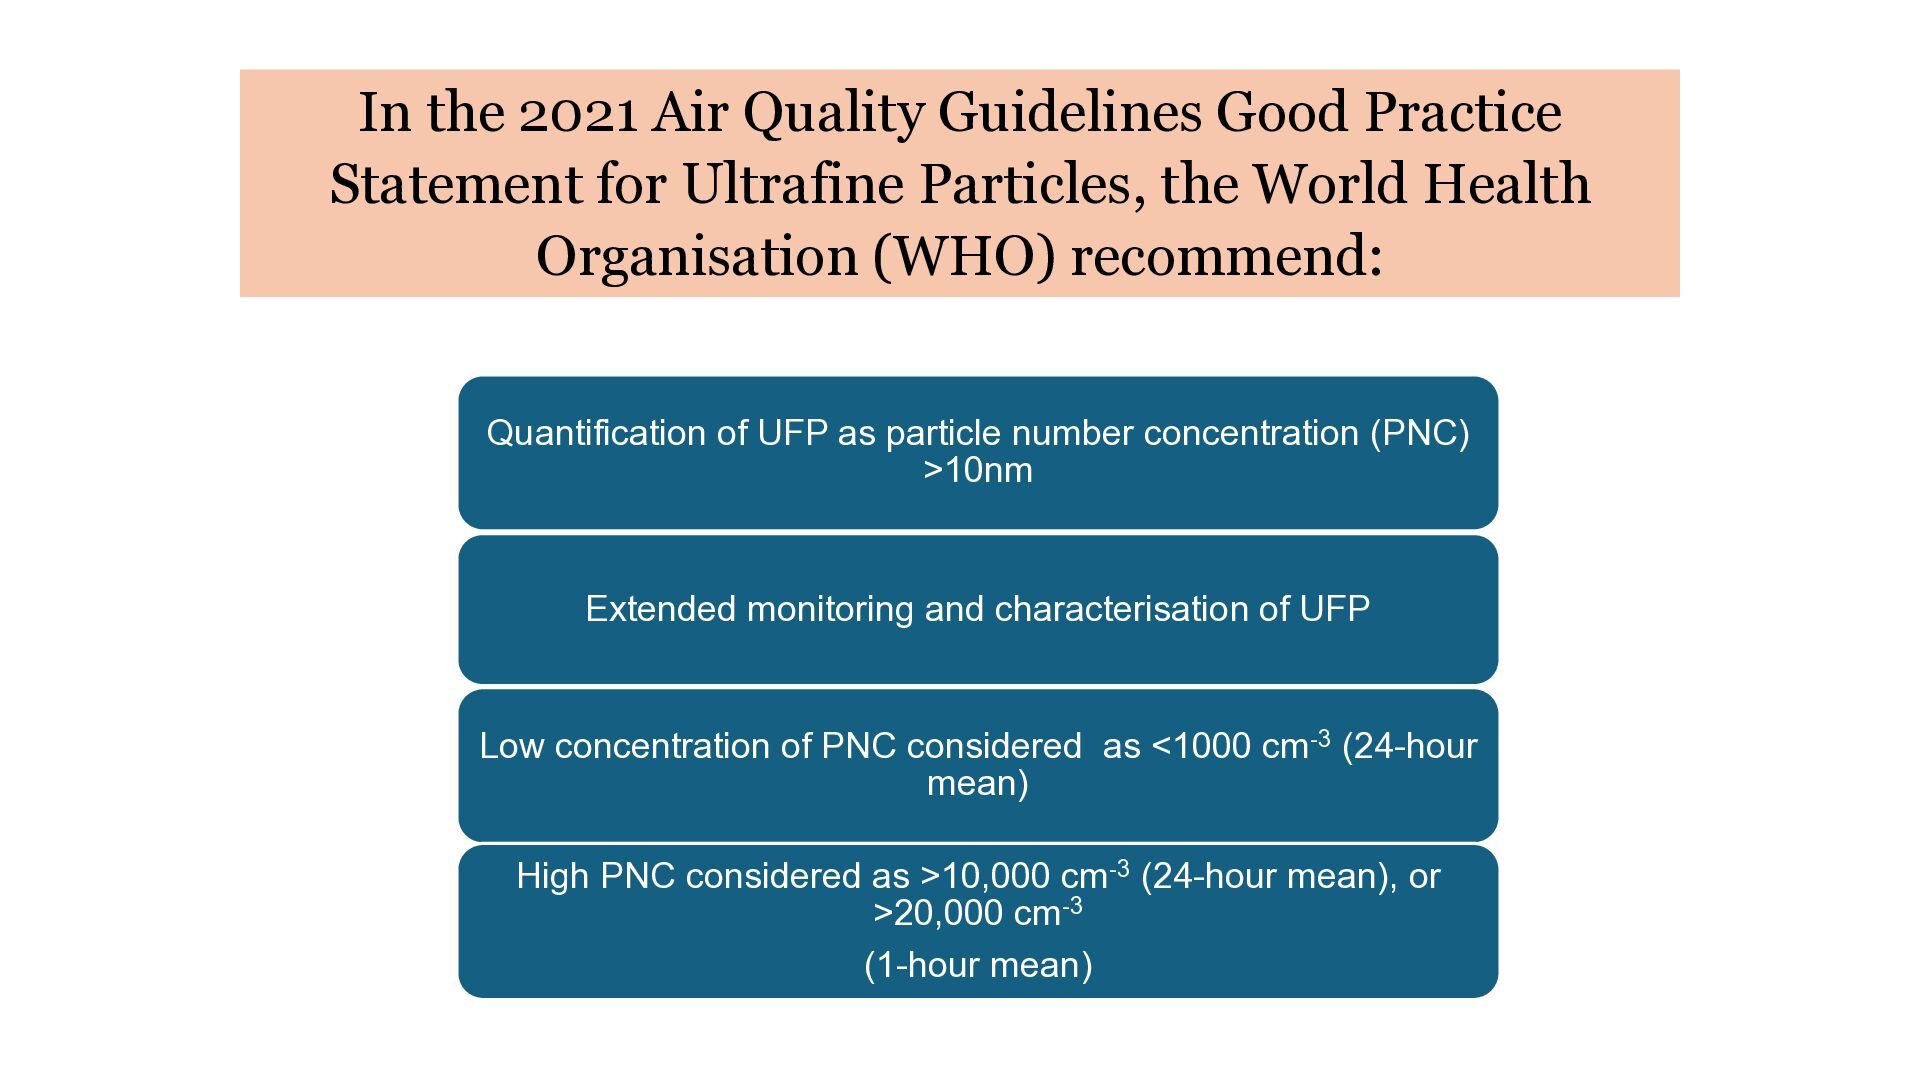
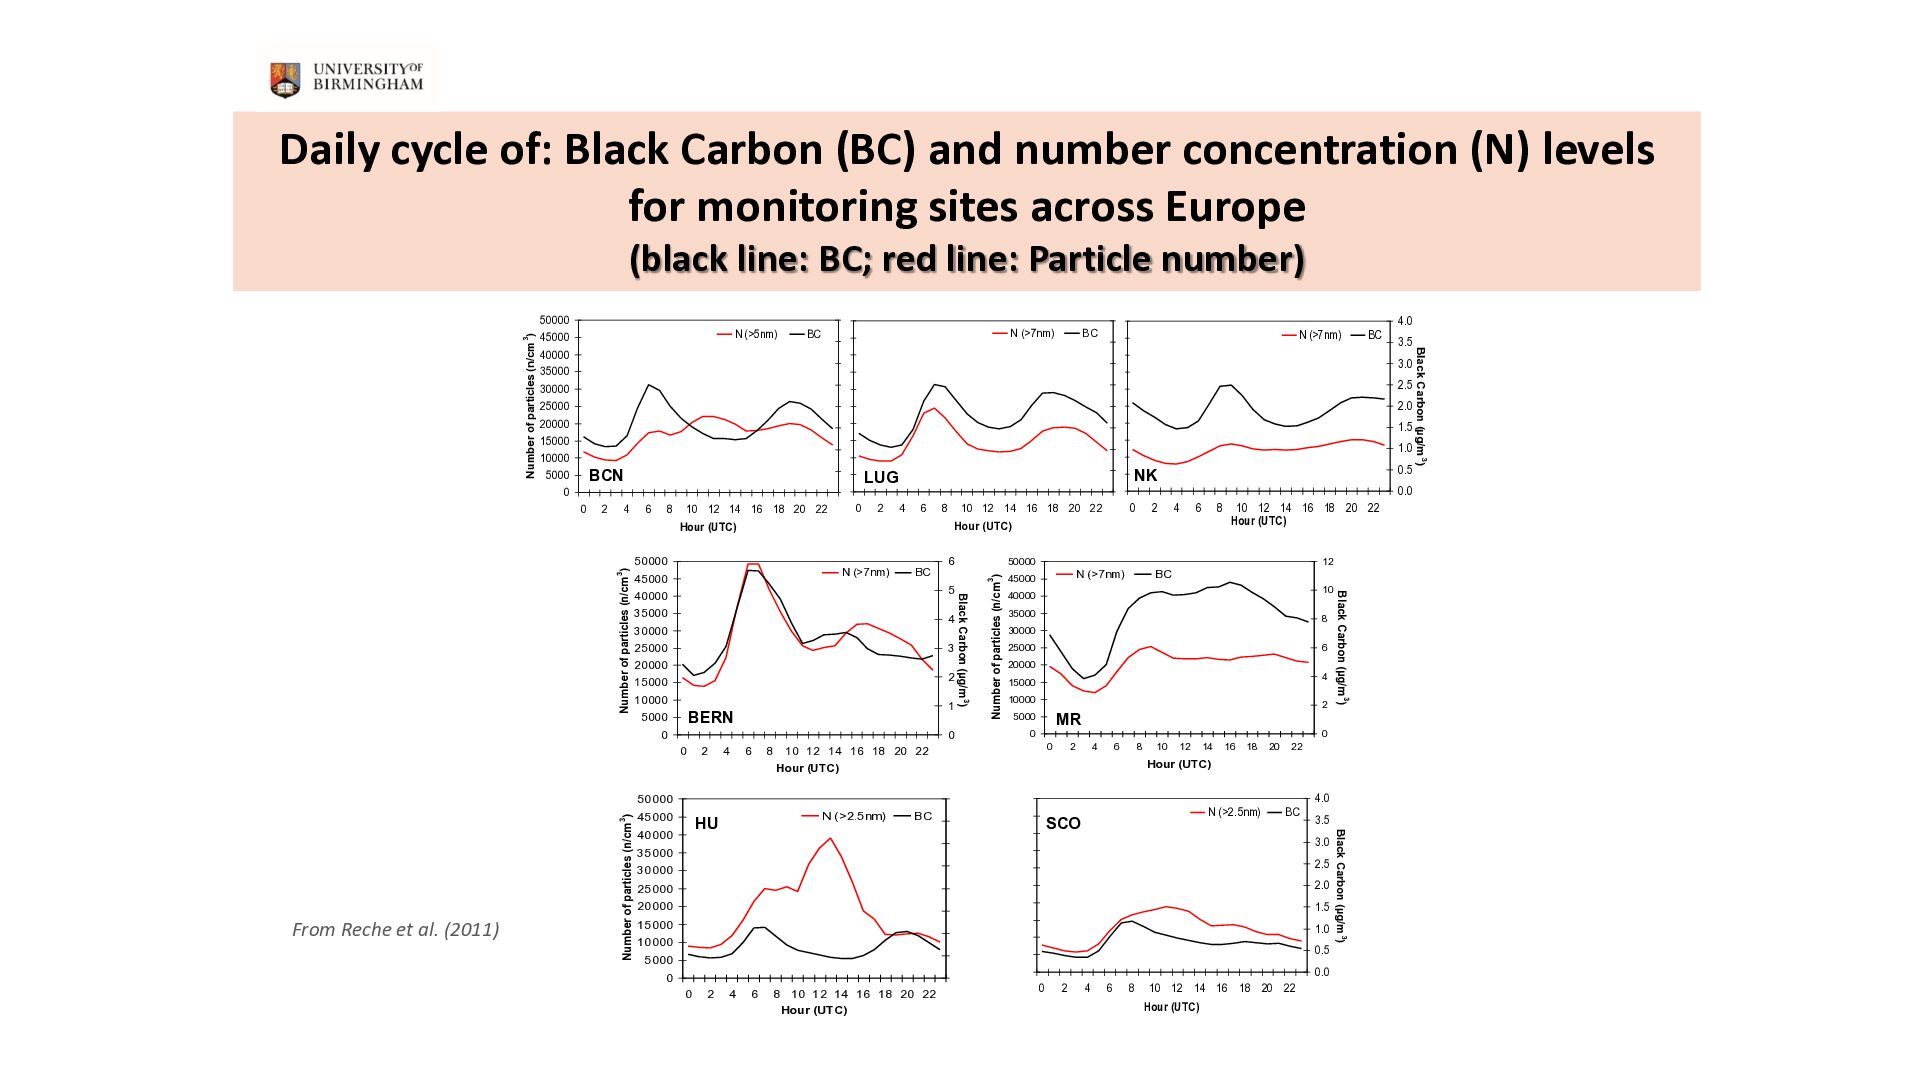
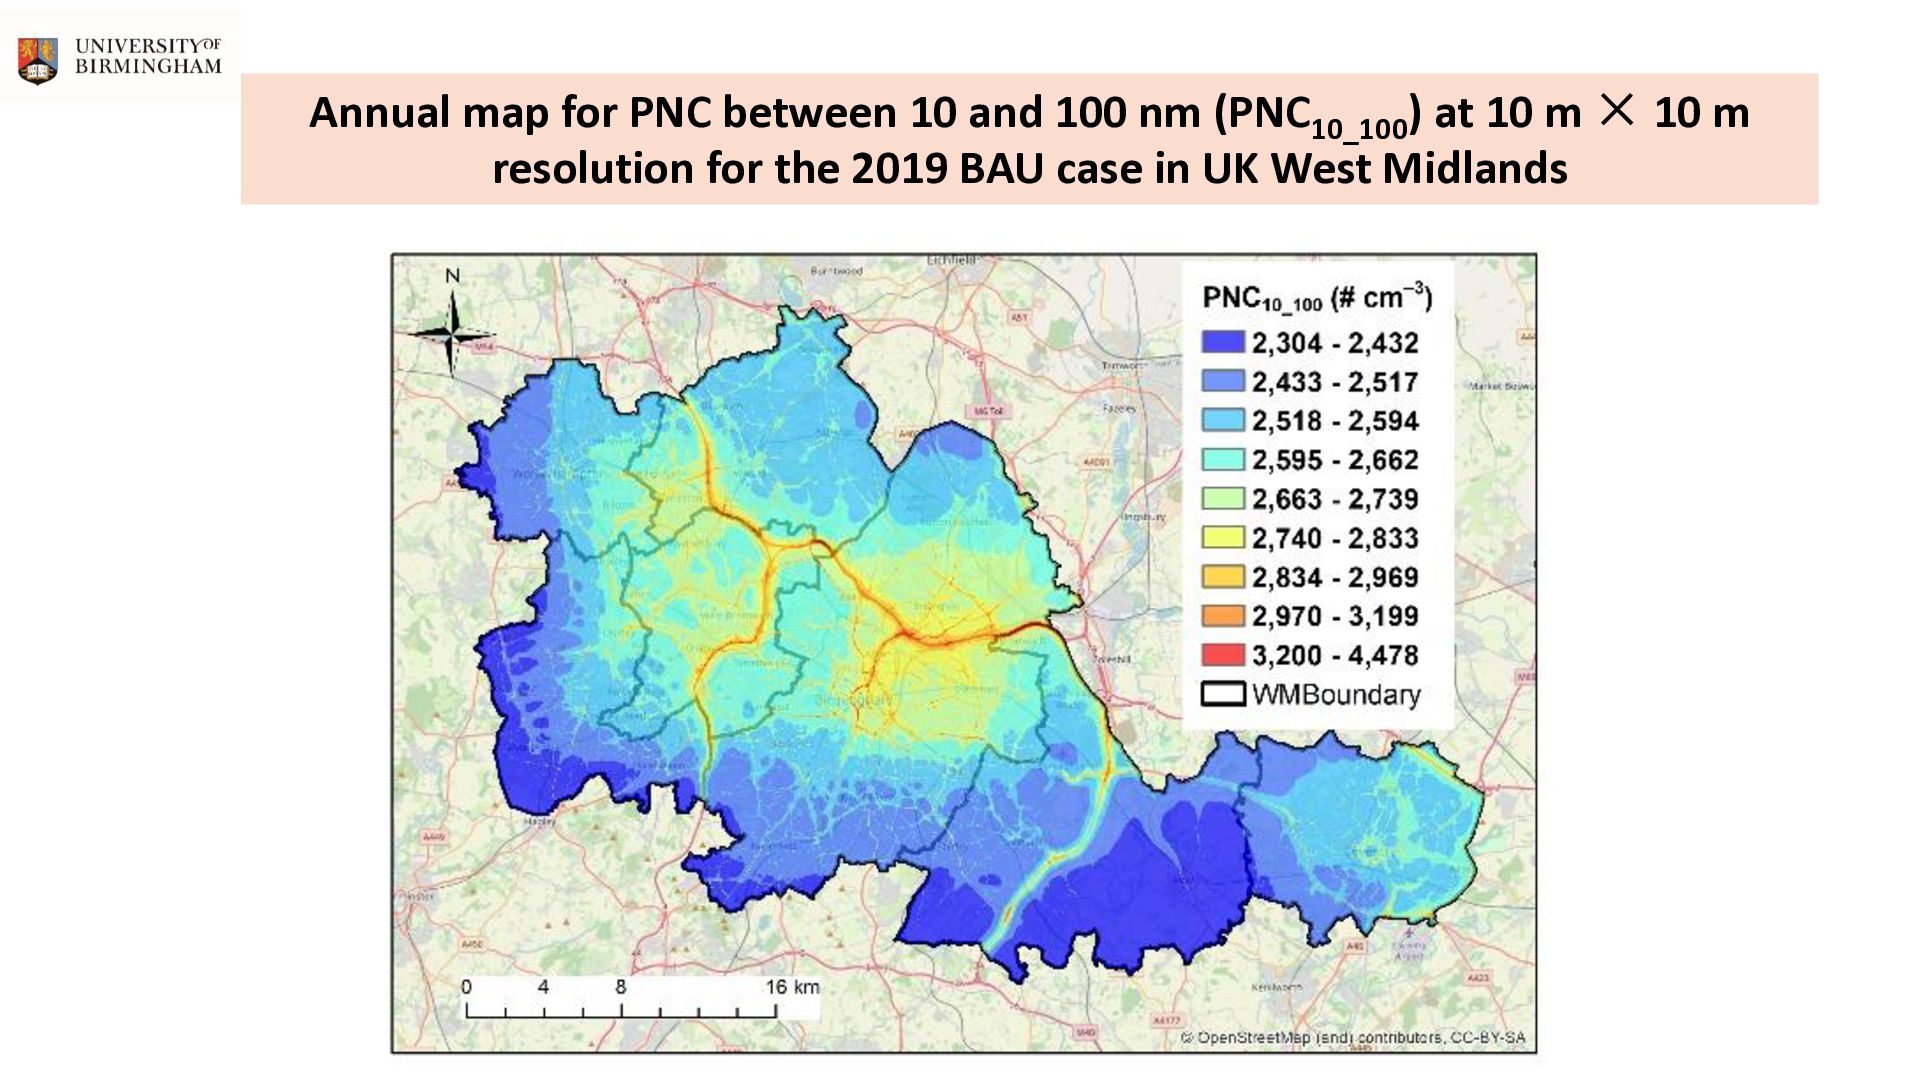
Ultrafine Particles, the World Health Organisation (WHO) recommend: Quantification of UFP as particle number concentration (PNC) >10nm Extended monitoring and characterisation of UFP Low concentration of PNC considered as <1000 cm-3 (24-hour mean) High PNC considered as >10,000 cm-3 (24-hour mean), or >20,000 cm-3 (1-hour mean)
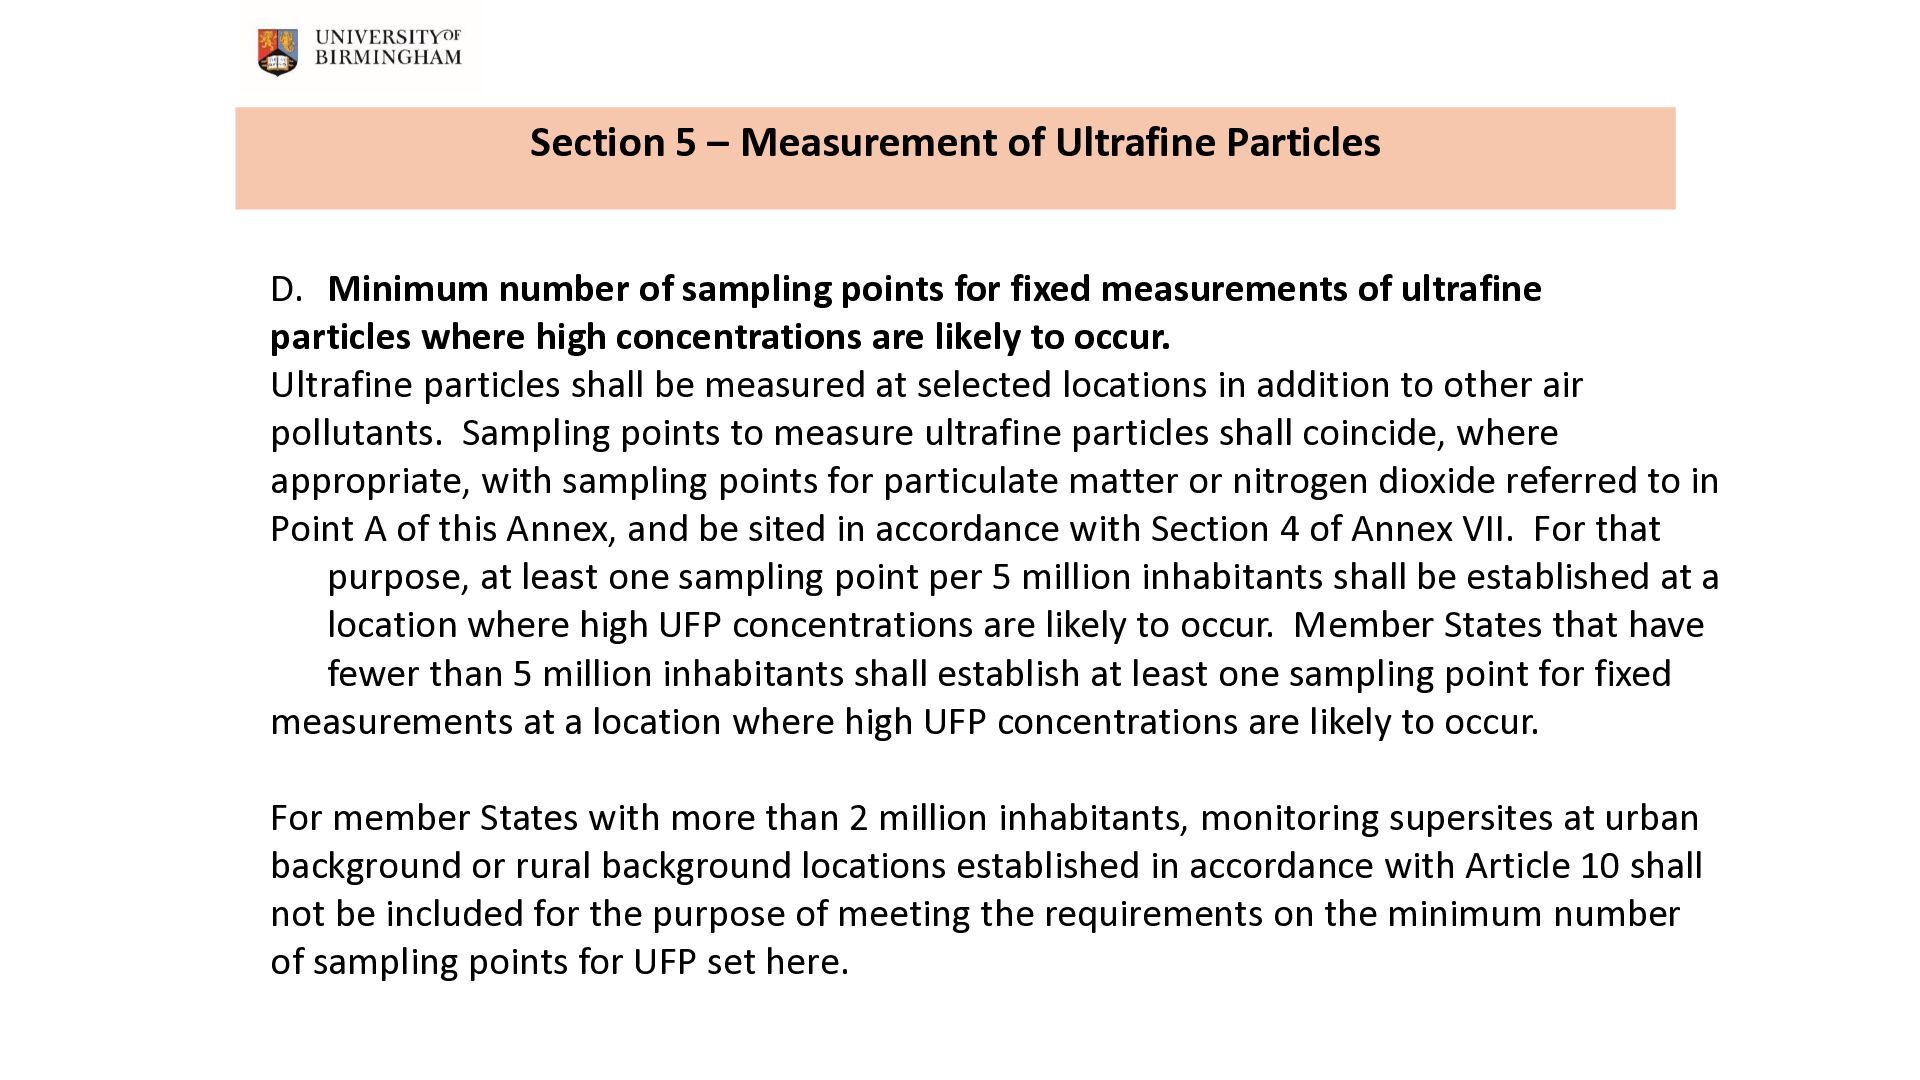
of sampling points for fixed measurements of ultrafine particles where high concentrations are likely to occur. Ultrafine particles shall be measured at selected locations in addition to other air pollutants. Sampling points to measure ultrafine particles shall coincide, where appropriate, with sampling points for particulate matter or nitrogen dioxide referred to in Point A of this Annex, and be sited in accordance with Section 4 of Annex VII. For that purpose, at least one sampling point per 5 million inhabitants shall be established at a location where high UFP concentrations are likely to occur. Member States that have fewer than 5 million inhabitants shall establish at least one sampling point for fixed measurements at a location where high UFP concentrations are likely to occur. For member States with more than 2 million inhabitants, monitoring supersites at urban background or rural background locations established in accordance with Article 10 shall not be included for the purpose of meeting the requirements on the minimum number of sampling points for UFP set here.
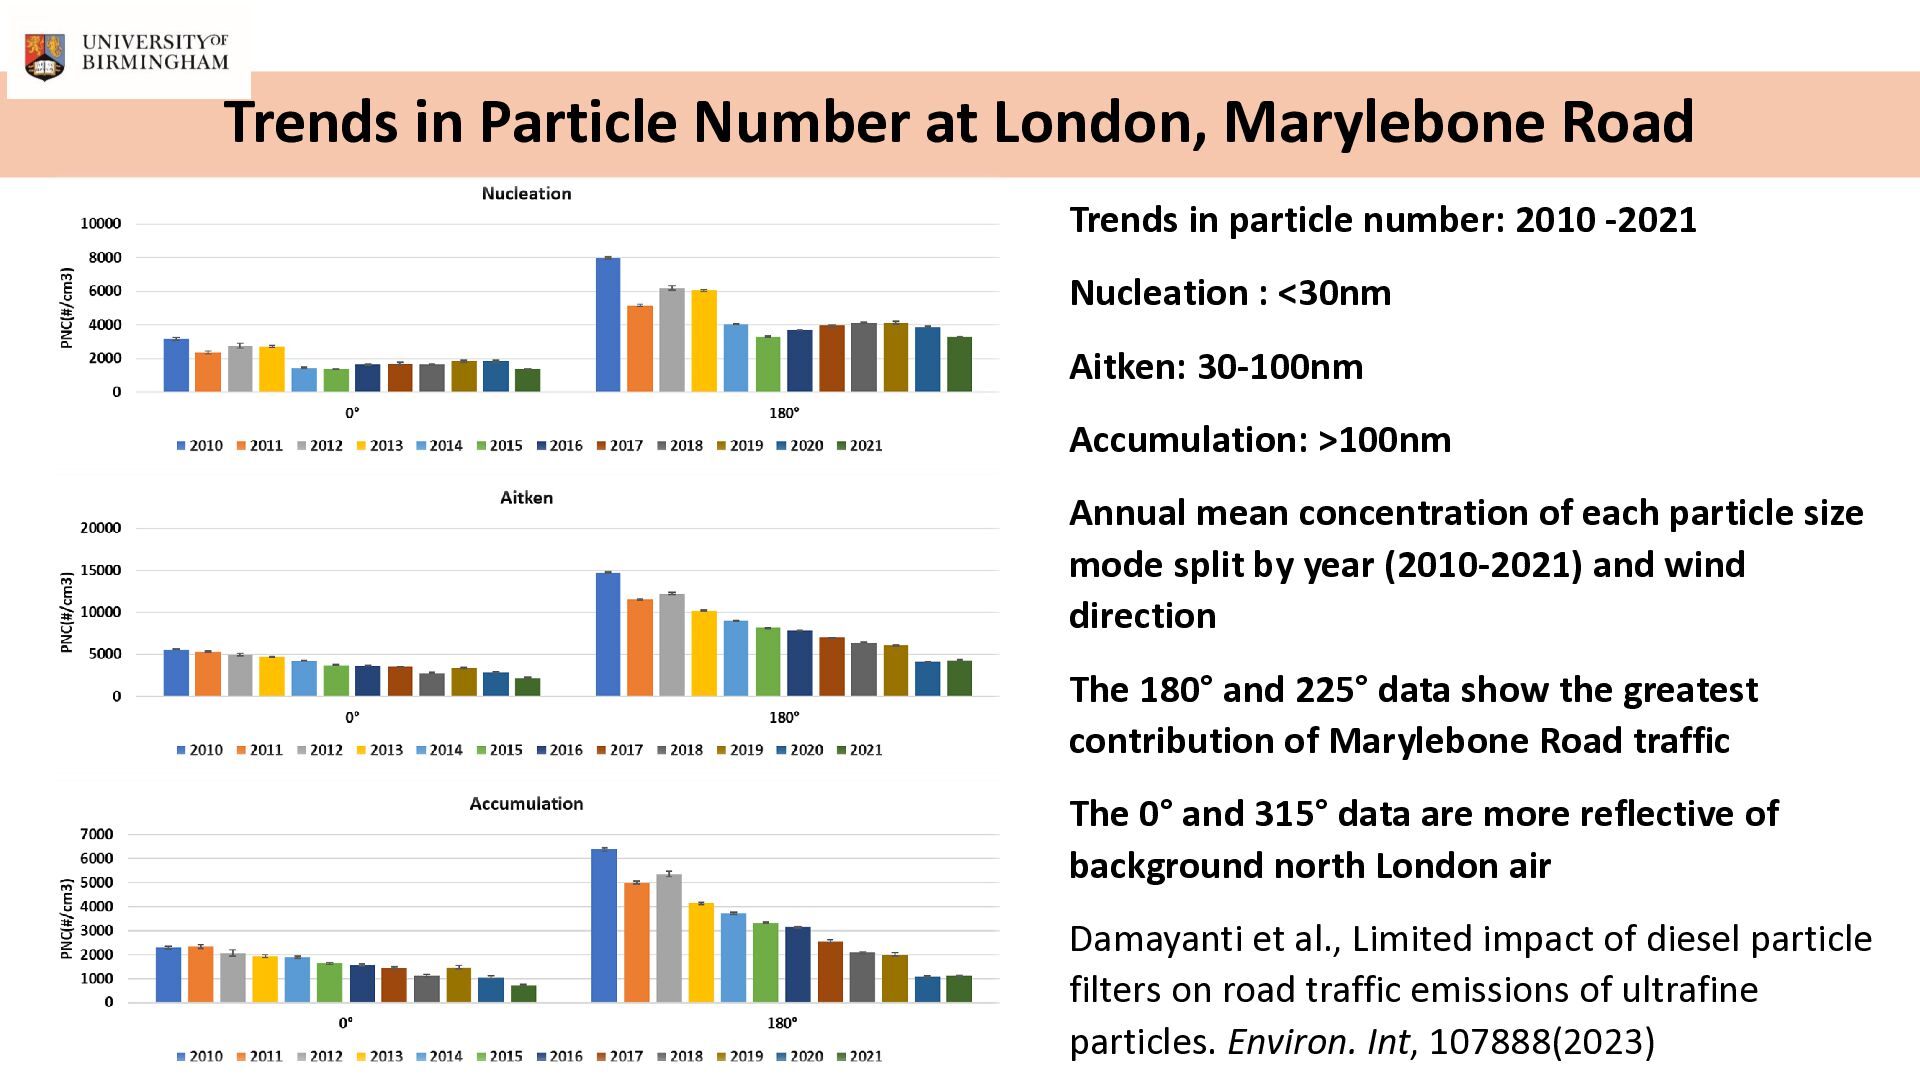
particle number: 2010 -2021 Nucleation : <30nm Aitken: 30-100nm Accumulation: >100nm Annual mean concentration of each particle size mode split by year (2010-2021) and wind direction The 180° and 225° data show the greatest contribution of Marylebone Road traffic The 0° and 315° data are more reflective of background north London air Damayanti et al., Limited impact of diesel particle filters on road traffic emissions of ultrafine particles. Environ. Int, 107888(2023)
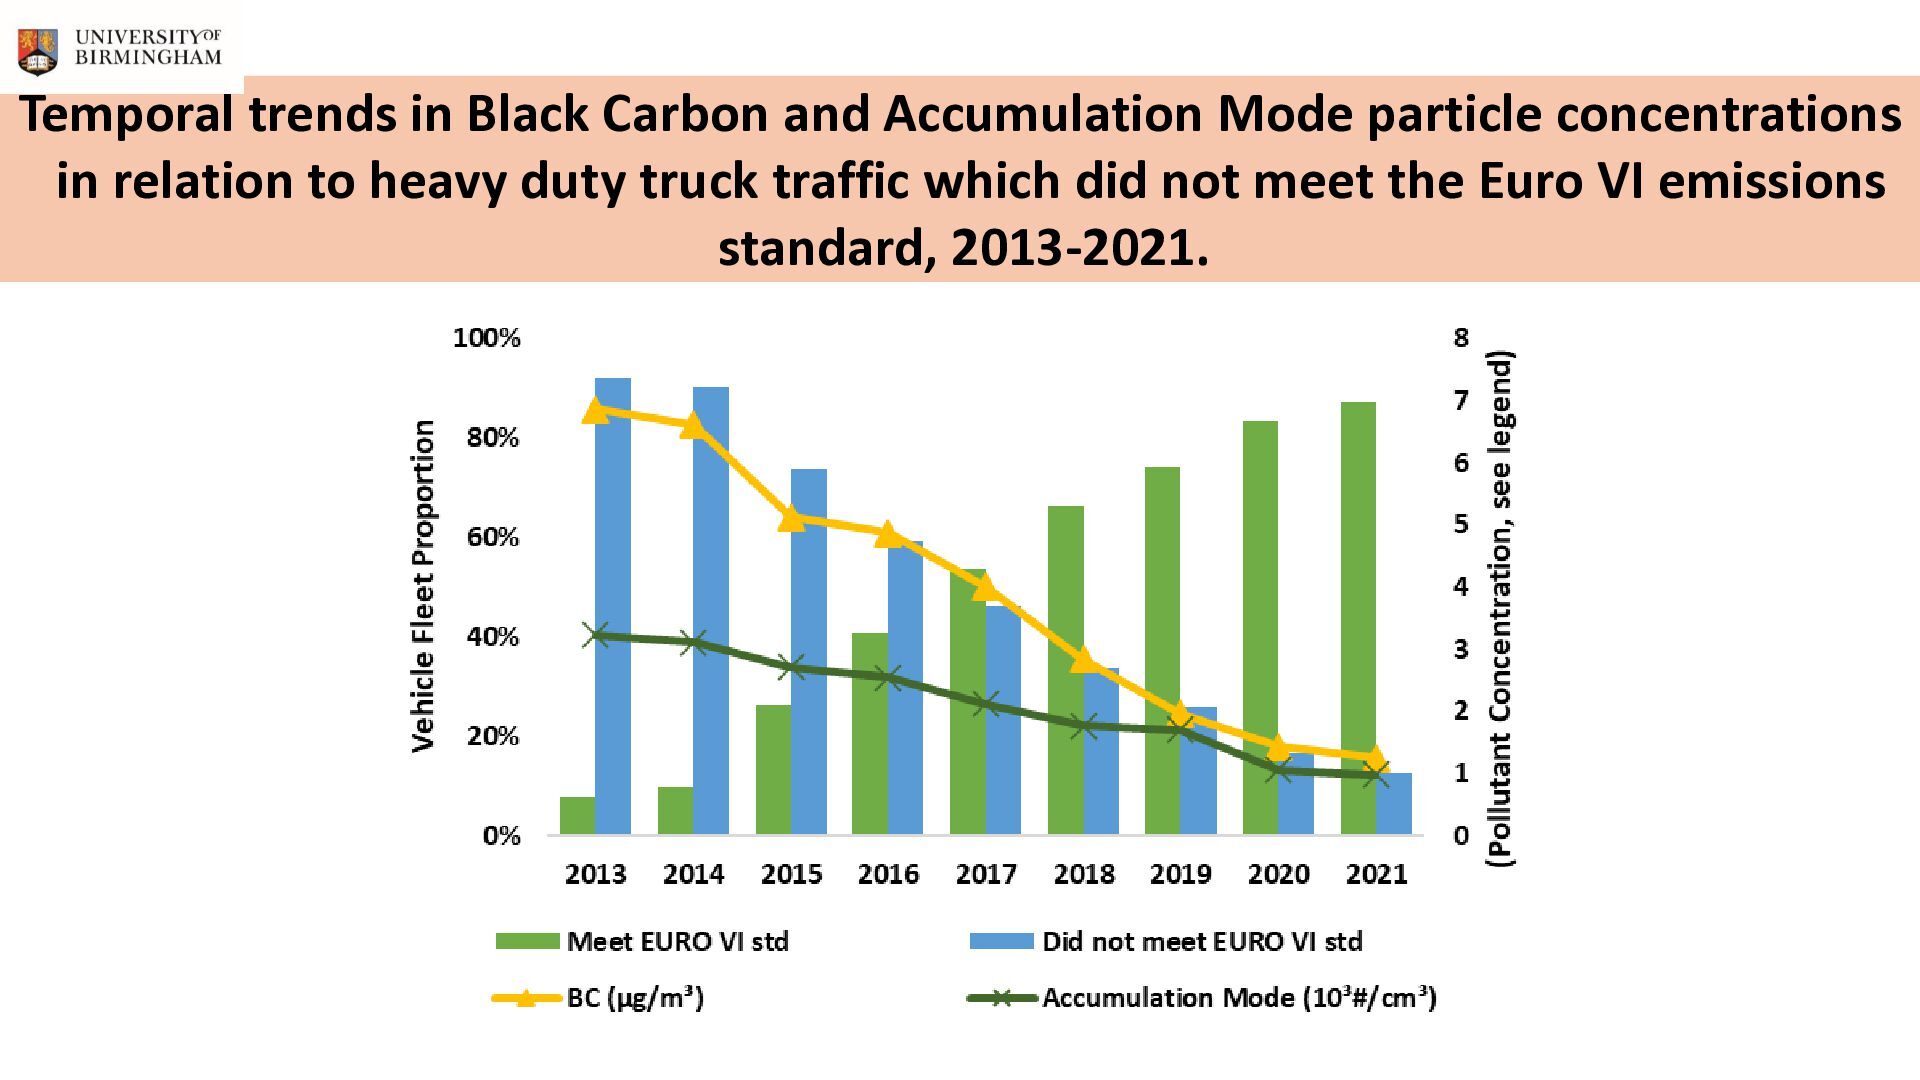
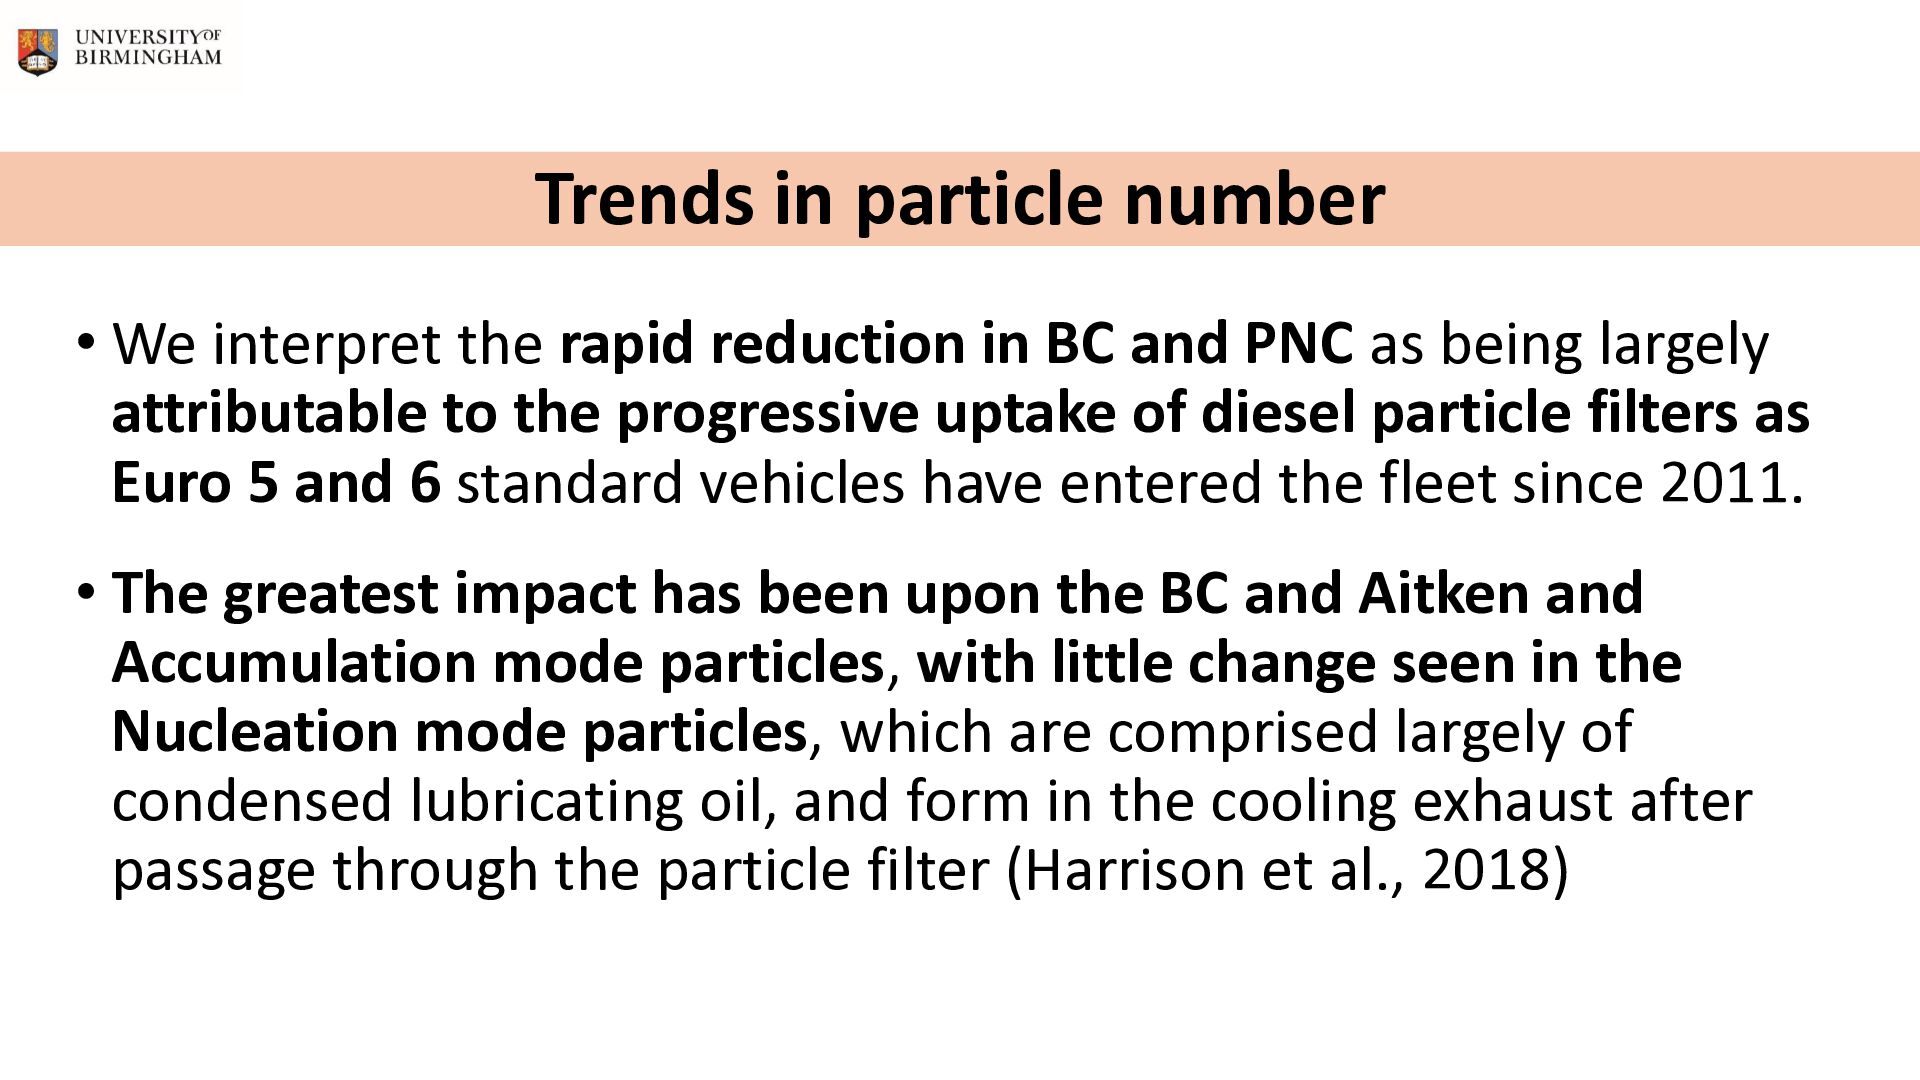
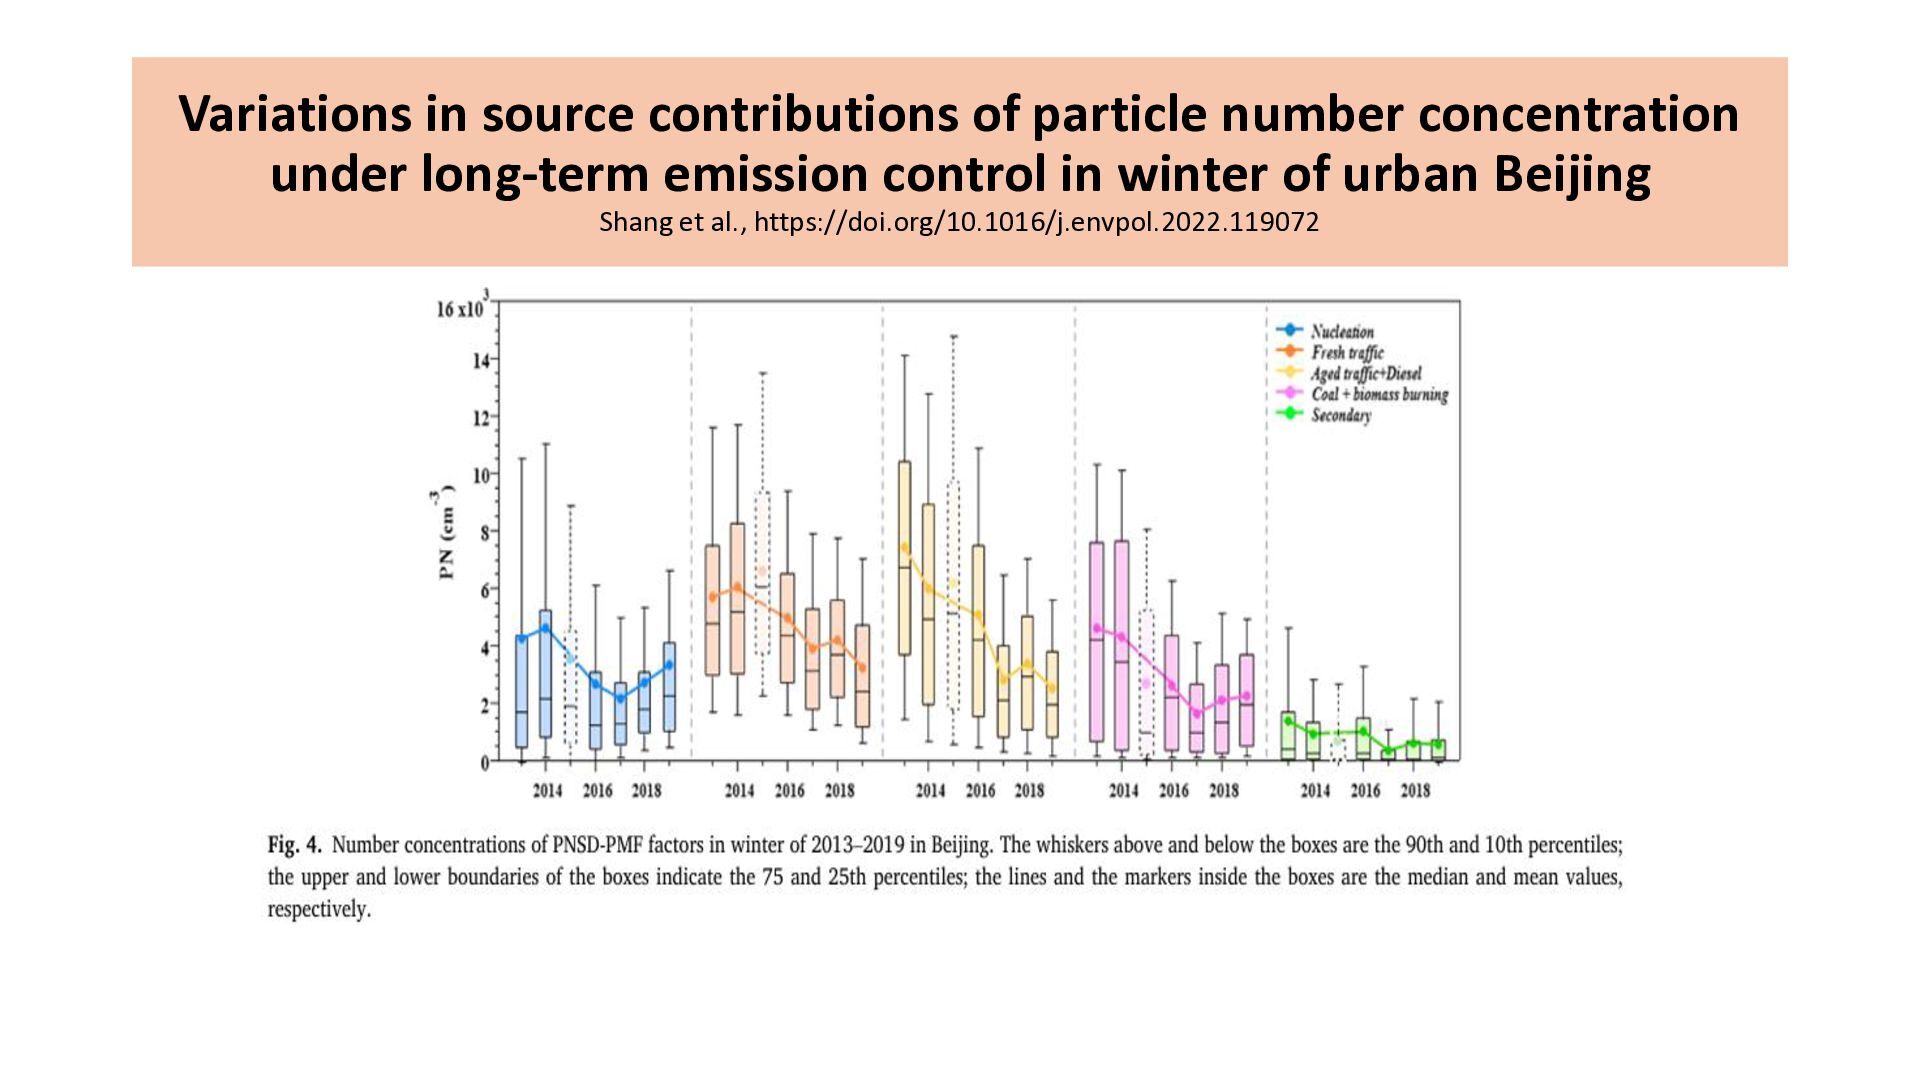
in BC and PNC as being largely attributable to the progressive uptake of diesel particle filters as Euro 5 and 6 standard vehicles have entered the fleet since 2011. • The greatest impact has been upon the BC and Aitken and Accumulation mode particles, with little change seen in the Nucleation mode particles, which are comprised largely of condensed lubricating oil, and form in the cooling exhaust after passage through the particle filter (Harrison et al., 2018)
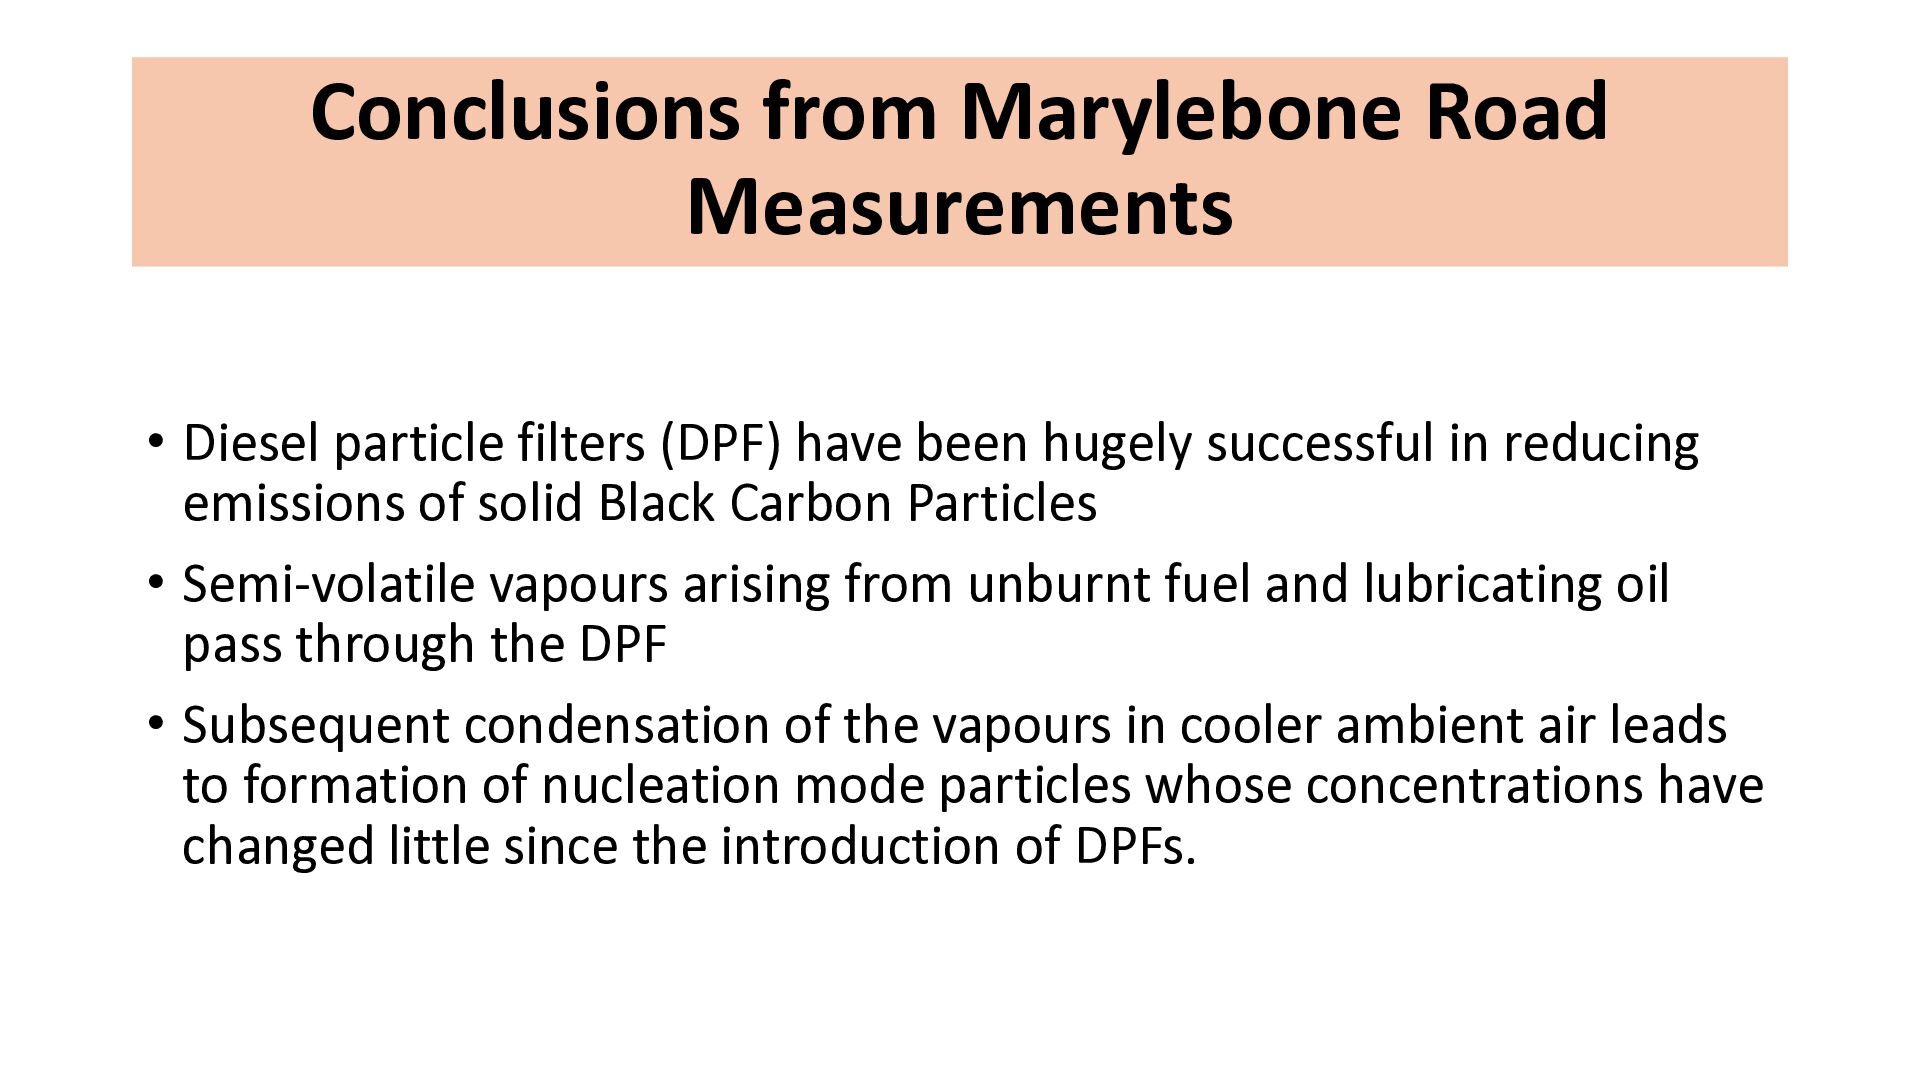
have been hugely successful in reducing emissions of solid Black Carbon Particles • Semi-volatile vapours arising from unburnt fuel and lubricating oil pass through the DPF • Subsequent condensation of the vapours in cooler ambient air leads to formation of nucleation mode particles whose concentrations have changed little since the introduction of DPFs.
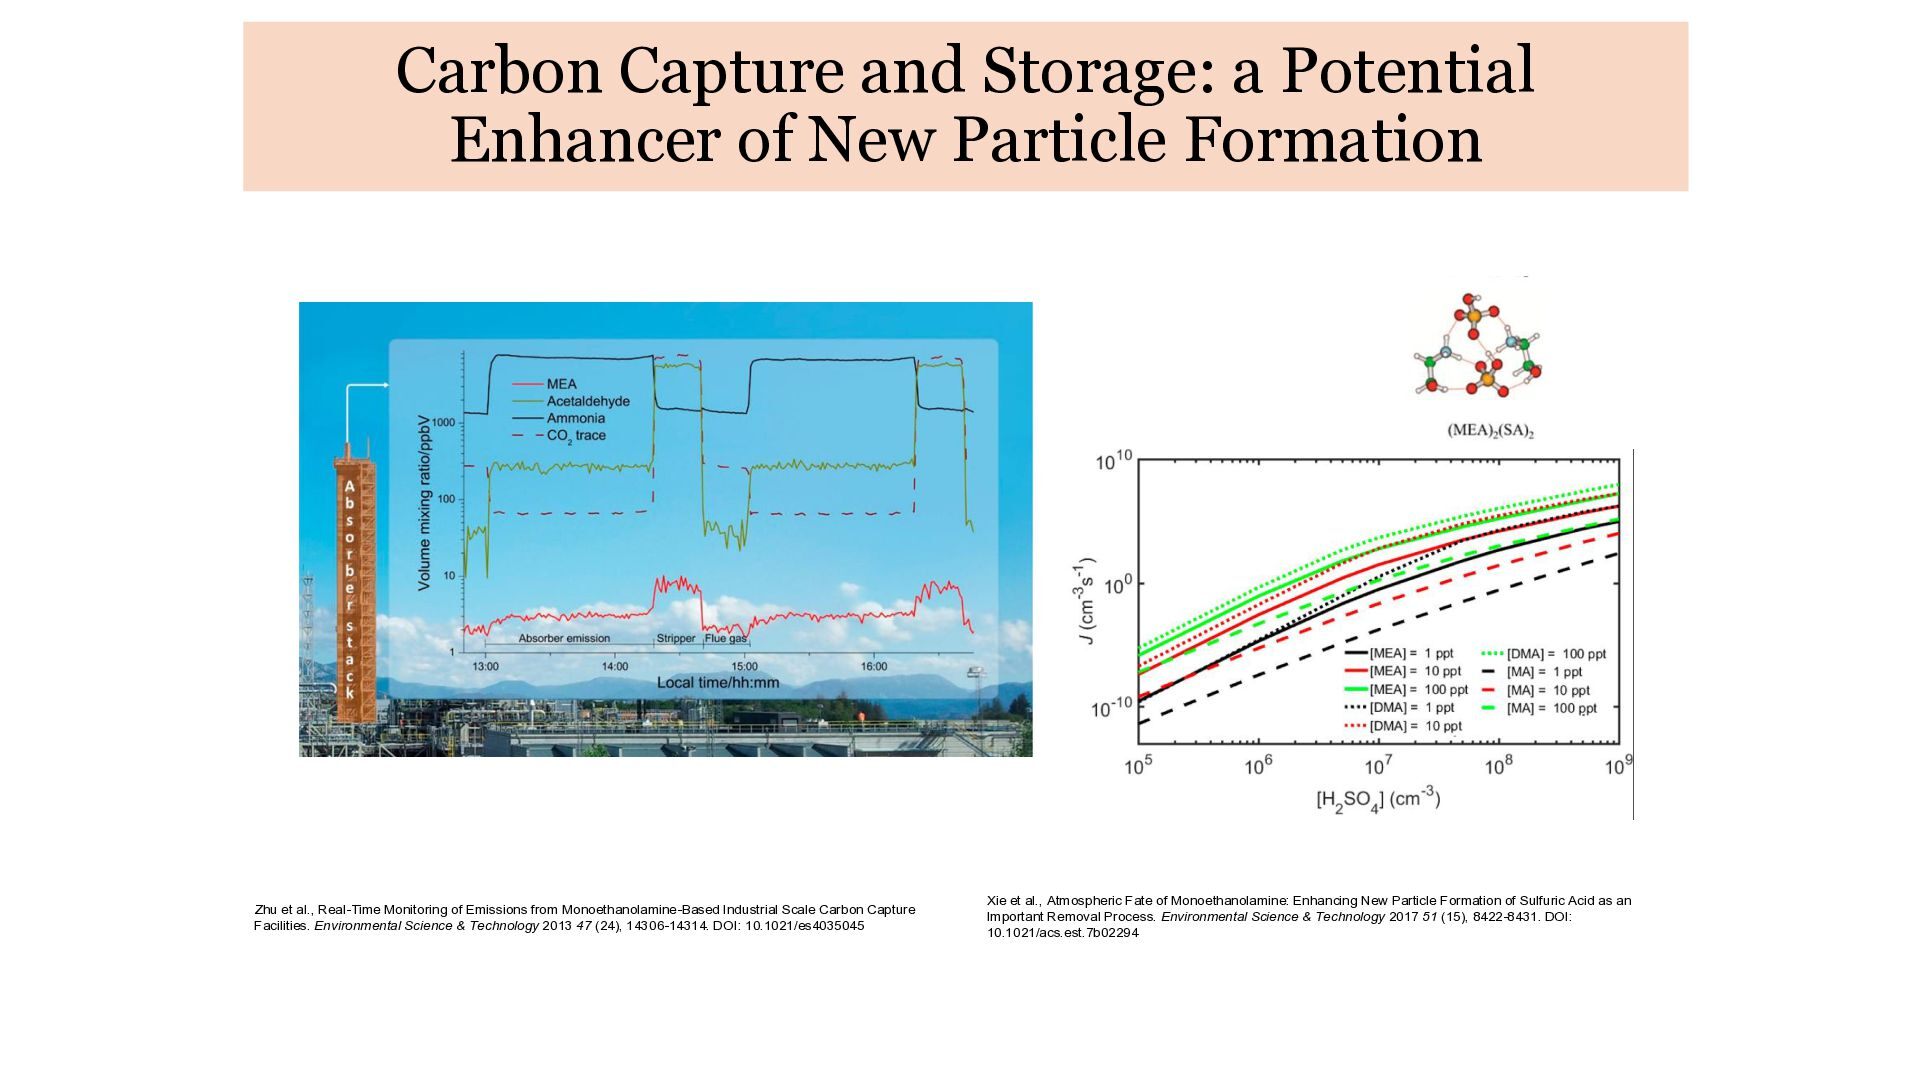
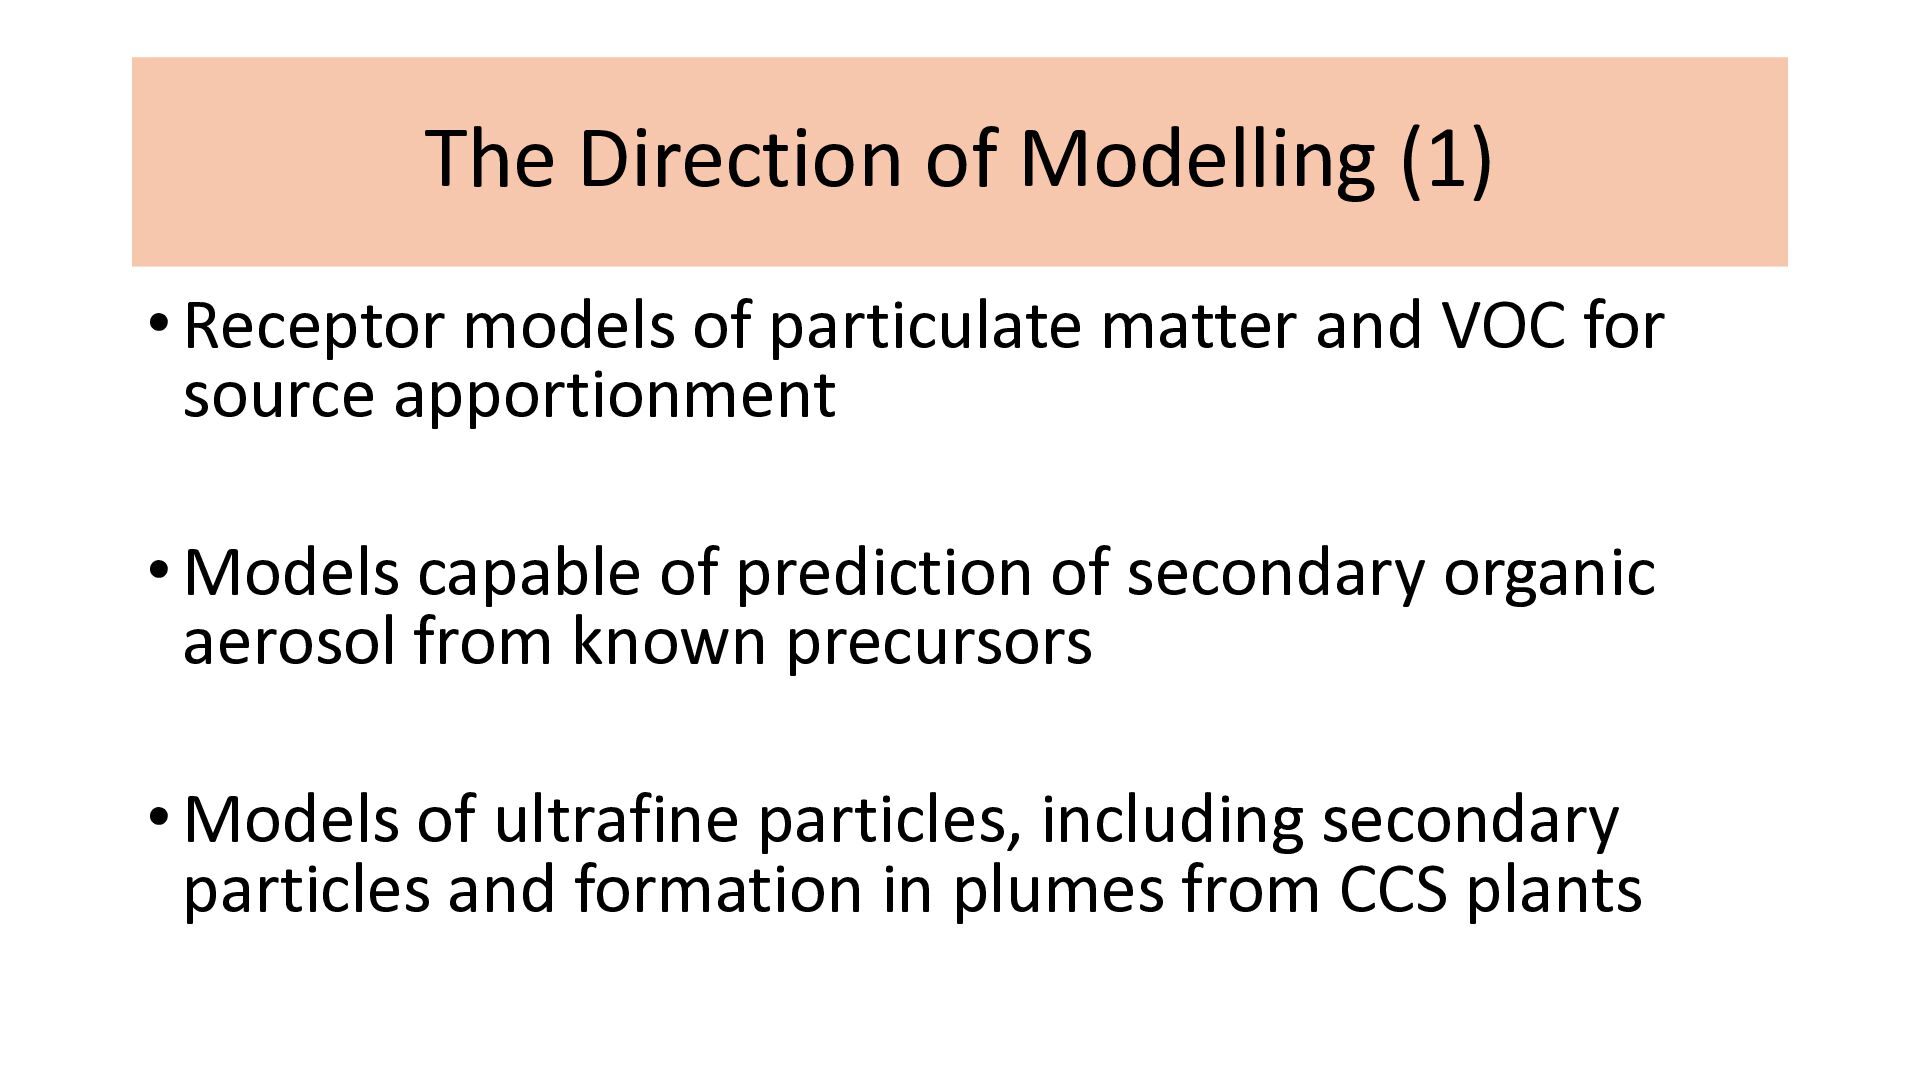
matter and VOC for source apportionment • Models capable of prediction of secondary organic aerosol from known precursors • Models of ultrafine particles, including secondary particles and formation in plumes from CCS plants
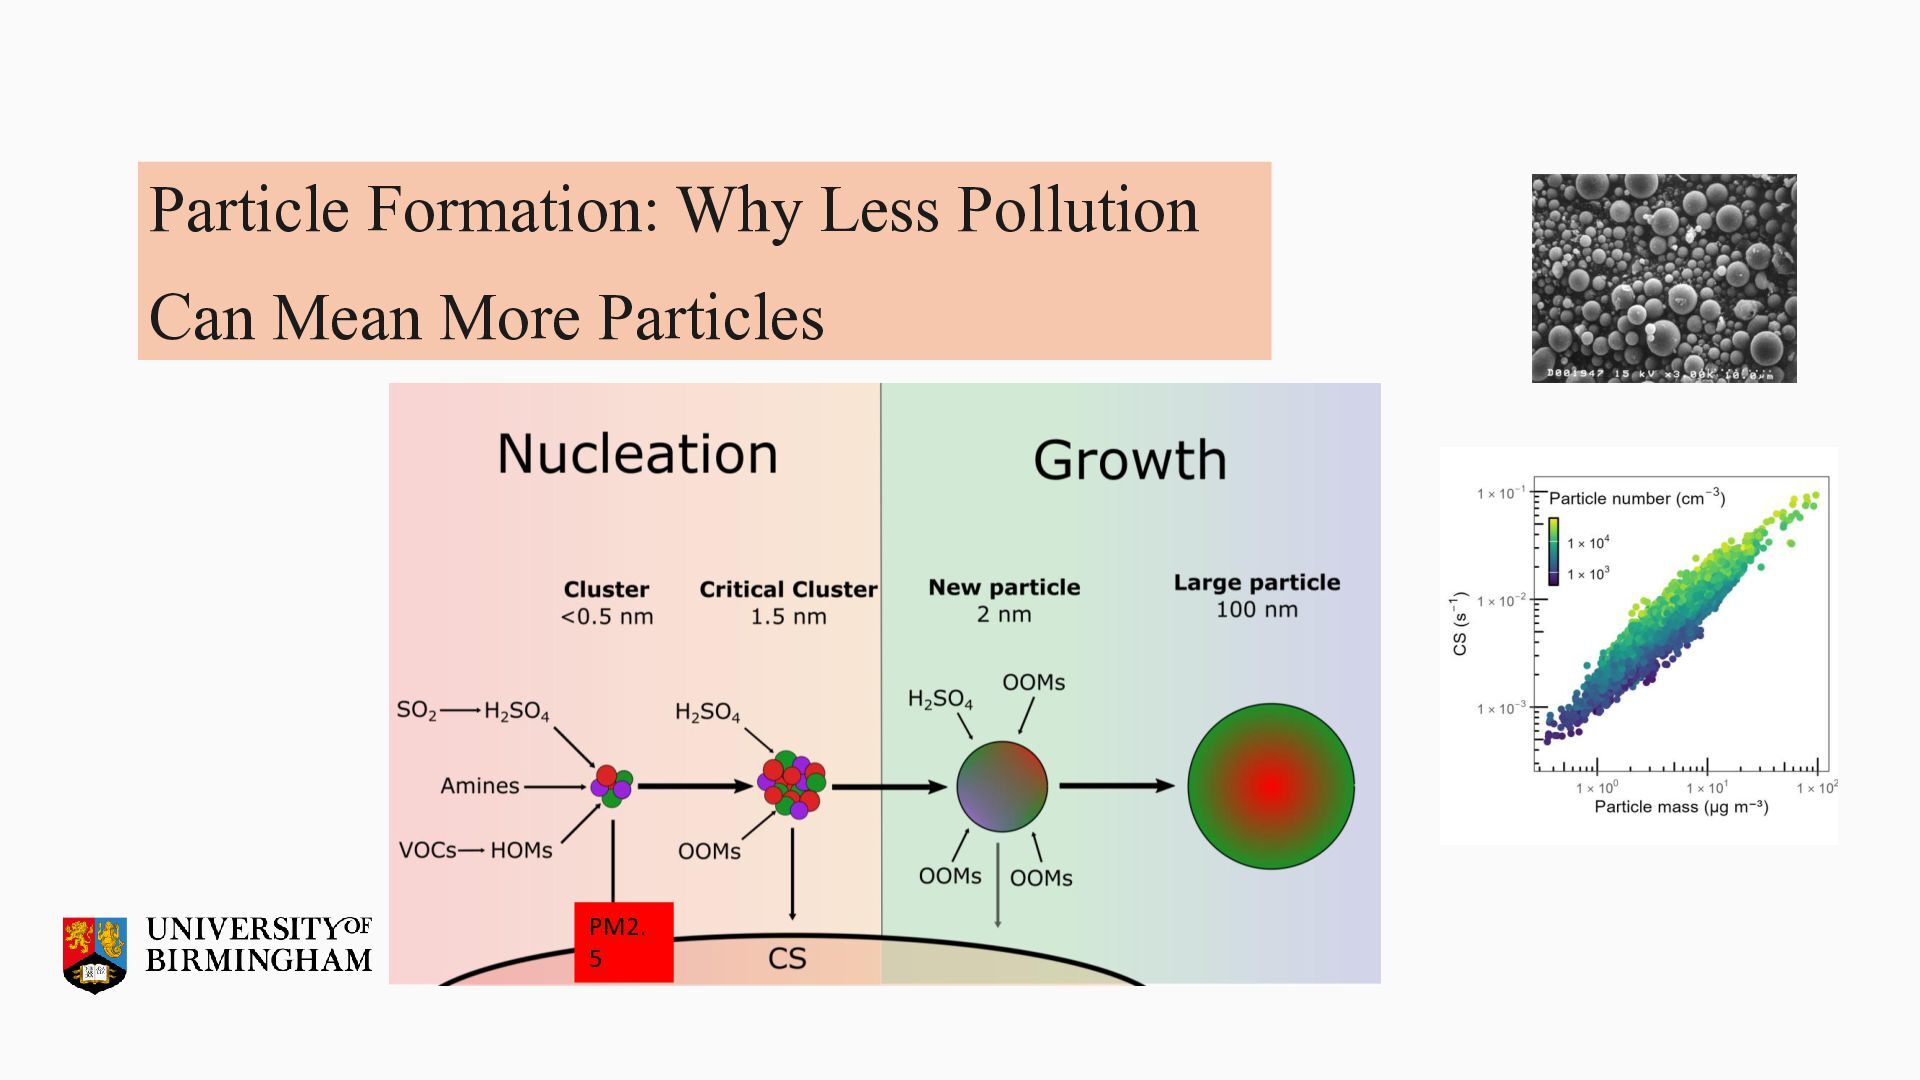
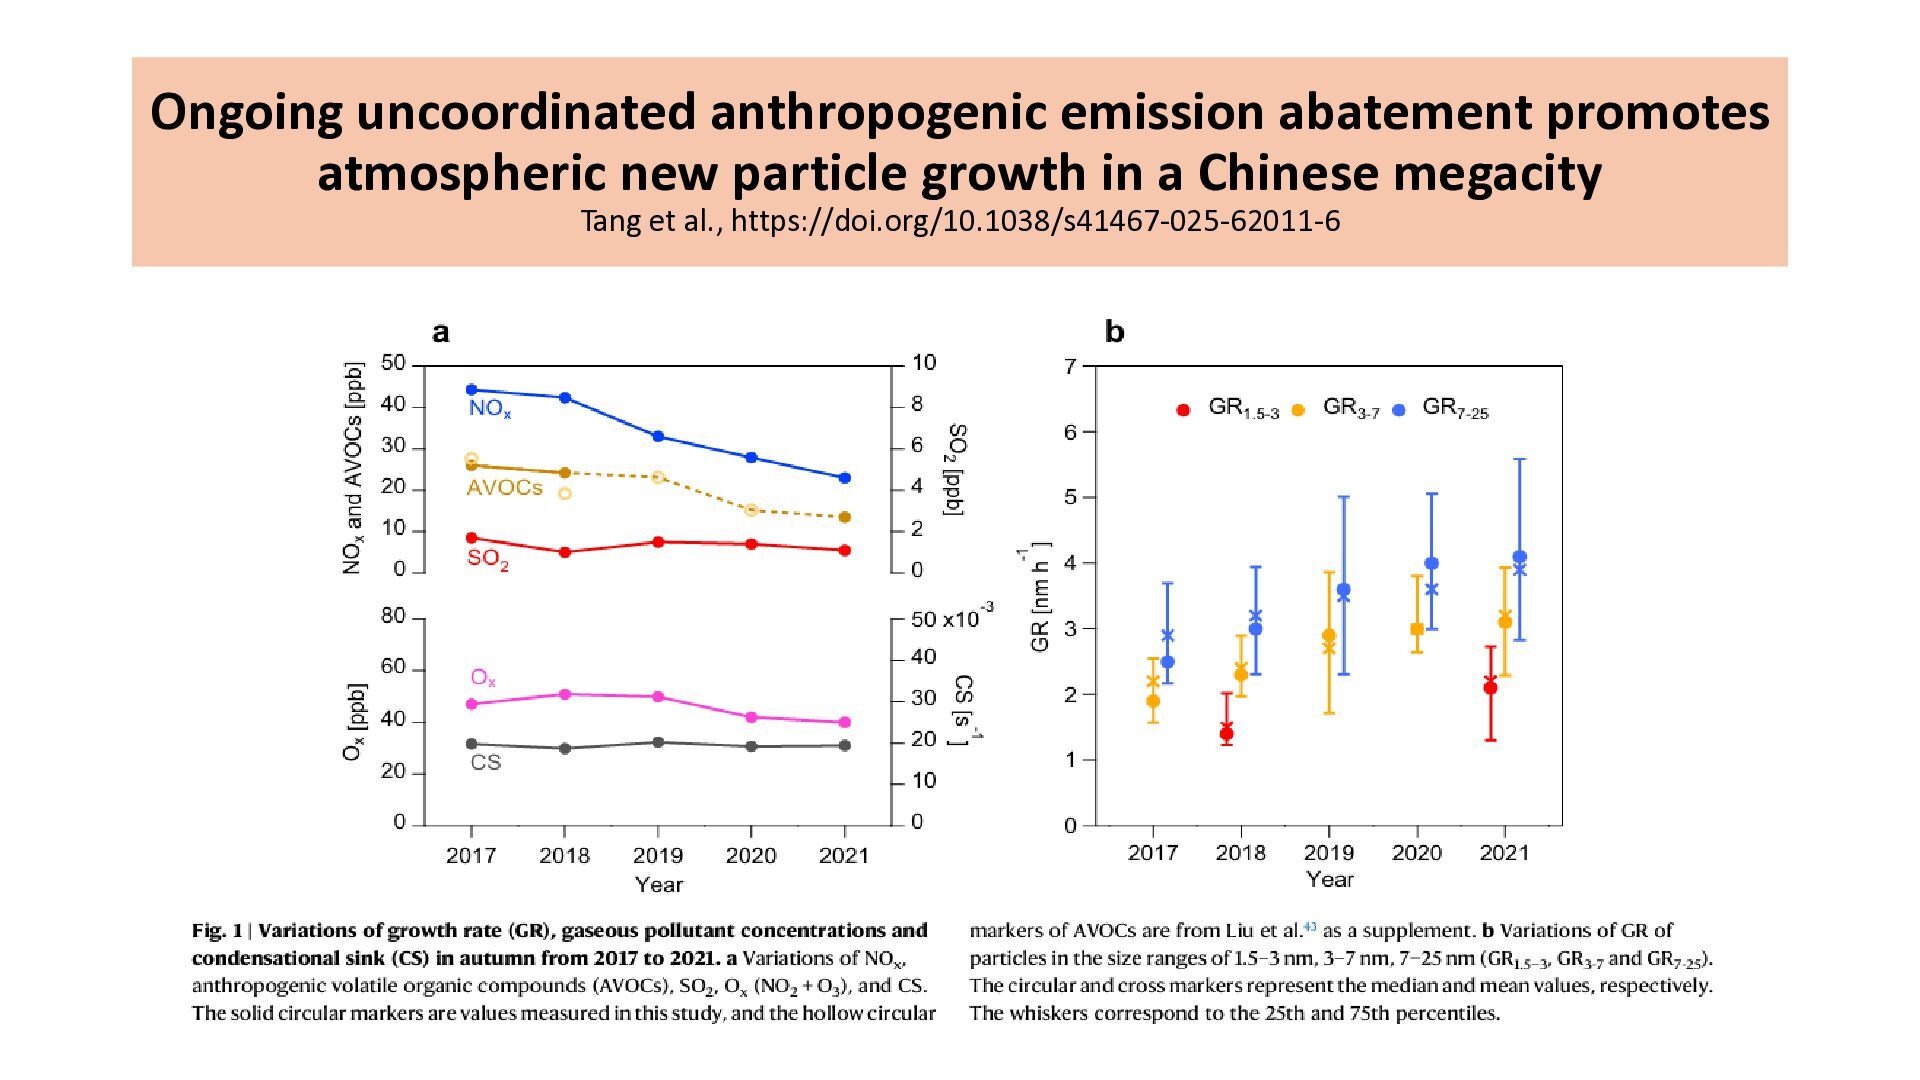
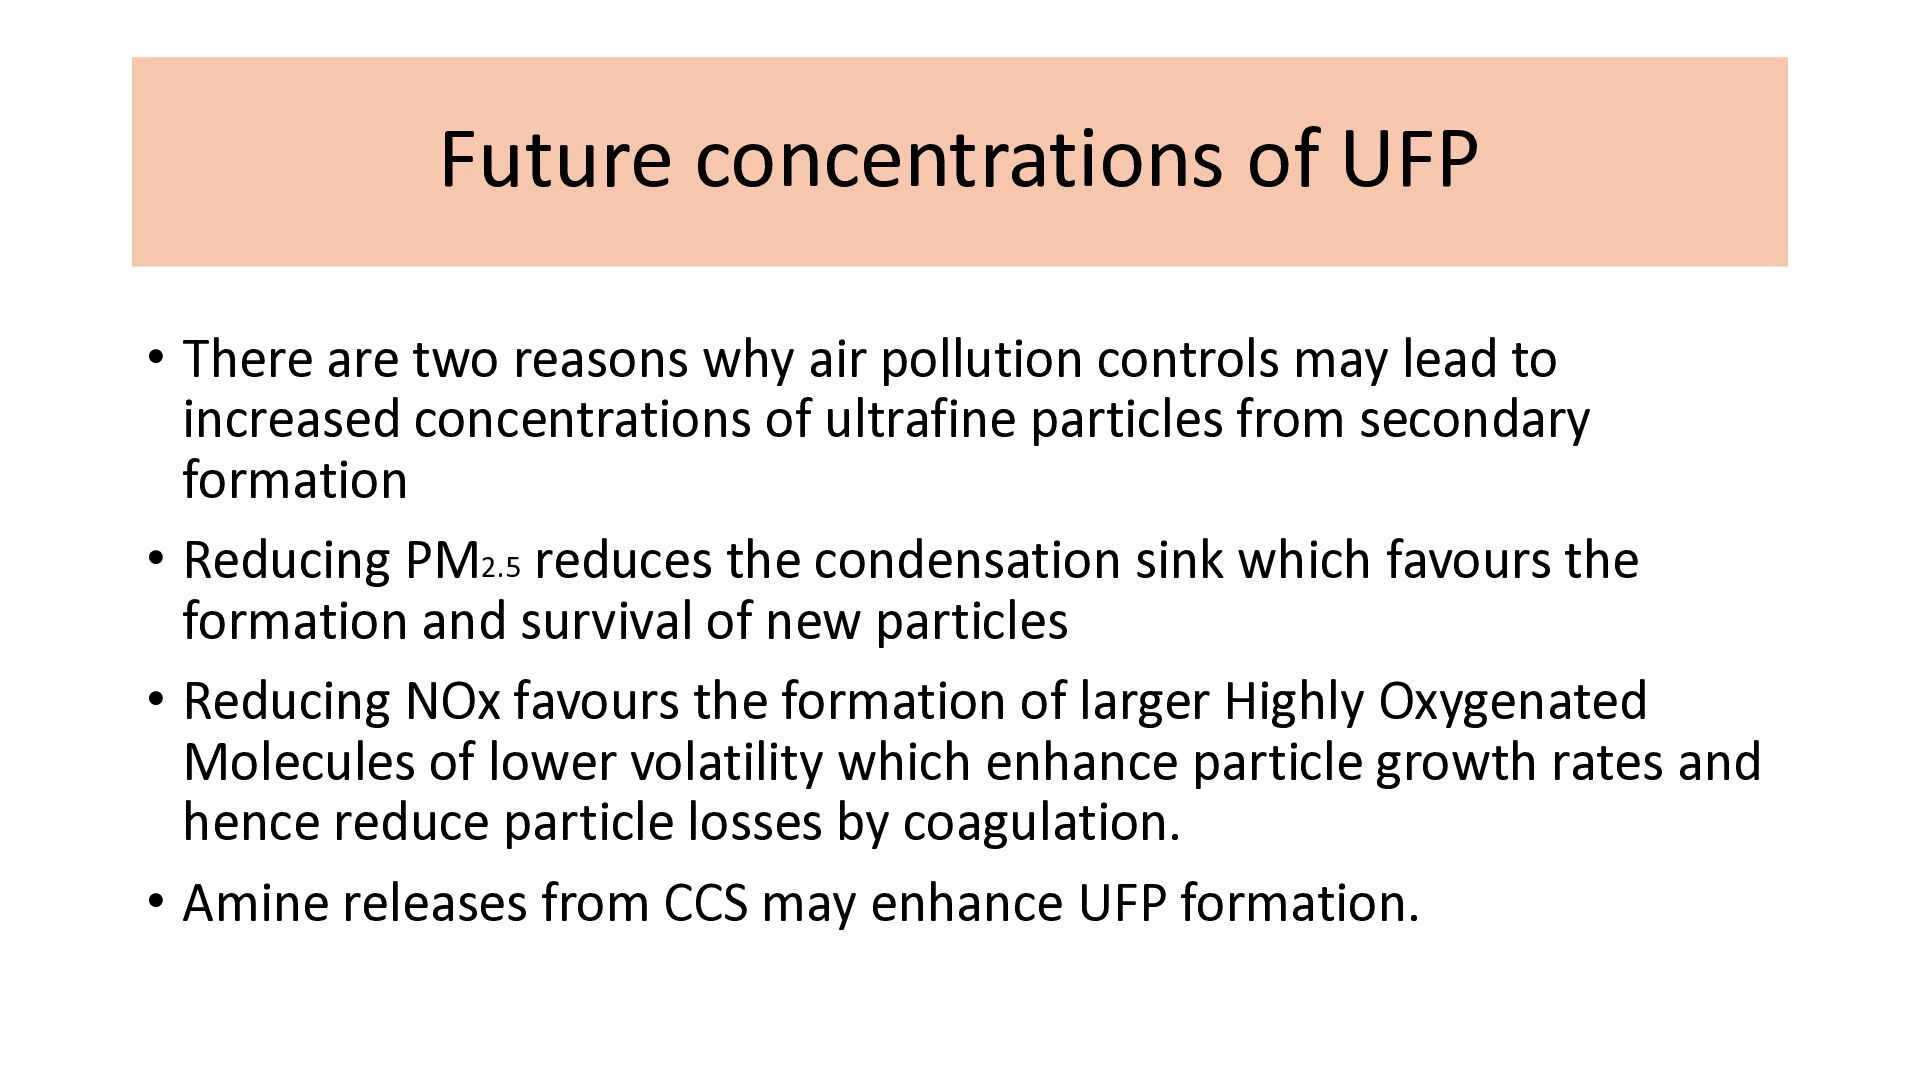
air pollution controls may lead to increased concentrations of ultrafine particles from secondary formation • Reducing PM2.5 reduces the condensation sink which favours the formation and survival of new particles • Reducing NOx favours the formation of larger Highly Oxygenated Molecules of lower volatility which enhance particle growth rates and hence reduce particle losses by coagulation. • Amine releases from CCS may enhance UFP formation.
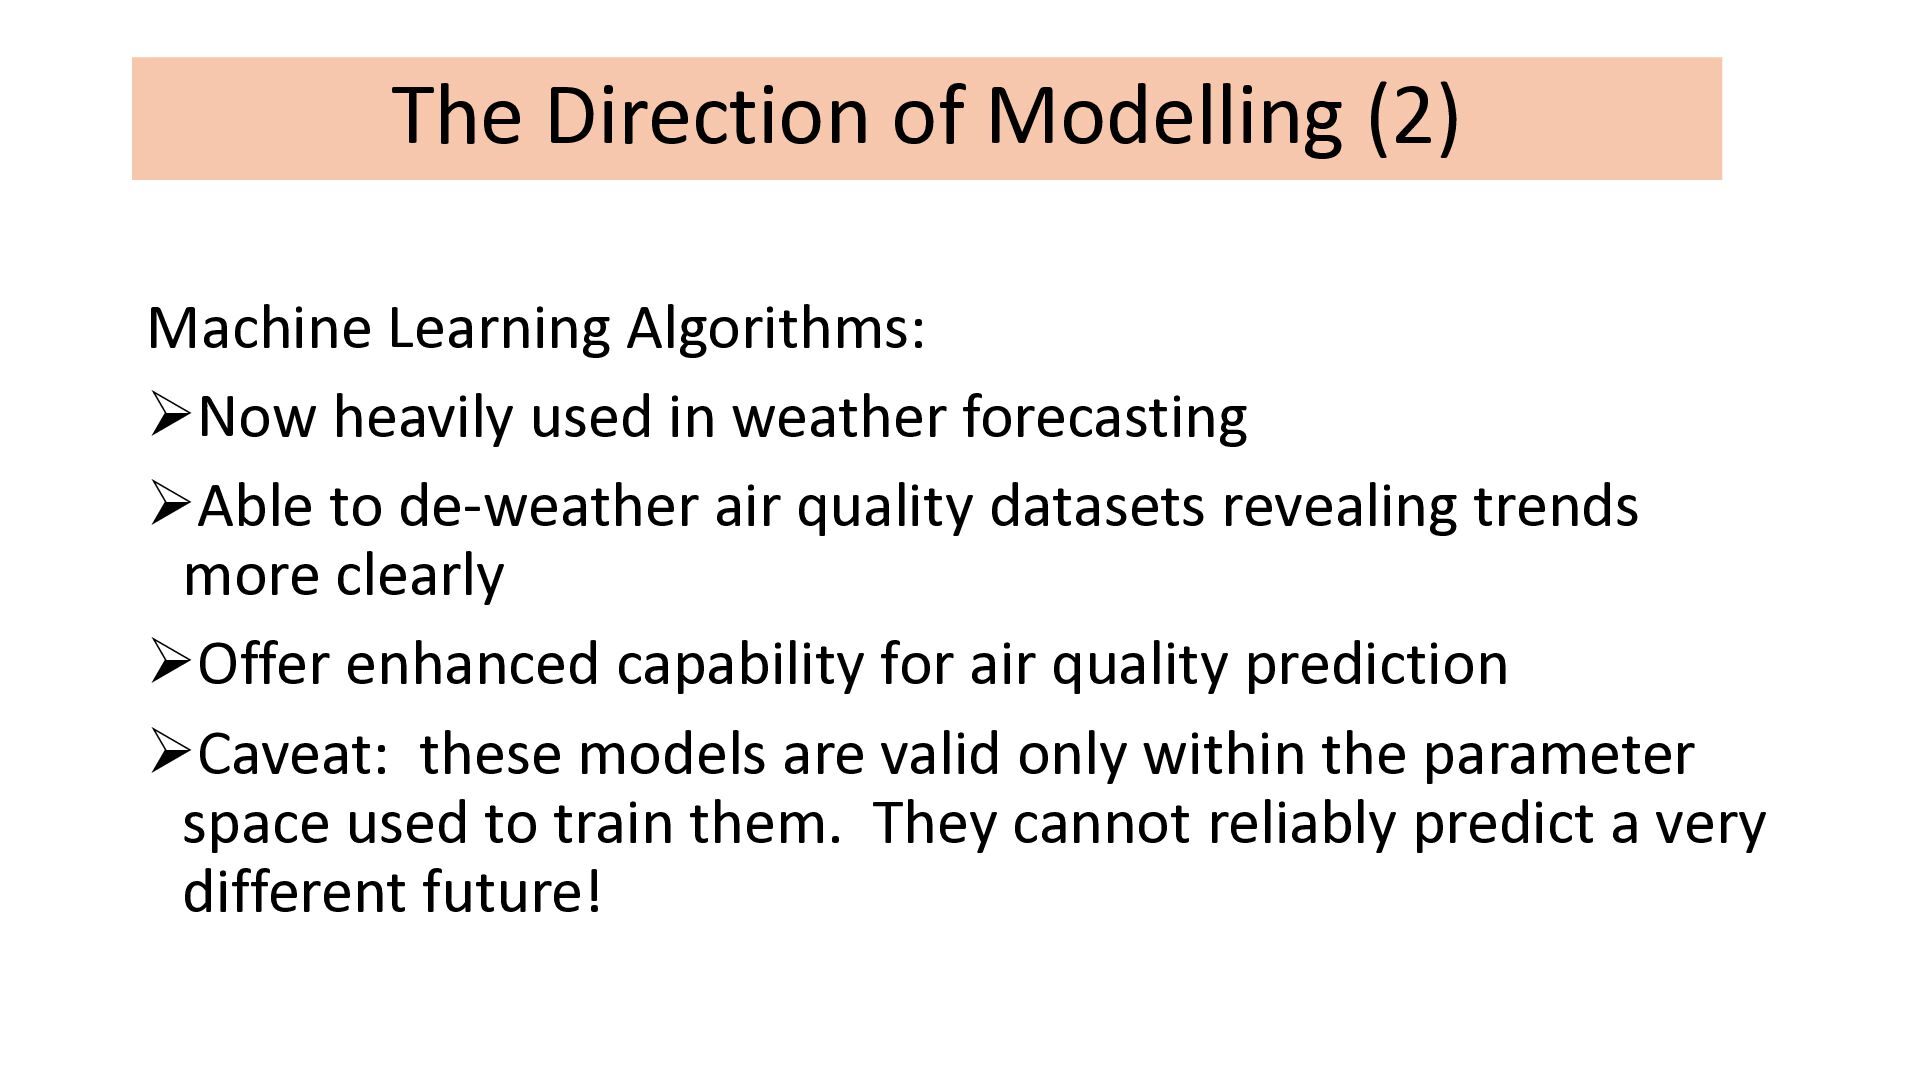
used in weather forecasting ➢Able to de-weather air quality datasets revealing trends more clearly ➢Offer enhanced capability for air quality prediction ➢Caveat: these models are valid only within the parameter space used to train them. They cannot reliably predict a very different future!


 iesevents
 lindahogenes
 trishagee
 cassininazir
 techseoconnect
 kevinliebholz
 akademiya2063
 tenderlove
 schlessera
 bethany
 csswizardry
 jnunemaker