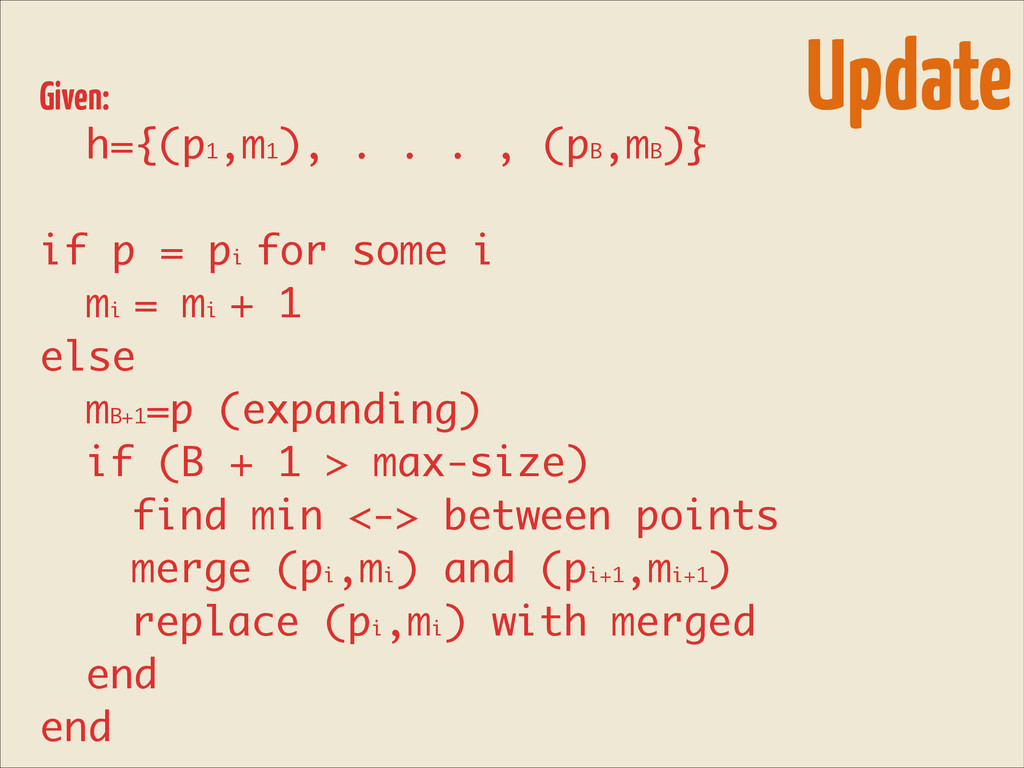
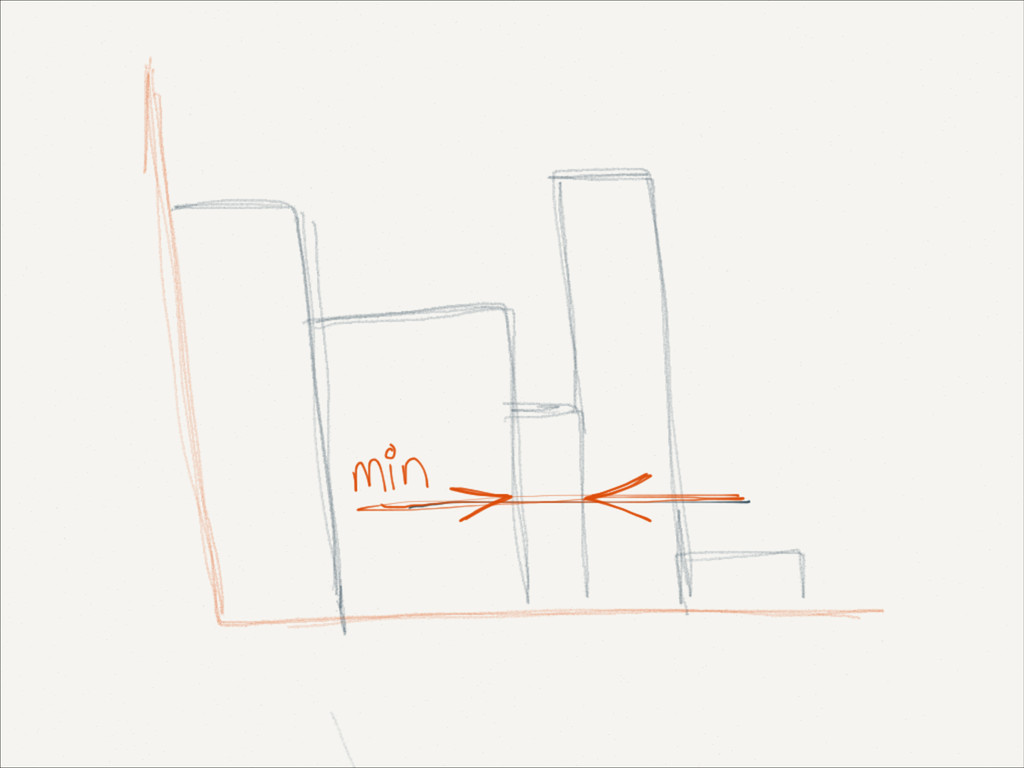
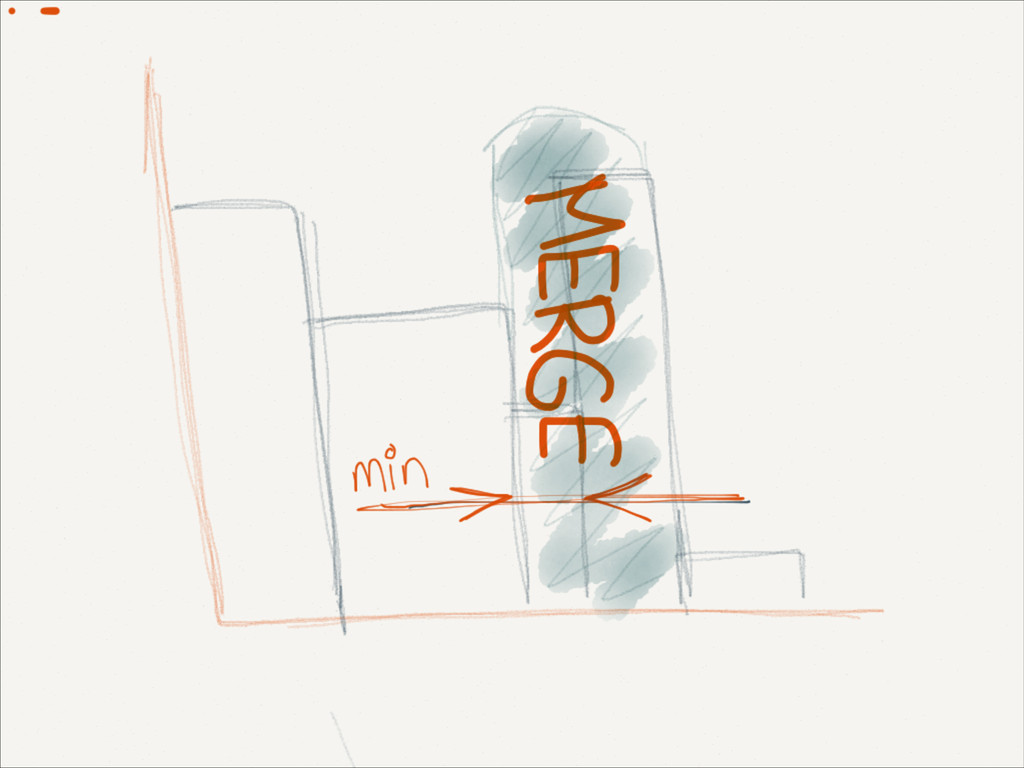
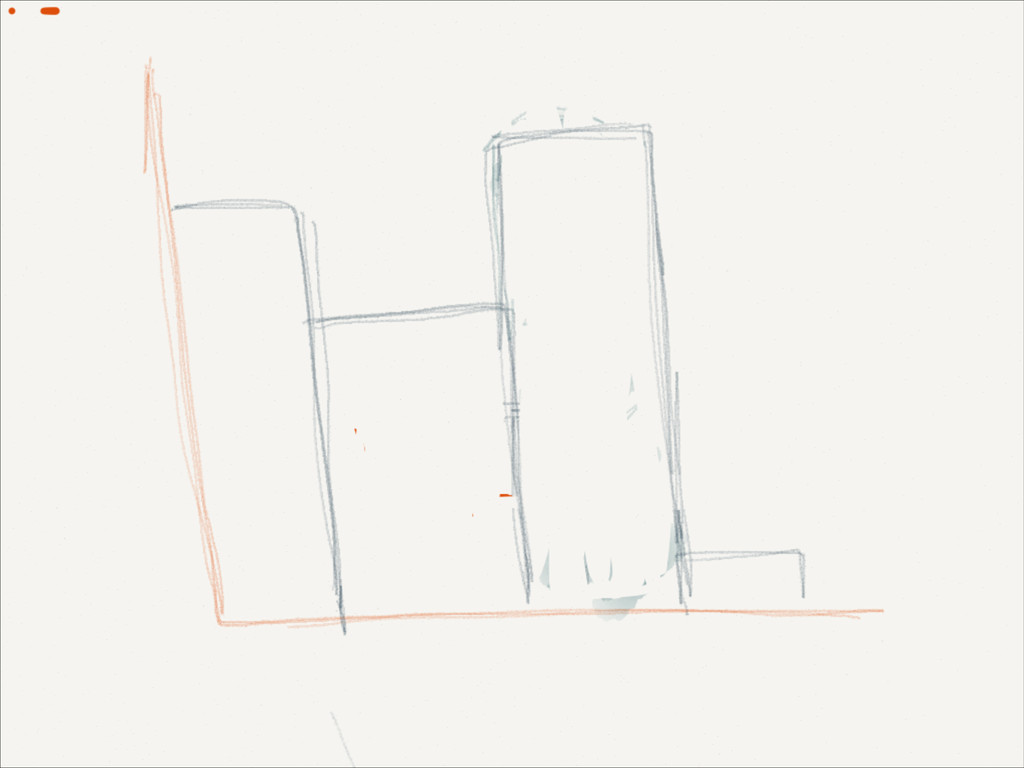
,mB )} ! if p = pi for some i mi = mi + 1 else mB+1 =p (expanding) if (B + 1 > max-size) find min <-> between points merge (pi ,mi ) and (pi+1 ,mi+1 ) replace (pi ,mi ) with merged end end
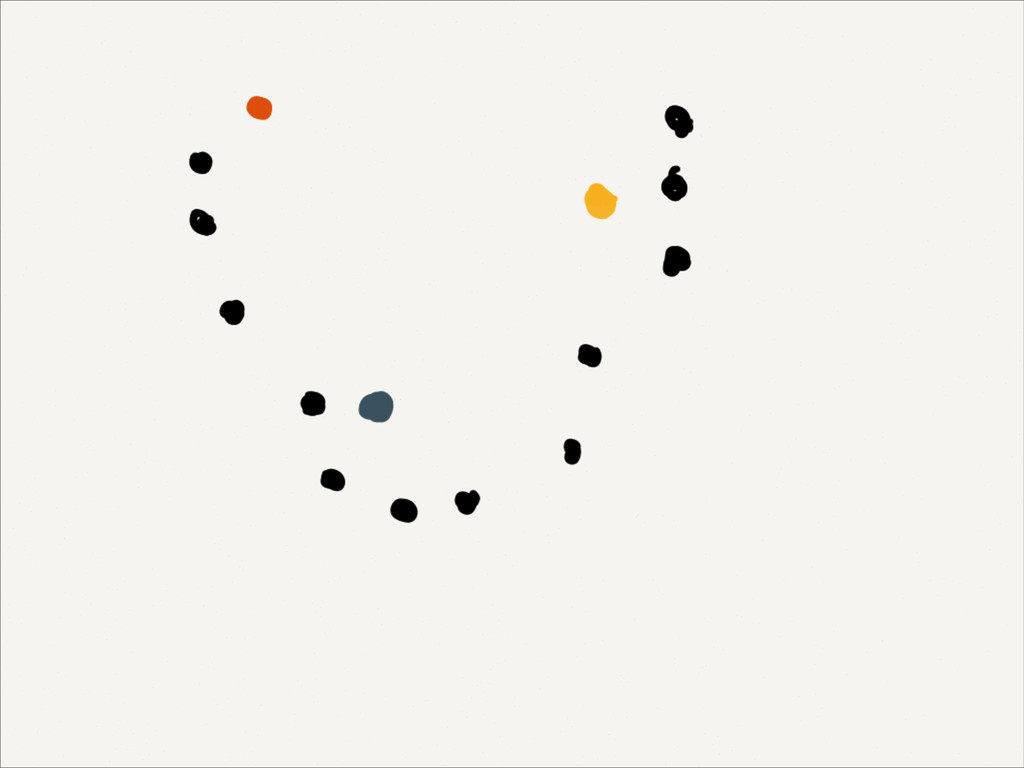
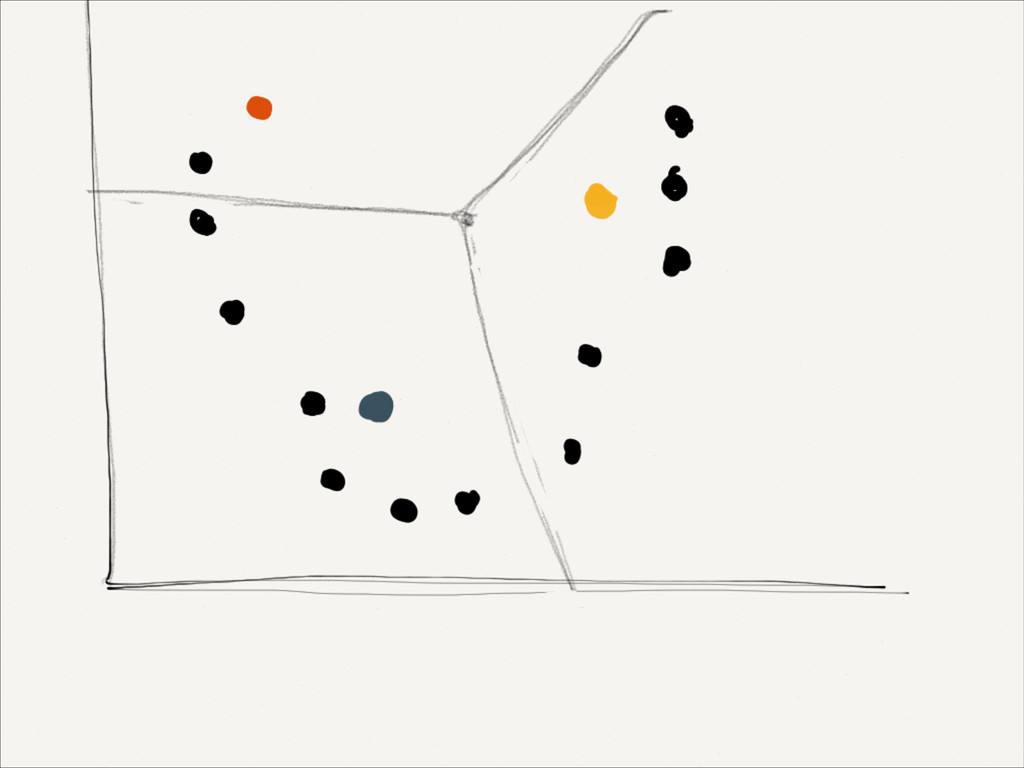
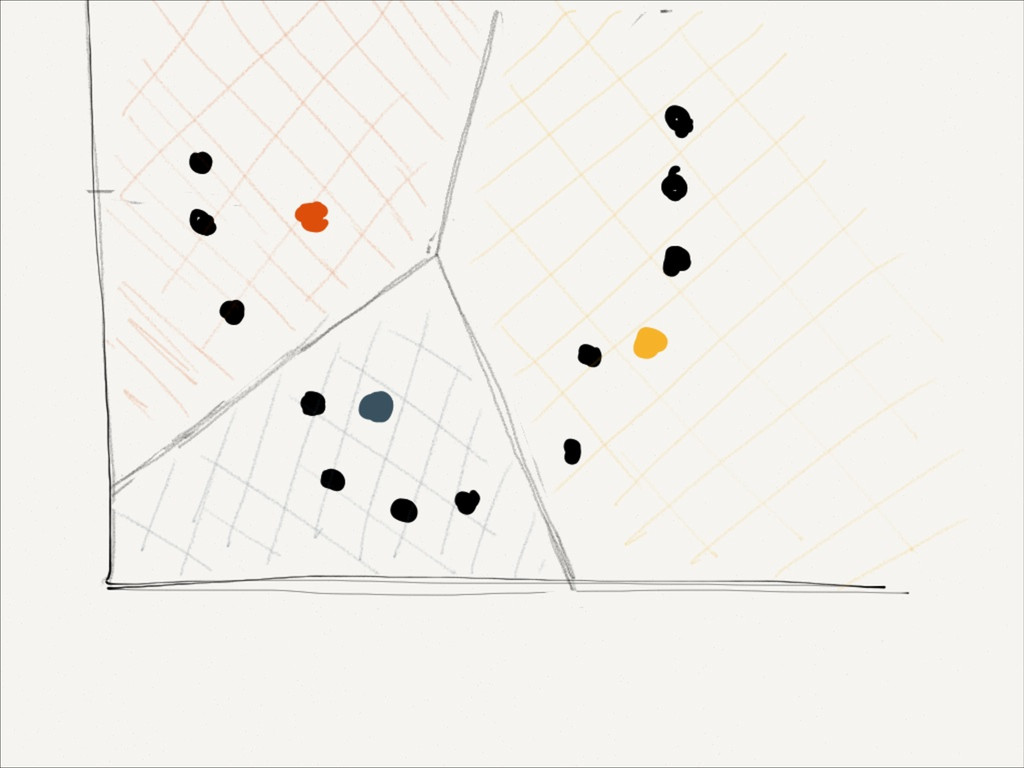
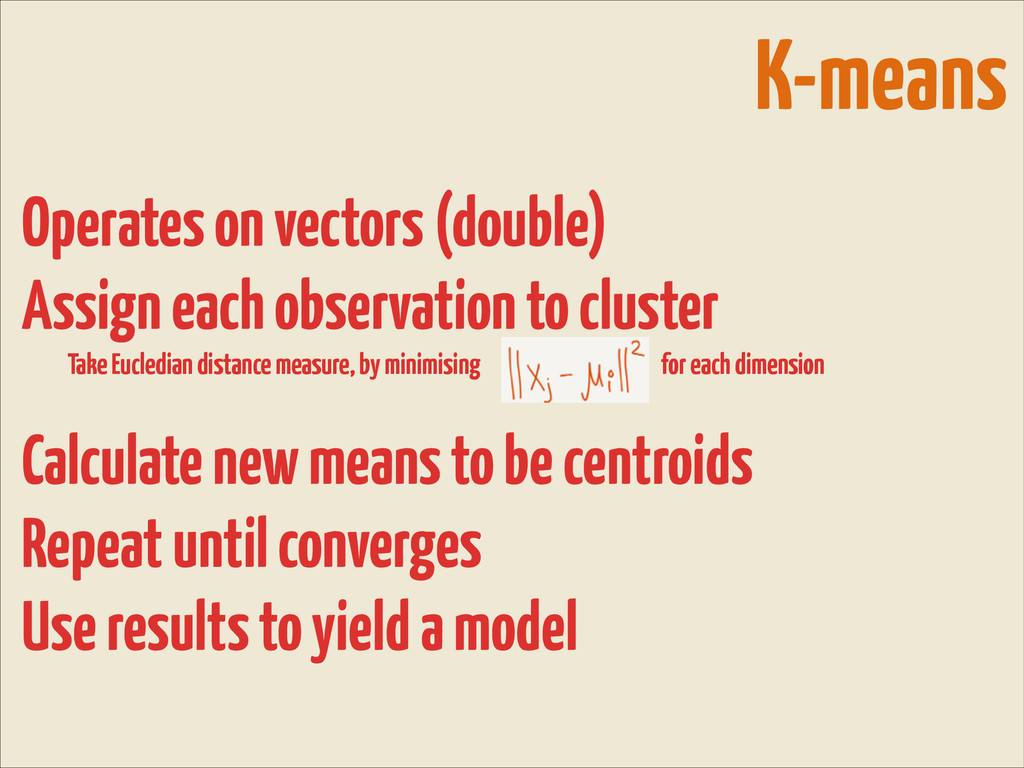
Eucledian distance measure, by minimising for each dimension ! Calculate new means to be centroids Repeat until converges Use results to yield a model K-means