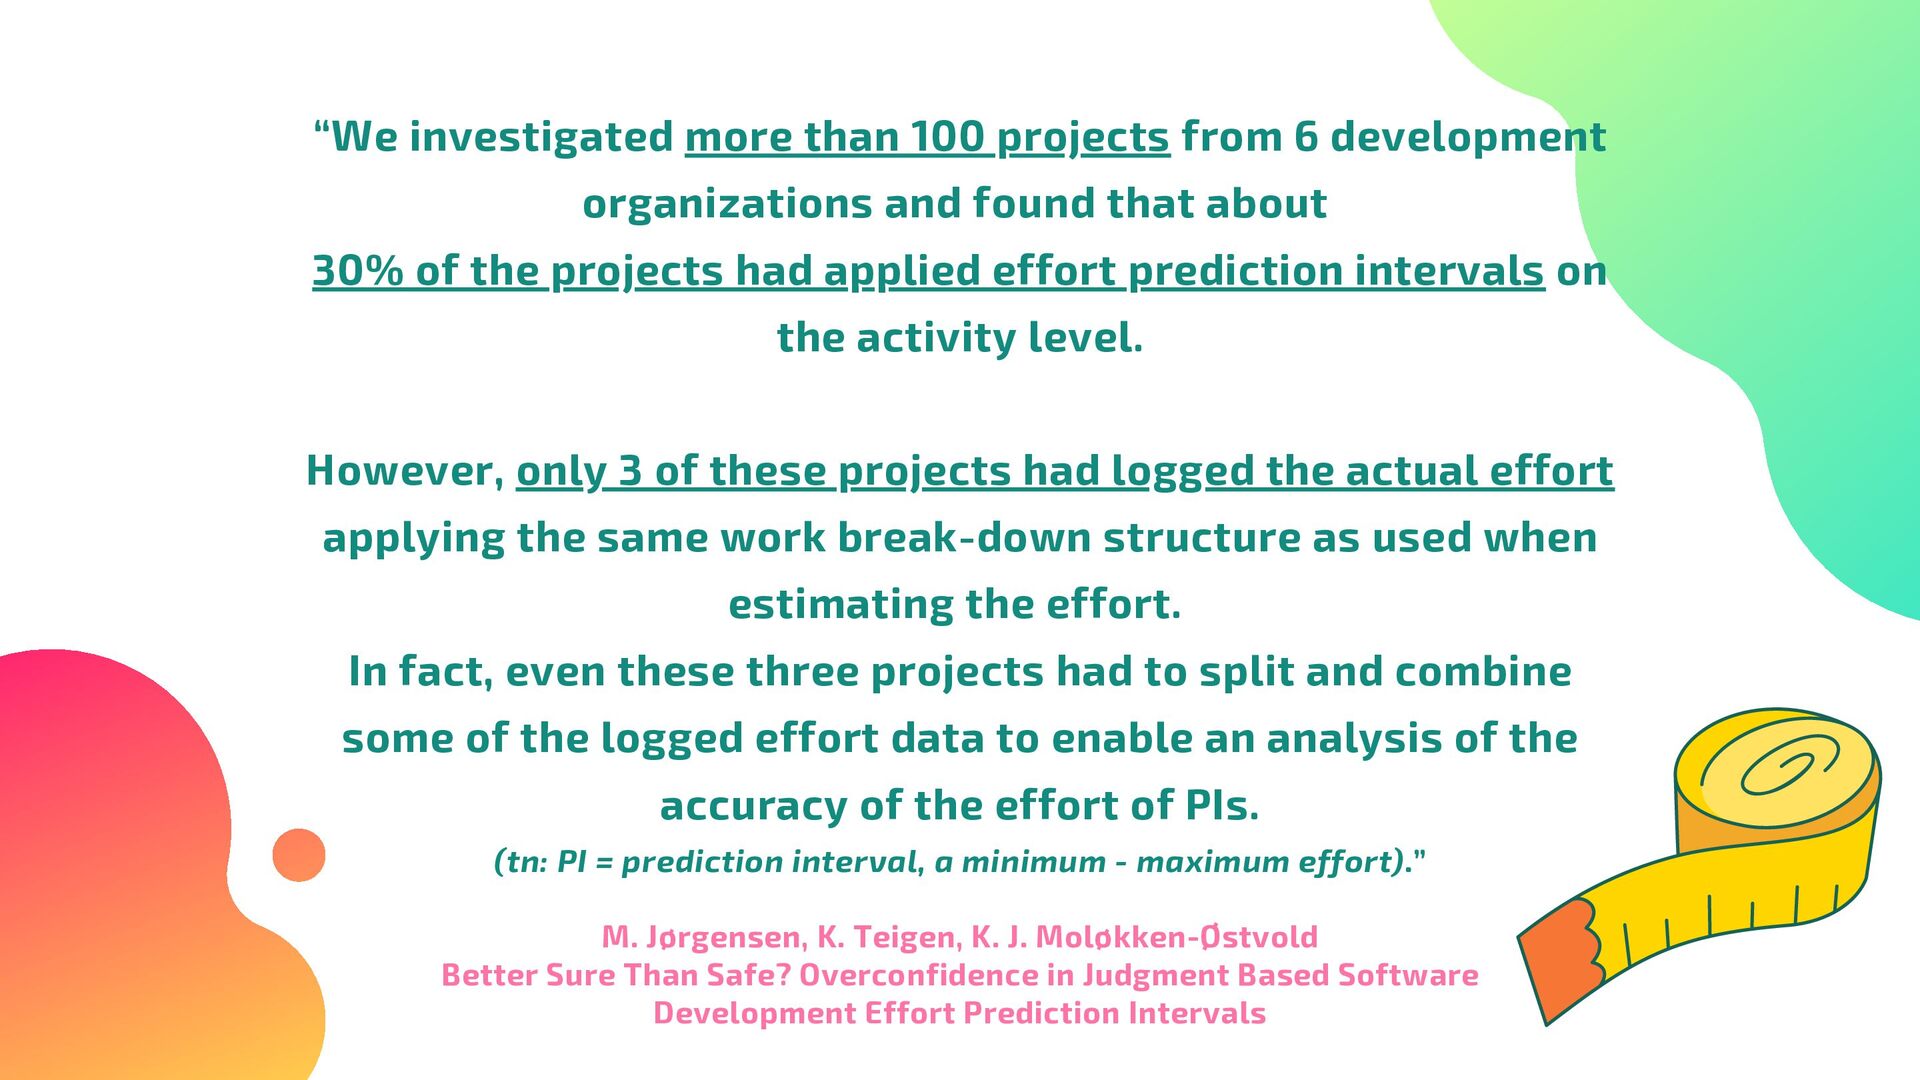
and found that about 30% of the projects had applied effort prediction intervals on the activity level. However, only 3 of these projects had logged the actual effort applying the same work break-down structure as used when estimating the effort. In fact, even these three projects had to split and combine some of the logged effort data to enable an analysis of the accuracy of the effort of PIs. (tn: PI = prediction interval, a minimum - maximum effort).” M. Jørgensen, K. Teigen, K. J. Moløkken-Østvold Better Sure Than Safe? Overconfidence in Judgment Based Software Development Effort Prediction Intervals
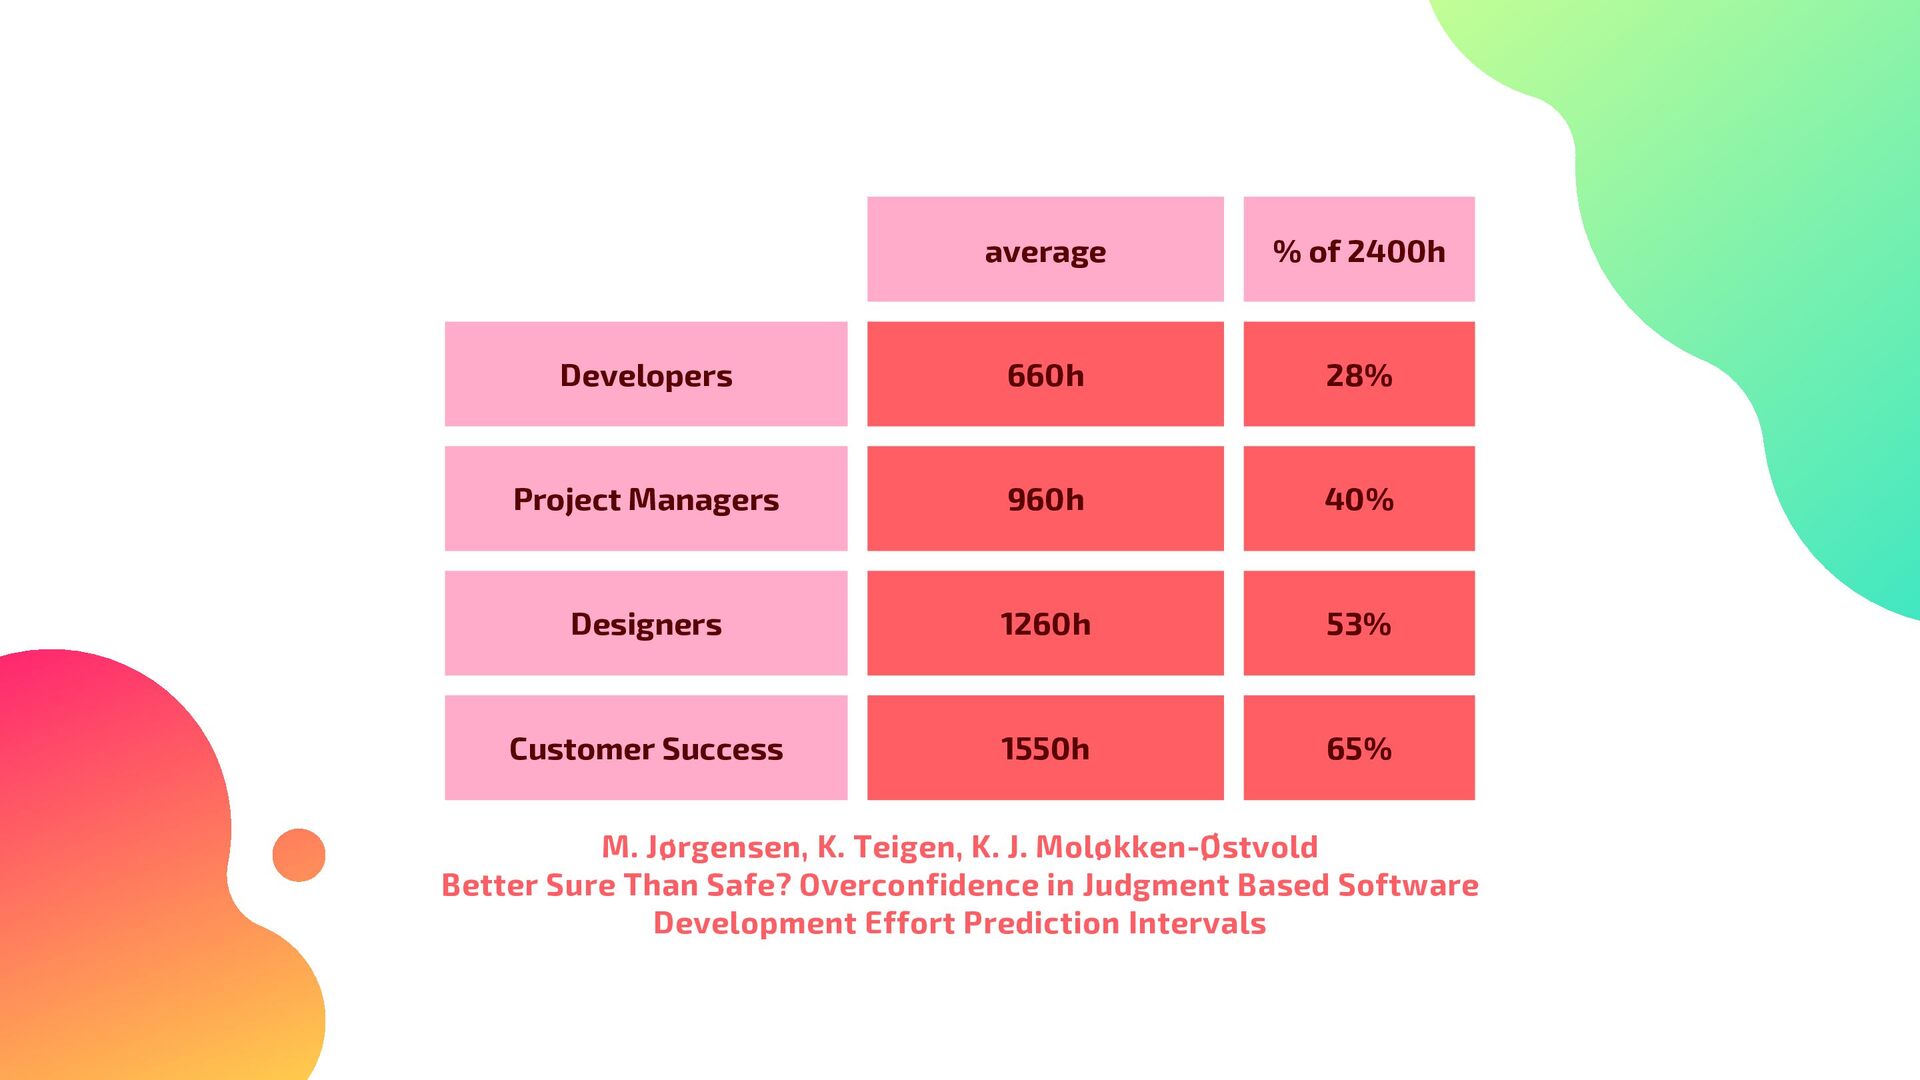
40% Designers 1260h 53% Customer Success 1550h 65% M. Jørgensen, K. Teigen, K. J. Moløkken-Østvold Better Sure Than Safe? Overconfidence in Judgment Based Software Development Effort Prediction Intervals
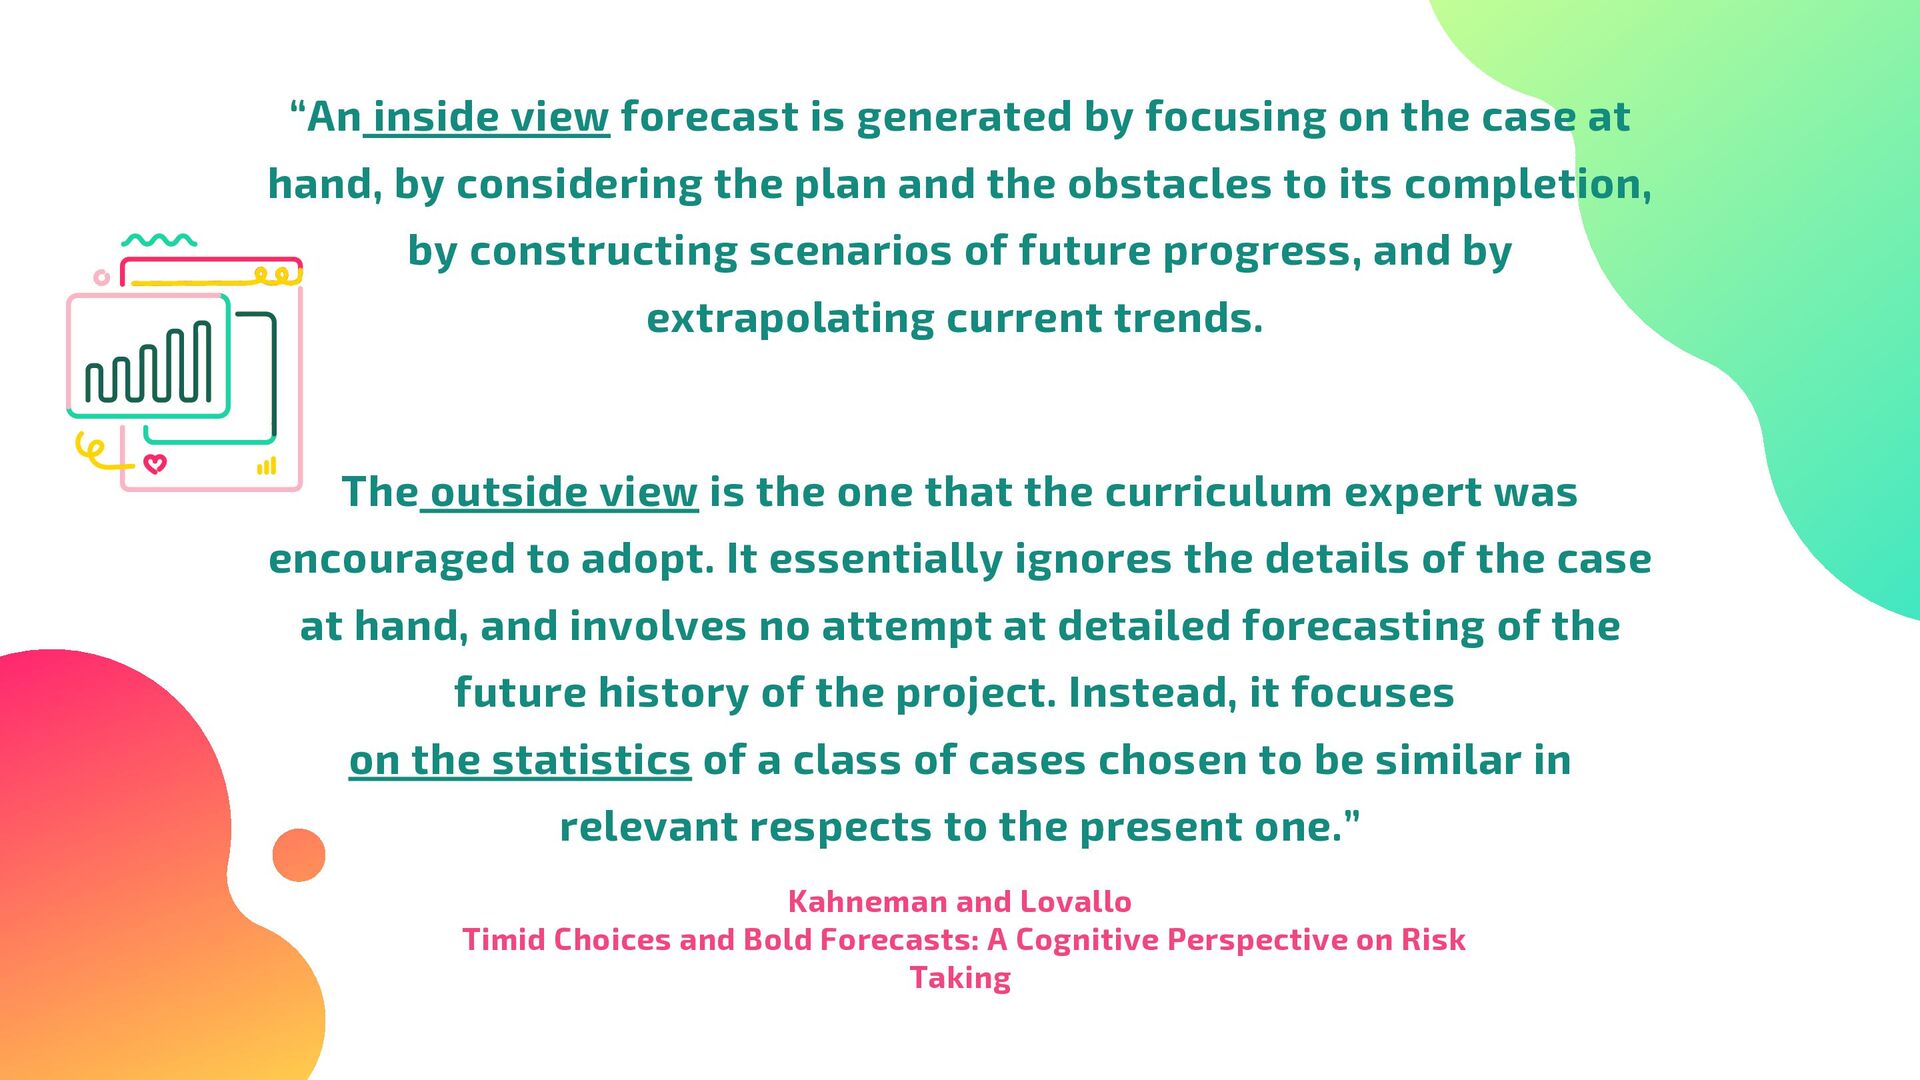
effort PIs, only to more confidence in the estimates. This is in line with the distinction between an “inside” versus an “outside” view in predictions (Kahneman and Lovallo 1993).” M. Jørgensen, K. Teigen, K. J. Moløkken-Østvold Better Sure Than Safe? Overconfidence in Judgment Based Software Development Effort Prediction Intervals
case at hand, by considering the plan and the obstacles to its completion, by constructing scenarios of future progress, and by extrapolating current trends. The outside view is the one that the curriculum expert was encouraged to adopt. It essentially ignores the details of the case at hand, and involves no attempt at detailed forecasting of the future history of the project. Instead, it focuses on the statistics of a class of cases chosen to be similar in relevant respects to the present one.” Kahneman and Lovallo Timid Choices and Bold Forecasts: A Cognitive Perspective on Risk Taking
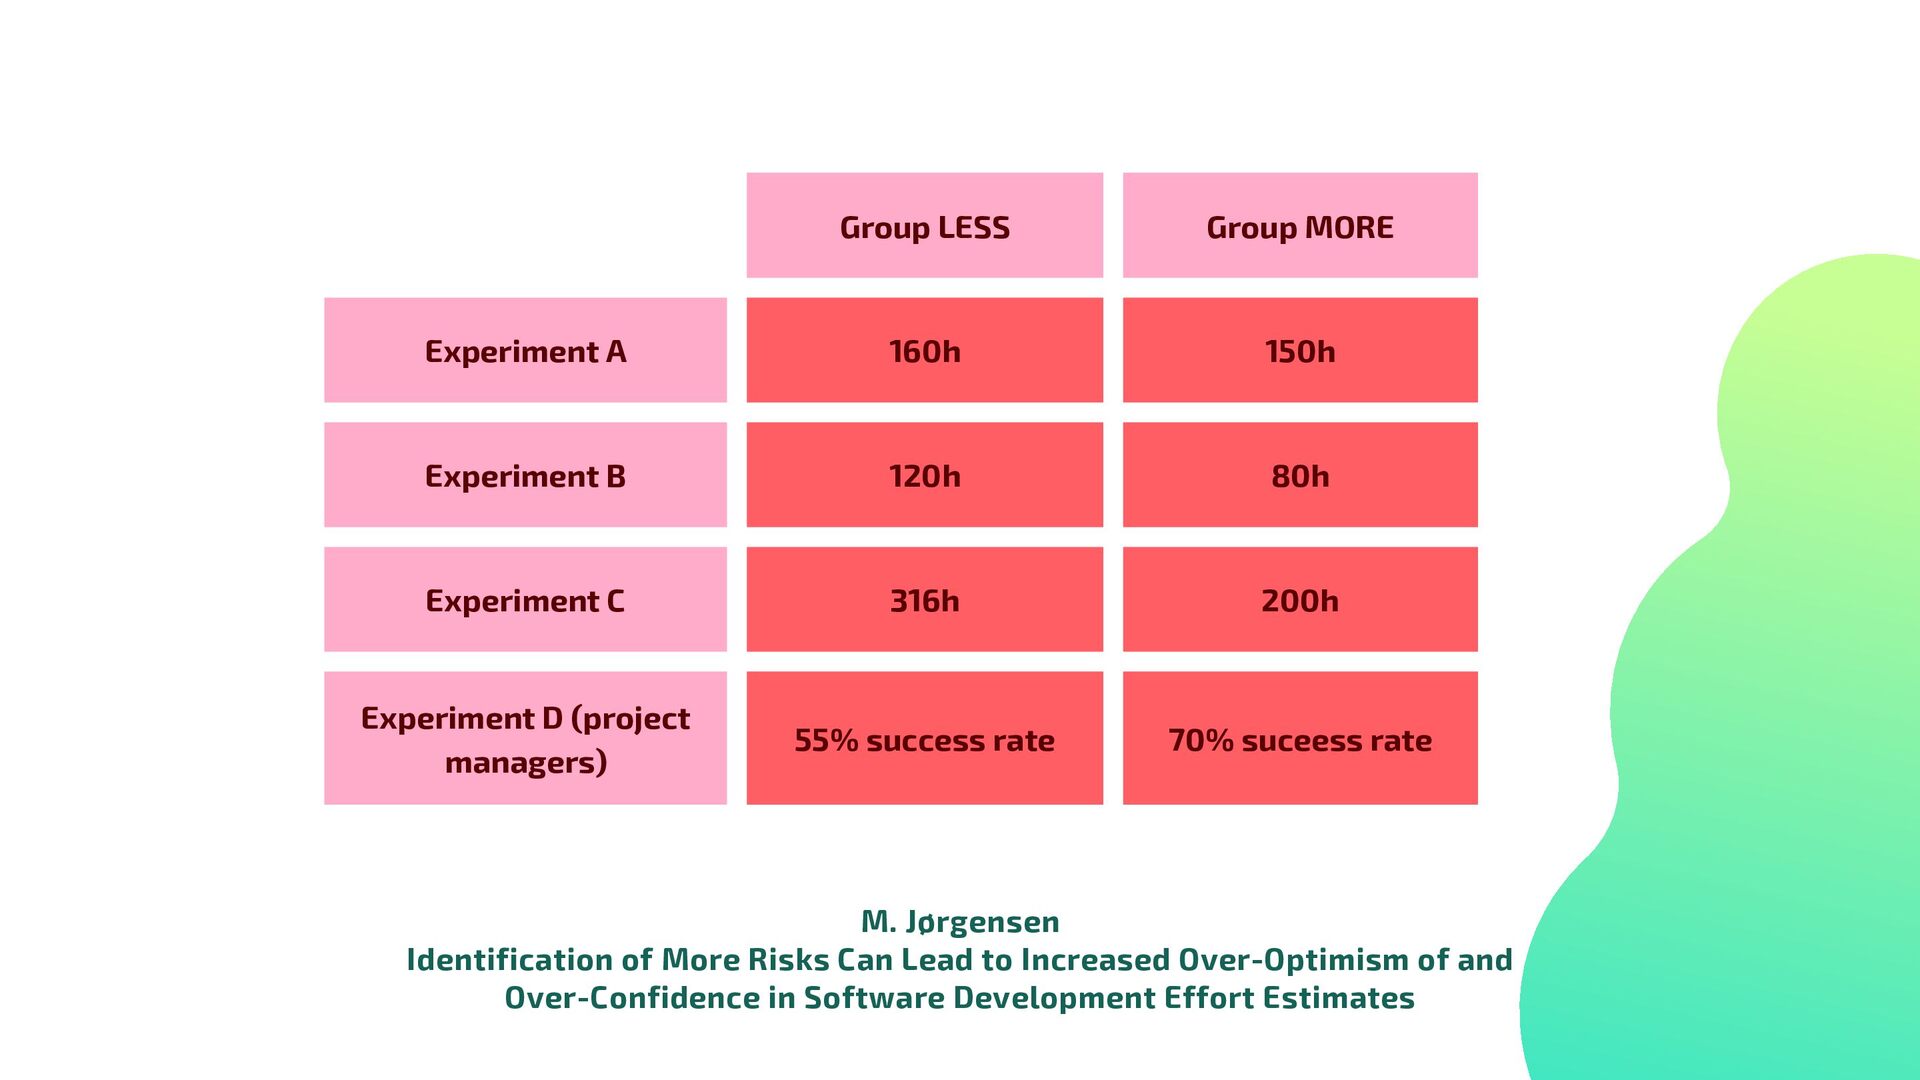
120h 80h Experiment C 316h 200h Experiment D (project managers) 55% success rate 70% suceess rate M. Jørgensen Identification of More Risks Can Lead to Increased Over-Optimism of and Over-Confidence in Software Development Effort Estimates
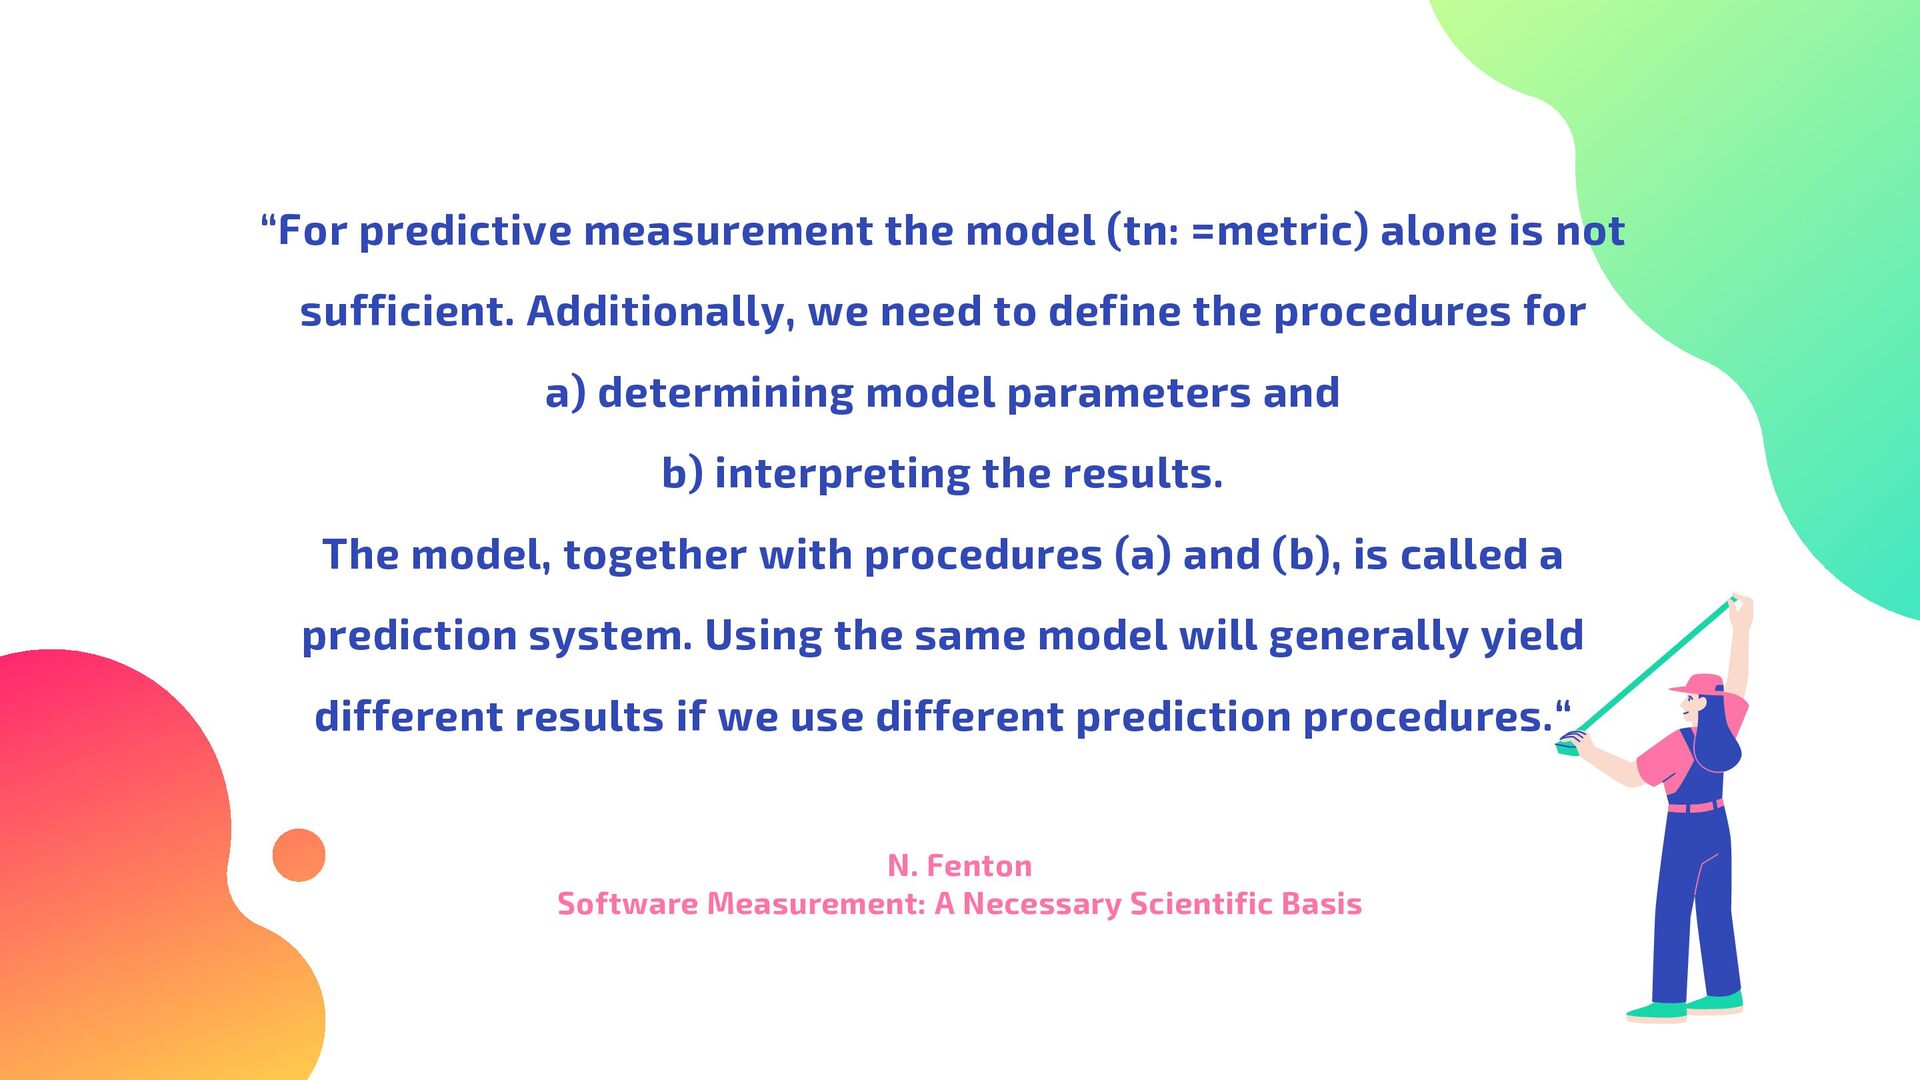
sufficient. Additionally, we need to define the procedures for a) determining model parameters and b) interpreting the results. The model, together with procedures (a) and (b), is called a prediction system. Using the same model will generally yield different results if we use different prediction procedures.“ N. Fenton Software Measurement: A Necessary Scientific Basis
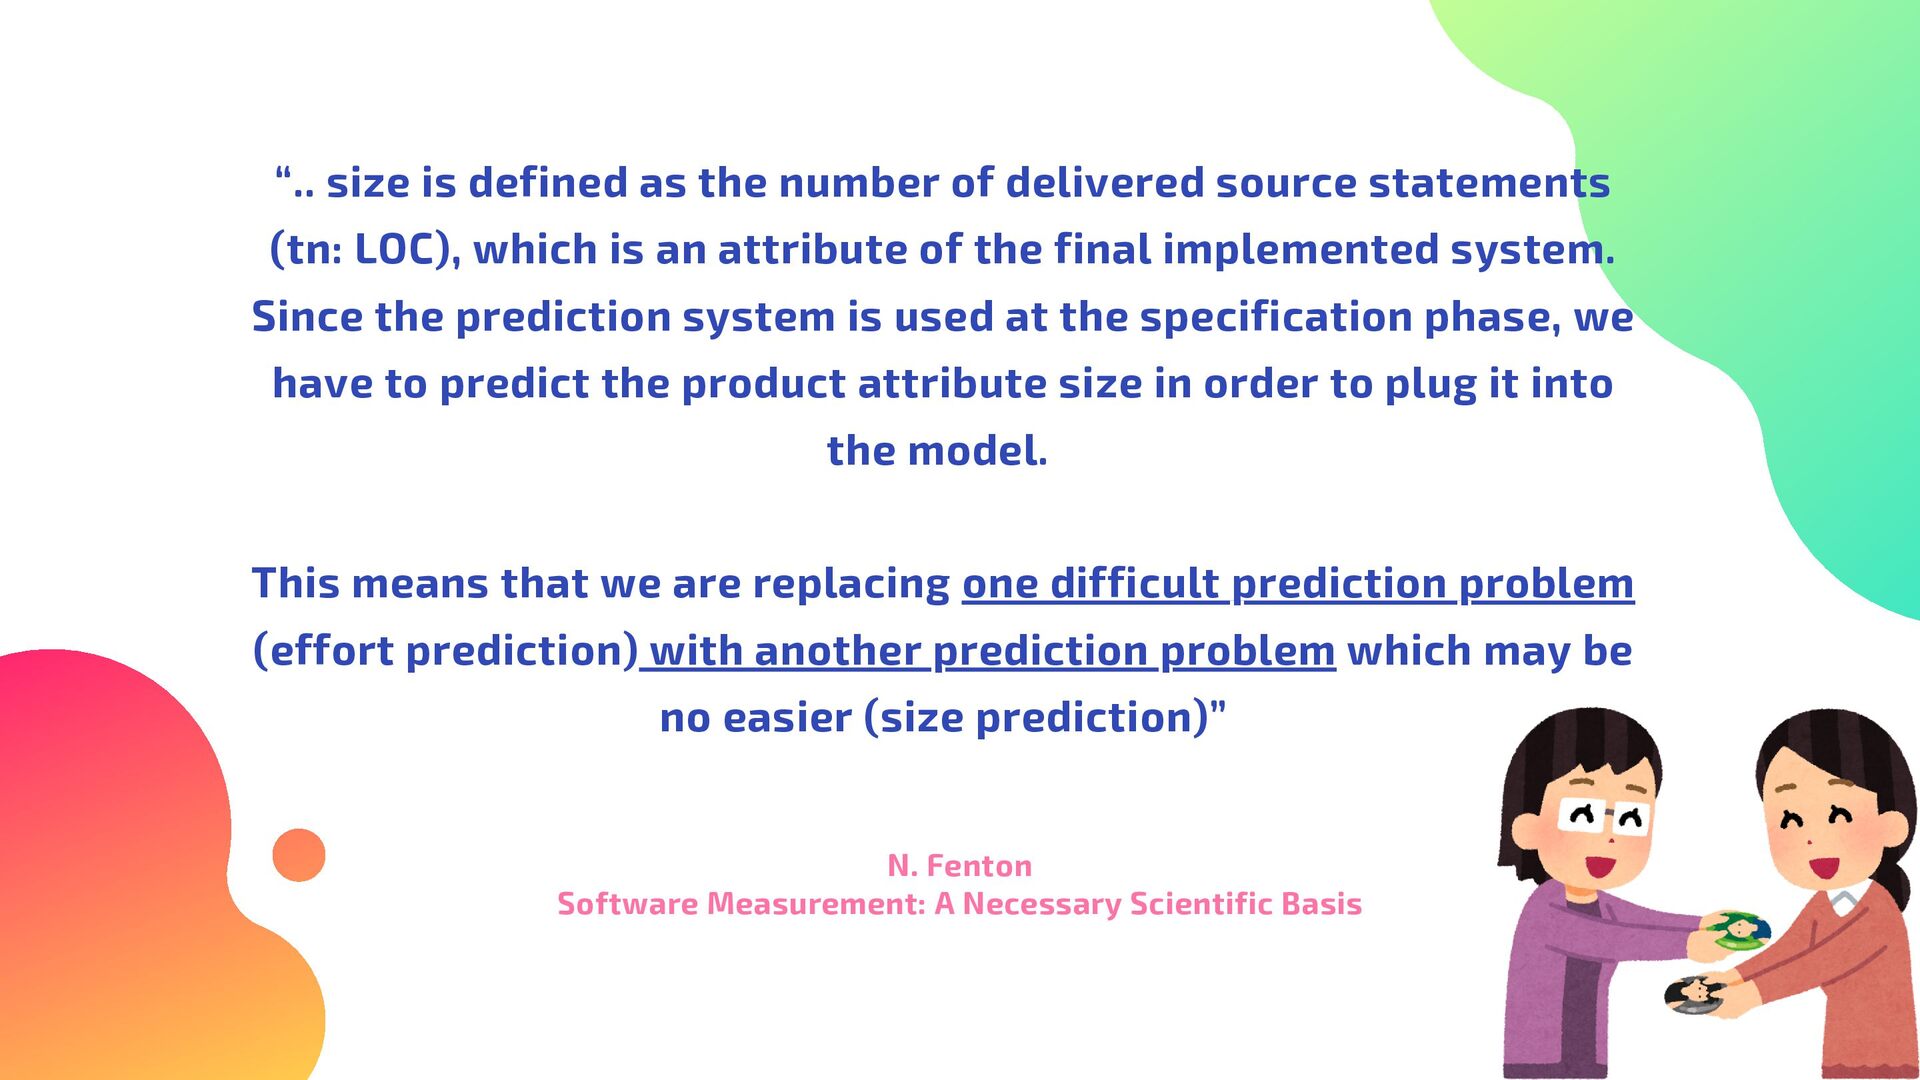
statements (tn: LOC), which is an attribute of the final implemented system. Since the prediction system is used at the specification phase, we have to predict the product attribute size in order to plug it into the model. This means that we are replacing one difficult prediction problem (effort prediction) with another prediction problem which may be no easier (size prediction)” N. Fenton Software Measurement: A Necessary Scientific Basis
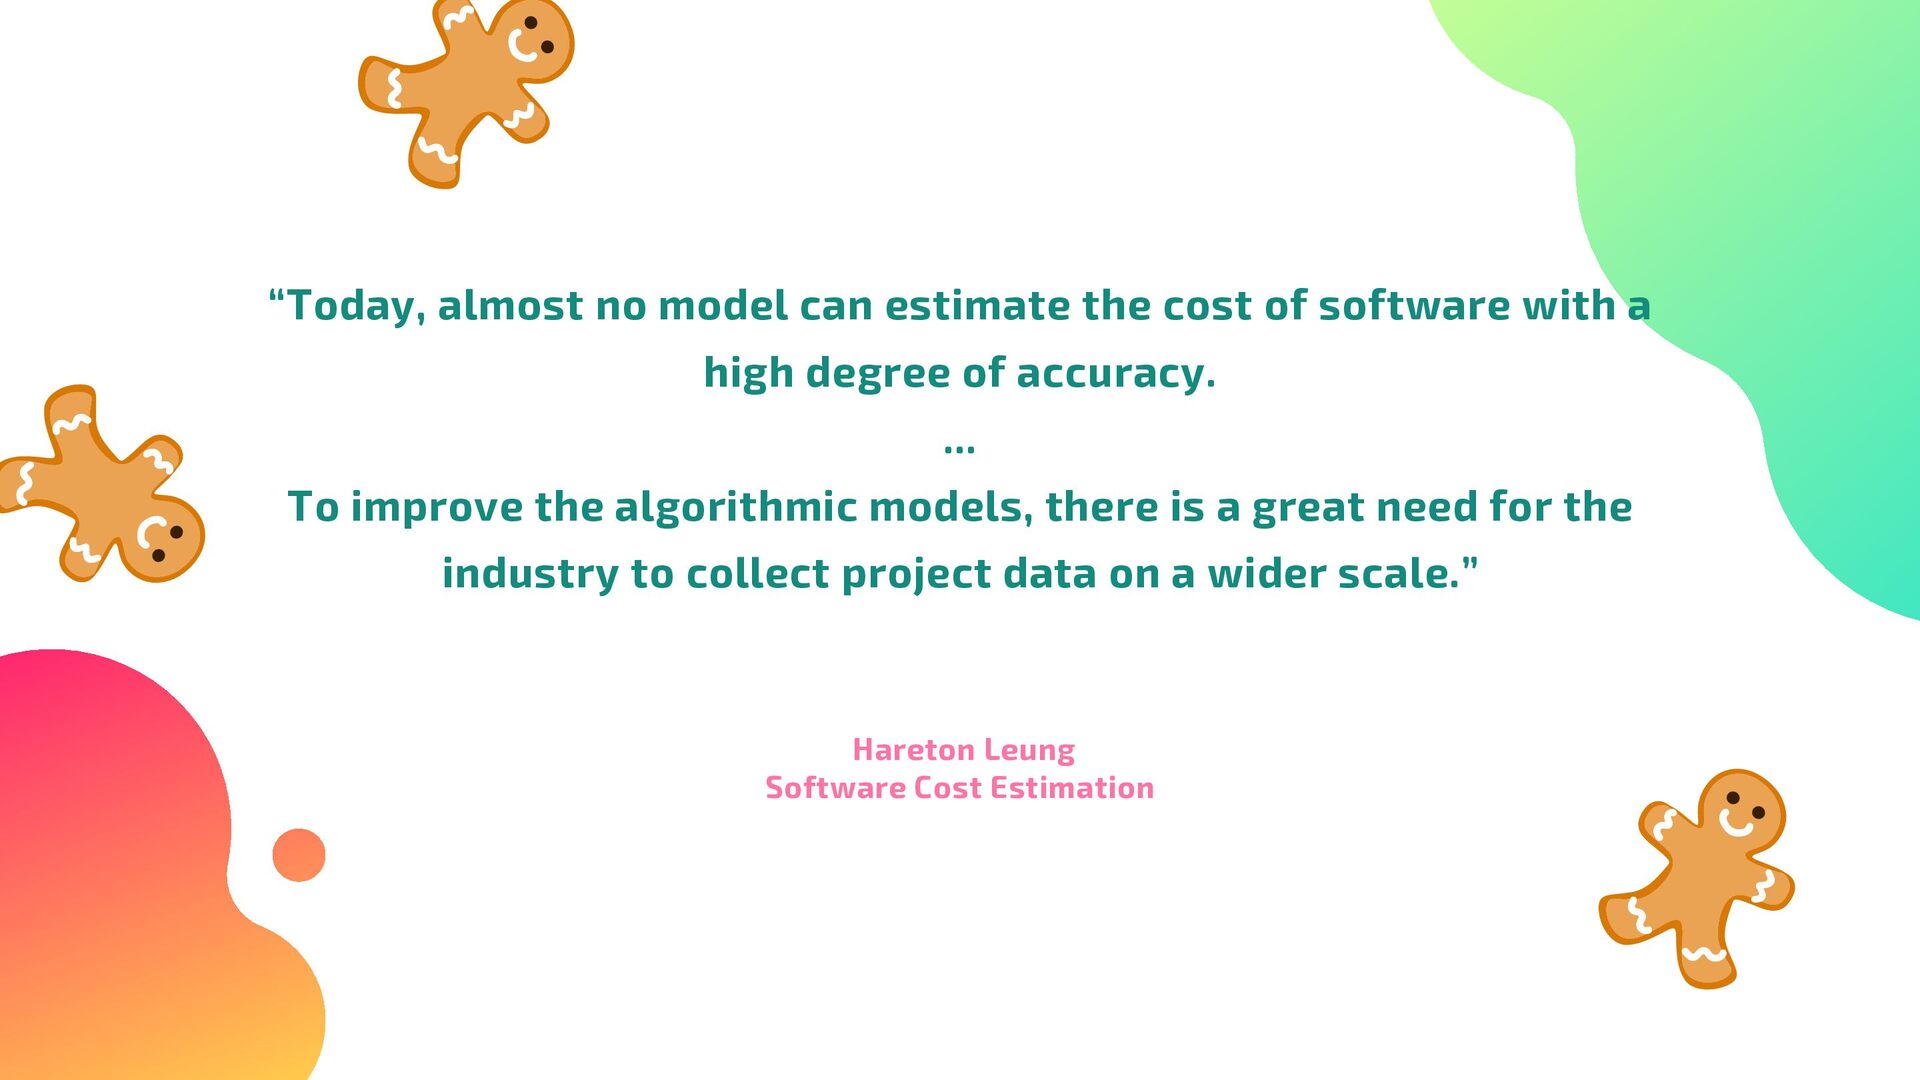
with a high degree of accuracy. ... To improve the algorithmic models, there is a great need for the industry to collect project data on a wider scale.” Hareton Leung Software Cost Estimation
or evaluated in real-life situations is low. We could not, for example, find a single study on how software companies actually use formal estimation models. Our knowledge of the performance of formal estimation models is, therefore, limited to laboratory settings” M.Jørgensen and M.J.Shepperd A Systematic Review of Software Development Cost Estimation Studies
complexity of the project the resources provided to the project the resources provided to the project Searching: a human or AI oracle Searching: a human or AI oracle
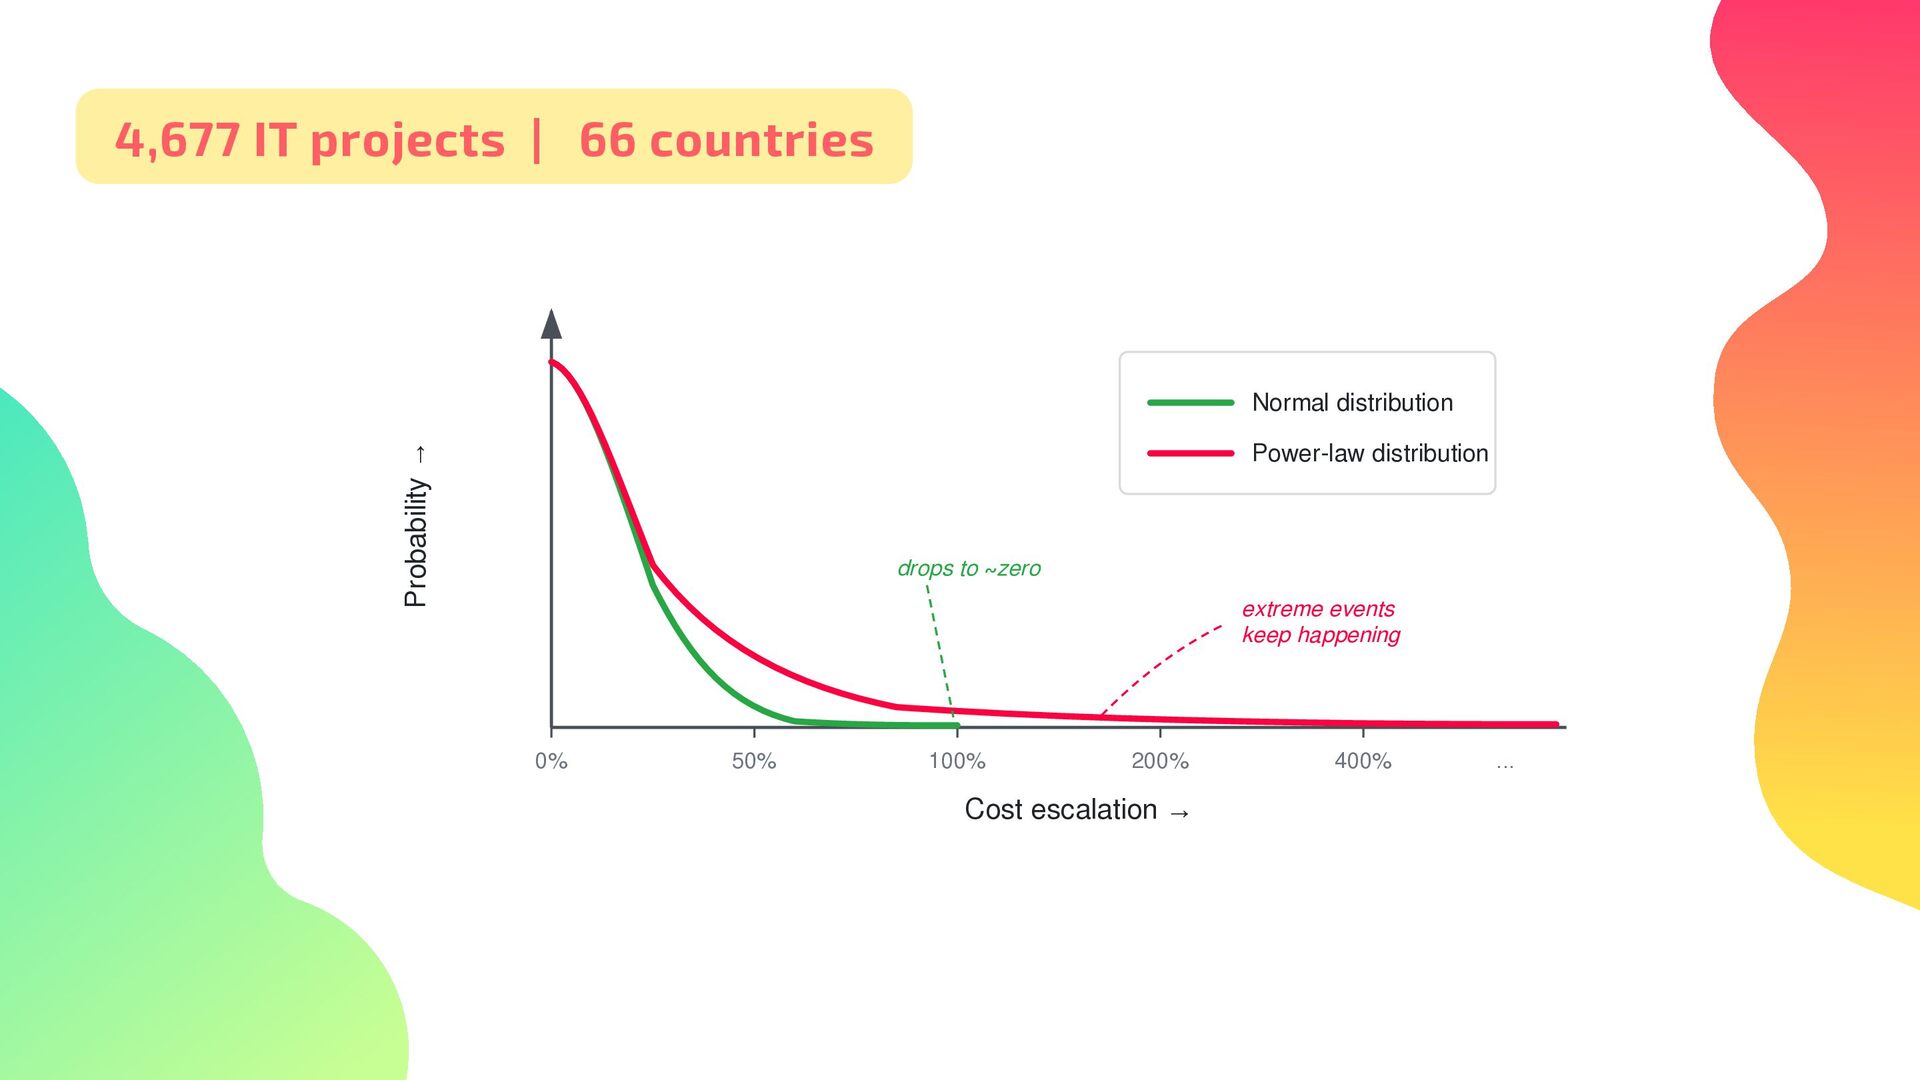
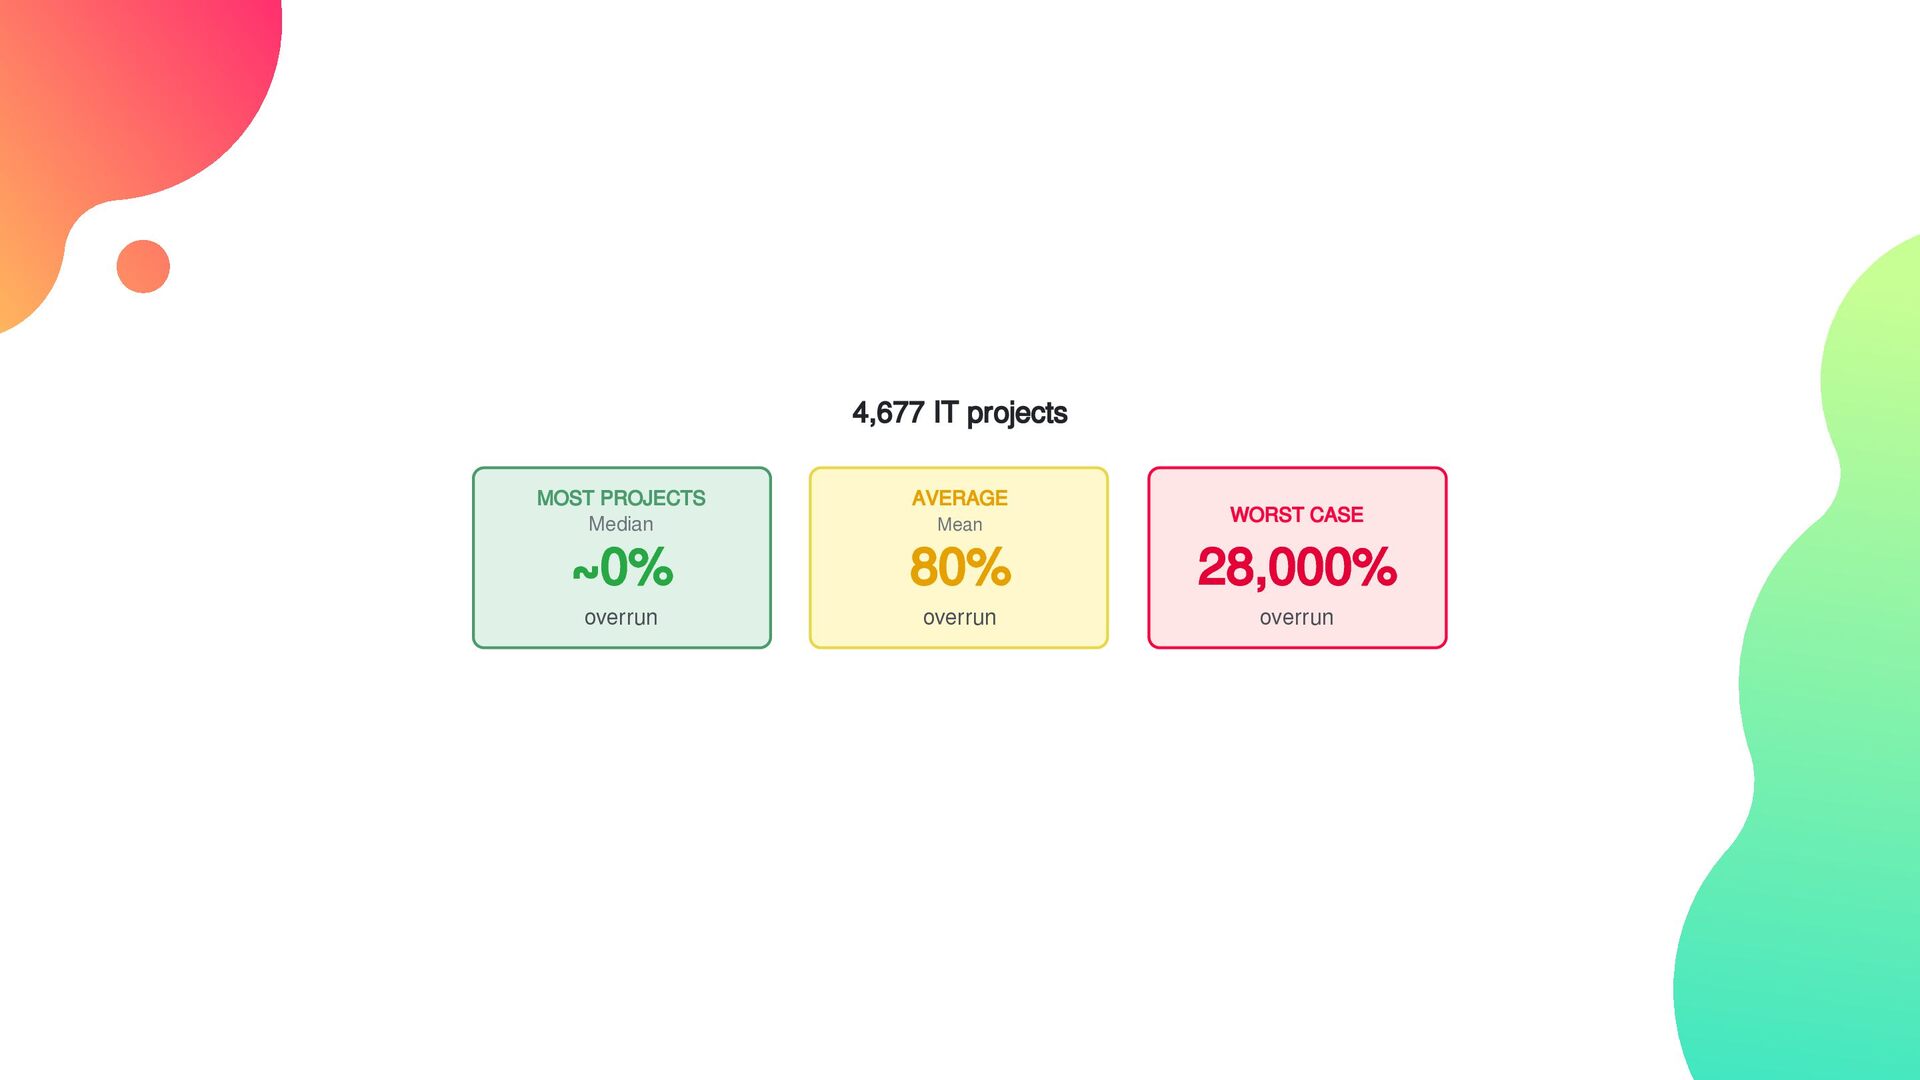
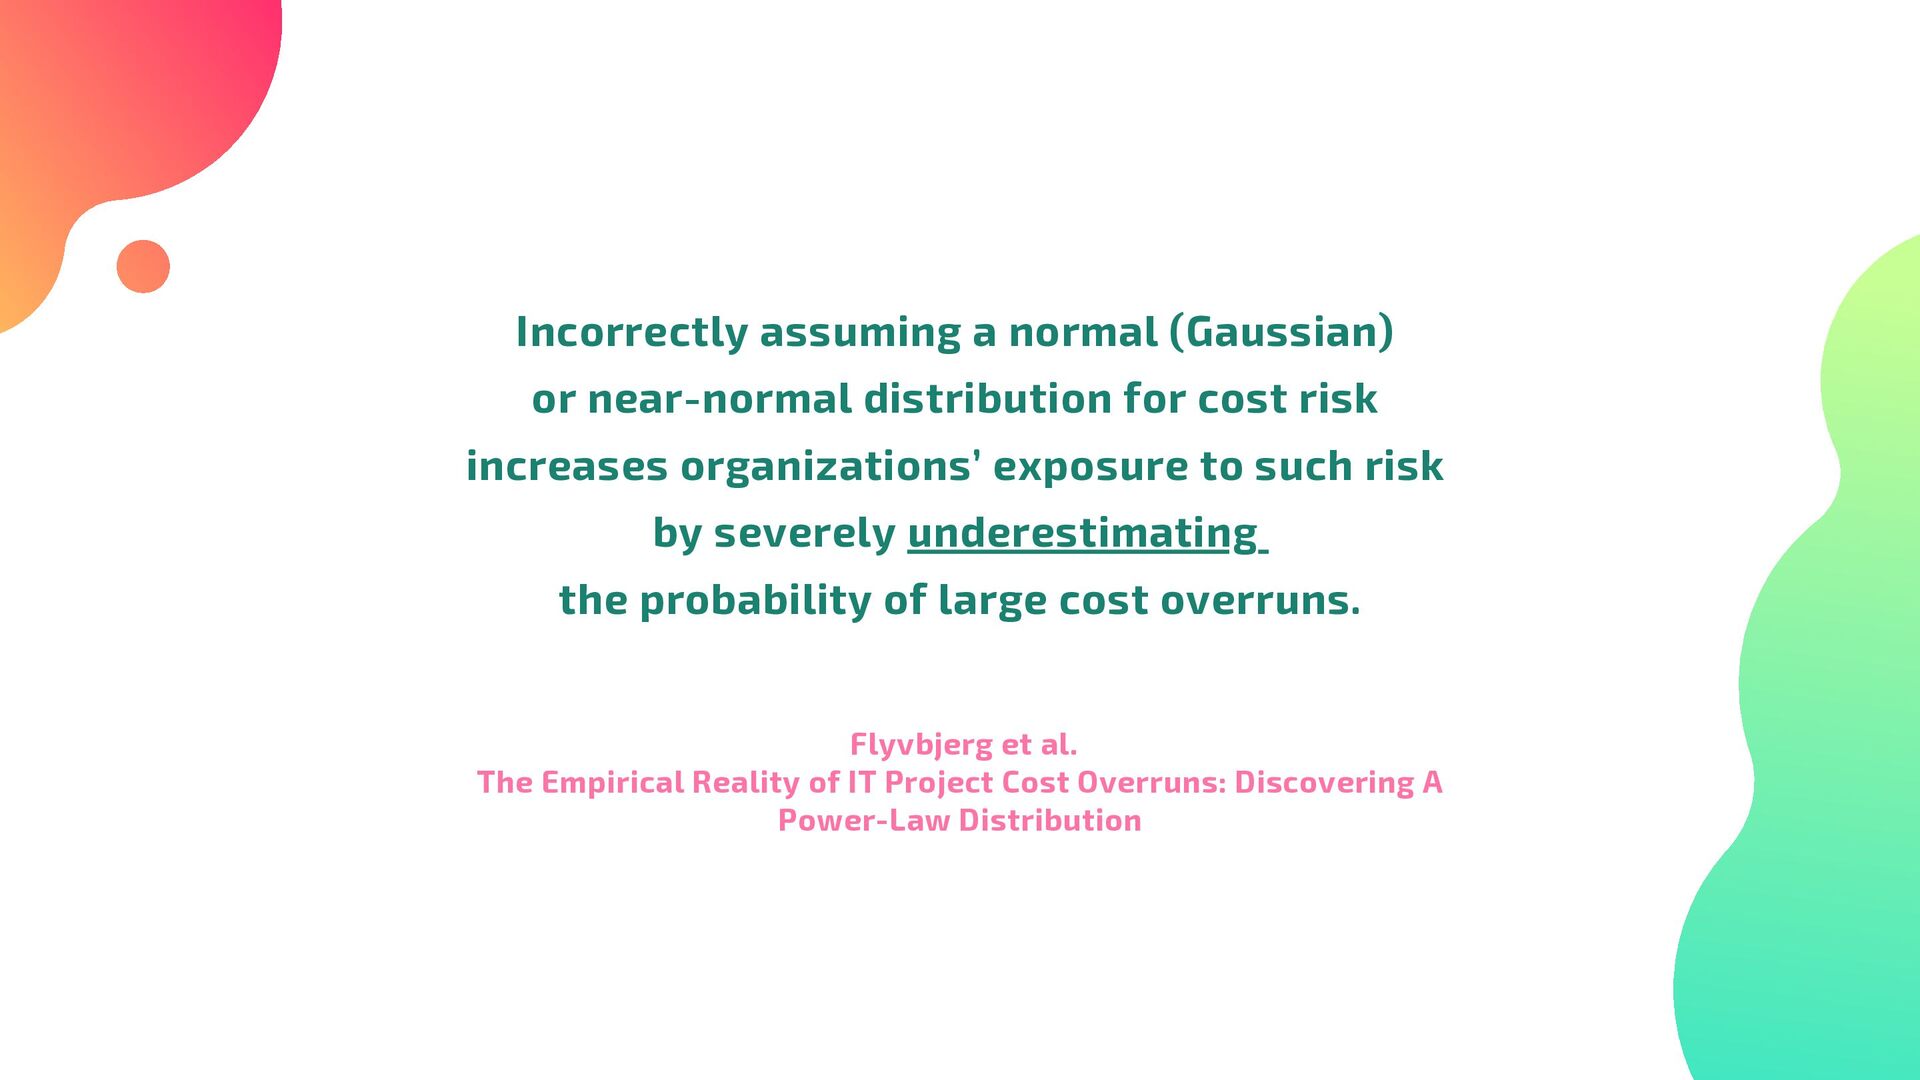
risk increases organizations’ exposure to such risk by severely underestimating the probability of large cost overruns. Flyvbjerg et al. The Empirical Reality of IT Project Cost Overruns: Discovering A Power-Law Distribution
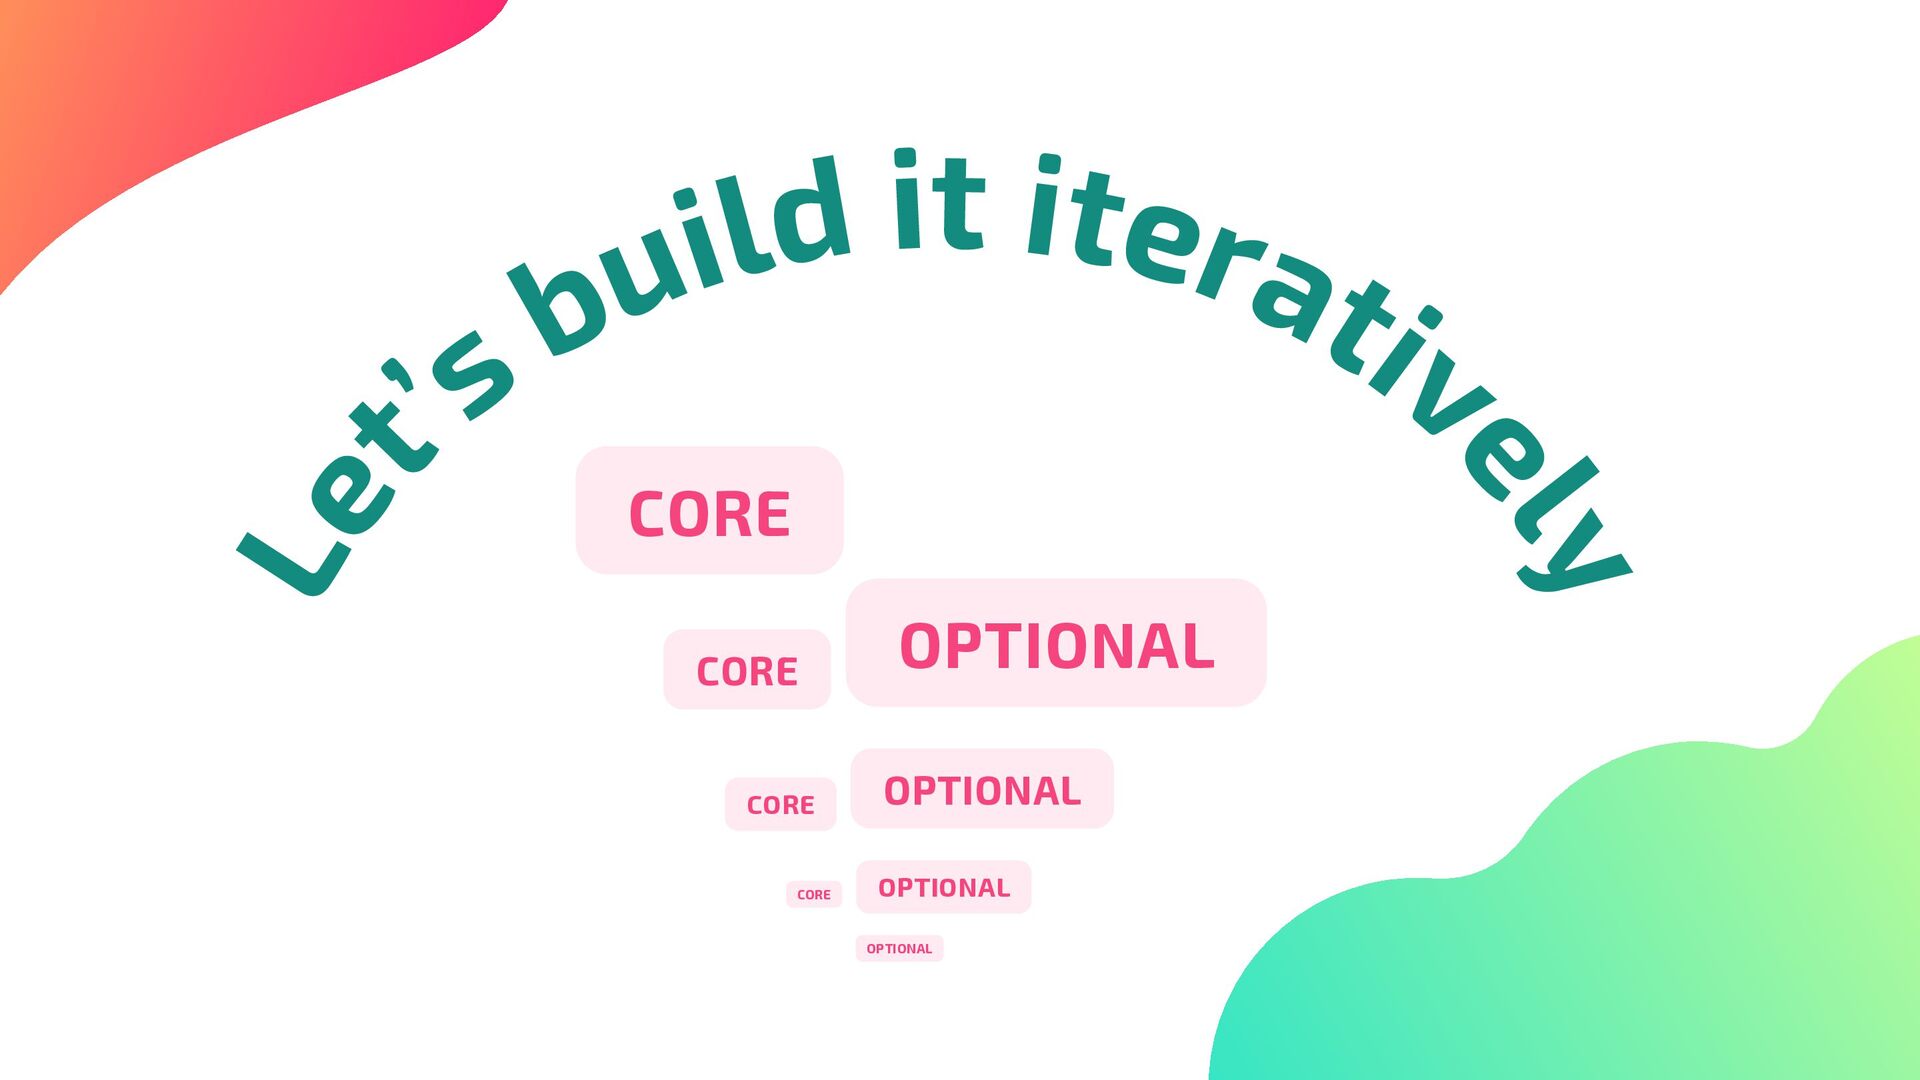
we stop estimating tasks left and right estimating tasks left and right and instead start managing the and instead start managing the project’s risk and customer’s project’s risk and customer’s expectations. expectations.