Upgrade to Pro — share decks privately, control downloads, hide ads and more …

Monitoring Flask application performance in Pro...

Sponsored · SiteGround - Reliable hosting with speed, security, and support you can count on.

Monitoring Flask application performance in Production: Best Practices with Open-Source Tools

Avatar for Mark Irozuru

Mark Irozuru

November 08, 2025
Tweet

More Decks by Mark Irozuru

Other Decks in Technology

Transcript

  1. Monitoring Flask application performance in Production Best Practices with Open-Source

    Tools Prometheus • Grafana • Loki • AlertManager • Grafana Alloy Simple Demo Stack github.com/birozuru/flaskcon-demo
  2. The Observability Challenge "Your Flask application works fine on your

    local machine... then you deploy to production" Traffic spikes you didn't anticipate Endpoints that were fast are now slow Random errors at 3 AM (We all have been there) No visibility into what's happening You need insight into your application's performance and behavior
  3. Project Structure A complete, production-ready monitoring stack: Project Structure: flask-observability-demo/

    ├── app.py # Instrumented Flask demo application ├── docker-compose.yml # Production-ready stack ├── Makefile # Convenience commands for testing and demoing ├── prometheus/ │ ├── prometheus.yml # Prometheus configuration │ └── alerts.yml # Alerting rules ├── grafana/ │ ├── provisioning/ # Datasources and dashboard config │ └── dashboards/ # Pre-built dashboards ├── loki/ │ └── loki-config.yml # Loki configuration for log aggregation ├── alertmanager/ │ └── alertmanager.yml # Alert routing configuration for alerting └── grafana-alloy/ └── config.alloy # Alloy configuration for unified observability
  4. Production Stack Architecture ┌────────────────────────────────────────┐ │ Flask App :5000 │ │

    ┌──────────────────────────────┐ │ │ │ PrometheusMetrics(app) │ │ │ │ /metrics endpoint │ │ │ └──────────────────────────────┘ │ │ ┌──────────────────────────────┐ │ │ │ Structured JSON Logs │ │ │ │ stdout/files │ │ │ └──────────────────────────────┘ │ └─┬────────────────────────────────────┬─┘ │ metrics scrape │ logs │ every 15s │ ▼ ▼ ┌─────────────────────────────────────┐ ┌─────────────────────────┐ │ Grafana Alloy :12345 │ │ Grafana Alloy │ │ • Collects node metrics │ │ • Tails application │ │ • Remote writes to Prometheus │ │ • Parses JSON logs │ │ │ │ • Pushes to Loki │ └─────┬───────────────────────────────┘ └─────────┬───────────────┘ │ │ | remote_write │ push ▼ ▼ ┌─────────────────────────────────────┐ ┌─────────────────────────┐ │ Prometheus :9090 │ │ Loki :3100 │ │ • Time-series database │ │ • Log aggregation │ │ • PromQL queries │ │ • LogQL queries │ │ • Alert evaluation │ │ • Label-based storage │ └─────┬───────────────────────────────┘ └─────────┬───────────────┘ │ │ ├──queries & alerts──────────────────────┐ │ │ ┌─────────────────┐ │ │ ├──queries────>│ Grafana :3000 │<──────┘ │ │ │ • Dashboards │ │ │ │ • Logs + Metrics│ │ │ └─────────────────┘ │ │ │ ├──alerts─────>┌─────────────────┐ │ │ AlertManager │ │ │ :9093 │ │ └─────────────────┘ │
  5. Performance Metrics 1. Request Performance flask_http_request_duration_seconds - Response time histogram

    flask_http_request_total - Request counter by endpoint/status 2. Business Metrics orders_total{'{'}status="success|failed"{'}'} - Order tracking order_value_dollars - Transaction value distribution active_users - Current active users 3. Database Performance database_query_duration_seconds{'{'}query_type{'}'} - Query latency
  6. Instrumenting the Application from prometheus_flask_exporter import PrometheusMetrics from prometheus_client import

    Counter, Histogram, Gauge app = Flask(__name__) # Automatic instrumentation metrics = PrometheusMetrics(app) metrics.info('flask_app_info', 'Flask Application Info', version='1.0.0') # Custom business metrics order_counter = Counter( 'orders_total', 'Total number of orders', ['status'] # success|failed ) order_value = Histogram( 'order_value_dollars', 'Order value in dollars' ) active_users = Gauge('active_users', 'Active users')
  7. Tracking Business Metrics @app.route('/api/orders', methods=['POST']) def create_order(): """Simulate order creation

    with metrics""" order_data = request.get_json() query_start = time.time() time.sleep(random.uniform(0.01, 0.1)) database_query_duration.labels(query_type='insert')\ .observe(time.time() - query_start) success = random.random() > 0.1 # 90% success rate if success: order_counter.labels(status='success').inc() order_value.observe(order_data.get('amount', 0)) logger.info("Order created successfully", extra={ 'order_id': random.randint(1000, 9999), 'amount': order_data.get('amount', 0) }) return jsonify({'status': 'success'}), 201 else: order counter labels(status='failed') inc()
  8. Prometheus Configuration prometheus/prometheus.yml --- global: scrape_interval: 15s evaluation_interval: 15s external_labels:

    cluster: 'demo-cluster' environment: 'development' alerting: alertmanagers: - static_configs: - targets: - alertmanager:9093 rule_files: - 'alerts.yml' scrape_configs: - job_name: 'prometheus' static_configs: - targets: ['localhost:9090'] labels:
  9. Production Alert Rules prometheus/alerts.yml - alert: HighErrorRate expr: | (

    sum(rate(flask_http_request_total{status=~"5.."}[5m])) / sum(rate(flask_http_request_total[5m])) ) > 0.05 for: 2m labels: severity: warning team: platform annotations: summary: "High error rate detected in Flask app" description: "Error rate is {{ $value | humanizePercentage }}" - alert: HighLatency expr: | histogram_quantile(0.95, sum(rate(flask_http_request_duration_seconds_bucket[5m])) by (le) ) > 1.0 for: 3m
  10. Critical Production Alerts Critical ApplicationDown App unreachable for 1m LowOrderSuccessRate

    <80% success for 5m DatabaseDown Connection pool exhausted Warning HighErrorRate >5% errors for 2m HighLatency p95 > 1s for 3m HighRequestRate >100 req/s for 2m
  11. Demo Scenarios Makefile # Test normal load make test-traffic #

    Generate normal traffic # Test business logic make test-orders # Create sample orders with metrics # Trigger error alerts make test-errors # Trigger high error rates (fires alerts) # Test performance degradation make test-slow # Hit slow endpoints # Heavy load test make test-load # Heavy load testing
  12. Performance Baseline make test-traffic Watch Grafana Dashboard: Request Rate: ~10

    req/s p95 Latency: 100-200ms Error Rate: 0% Active Users: Updates in real-time This establishes the performance baseline
  13. Alert Triggering make test-errors Alert Lifecycle: 1. Minute 0: GREEN

    (Inactive) - All good 2. Minute 1: YELLOW (Pending) - Error rate high 3. Minute 2: RED (Firing) - Alert sent! Check AlertManager: http://localhost:9093 The 'for: 2m' prevents alert noise
  14. Prometheus Queries Request Rate per Endpoint: sum(rate(flask_http_request_total[5m])) by (path) Error

    Rate Percentage: sum(rate(flask_http_request_total{status=~"5.."}[5m])) / sum(rate(flask_http_request_total[5m])) * 100 p95 Latency by Endpoint: histogram_quantile(0.95, sum(rate(flask_http_request_duration_seconds_bucket[5m])) by (path, le) )
  15. Performance Analysis Slowest Endpoints (Top 5): topk(5, histogram_quantile(0.95, sum(rate(flask_http_request_duration_seconds_bucket[5m])) by

    (path, le) ) ) Order Success Rate: sum(rate(orders_total{status="success"}[5m])) / sum(rate(orders_total[5m])) * 100 Database Query Performance: histogram_quantile(0.95, rate(database_query_duration_seconds_bucket[5m]) ) by (query_type)
  16. Grafana Dashboard Dashboard Panels: Request Rate - Total, 2xx, 5xx

    over time Response Time - p50, p95, p99 percentiles Error Rate % - 4xx and 5xx trends Active Users - Real-time gauge Order Success Rate - Business KPI Database Performance - Query duration by type Endpoint Breakdown - Table of all endpoints
  17. Structured Logging with Loki Structured logging logger.info("Order created successfully", extra={

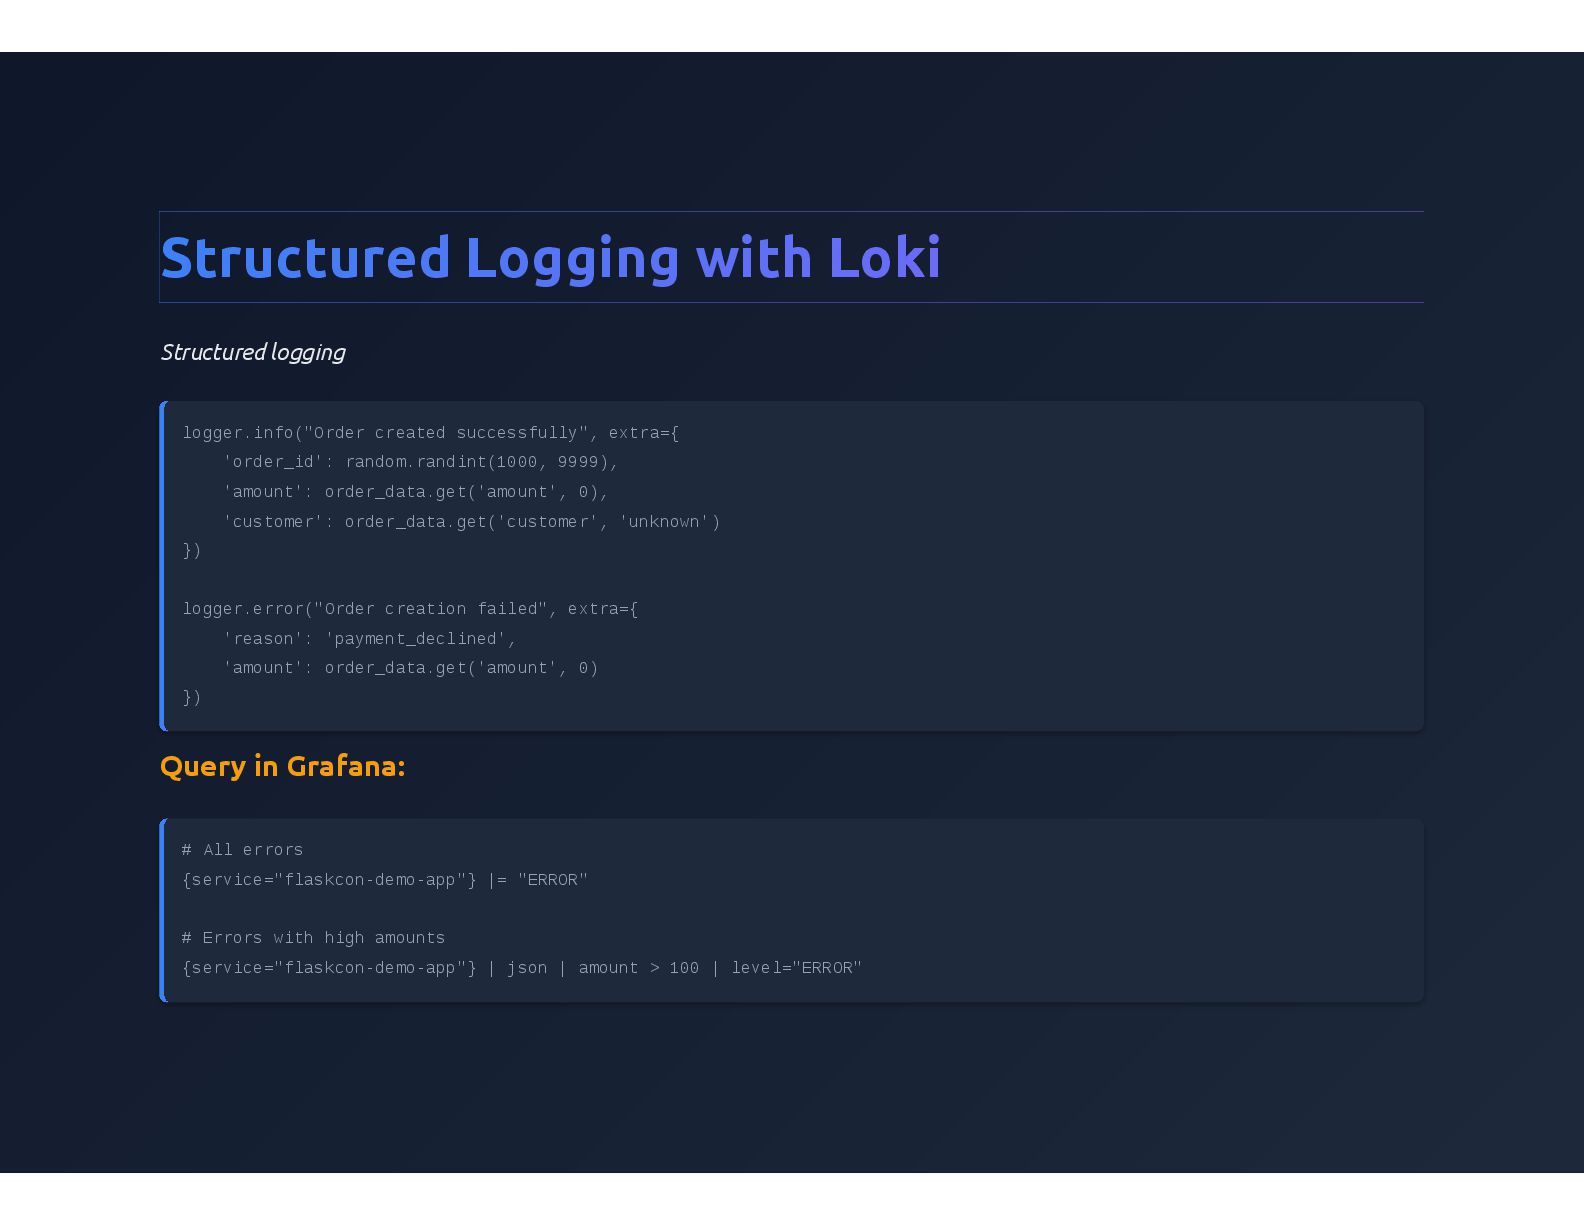
    'order_id': random.randint(1000, 9999), 'amount': order_data.get('amount', 0), 'customer': order_data.get('customer', 'unknown') }) logger.error("Order creation failed", extra={ 'reason': 'payment_declined', 'amount': order_data.get('amount', 0) }) Query in Grafana: # All errors {service="flaskcon-demo-app"} |= "ERROR" # Errors with high amounts {service="flaskcon-demo-app"} | json | amount > 100 | level="ERROR"
  18. Grafana Alloy - Metrics Metrics Collection & Remote Write: prometheus.scrape

    "testnet" { targets = [ {"__address__" = "flask-app:5002", "service" = "flaskcon-demo-app", "team" = "infra"}, ] job_name = "flaskcon-demo-app" scrape_interval = "15s" scrape_timeout = "10s" forward_to = [prometheus.remote_write.default.receiver] } prometheus.remote_write "default" { endpoint { url = "http://prometheus:9090/api/v1/write" } external_labels = { env = "development", app = "flaskcon-demo-app", }
  19. Alloy Log Collection loki.source.docker "default" { host = "unix:///var/run/docker.sock" targets

    = discovery.relabel.docker.output labels = { env = "development", app = "flaskcon-demo-app", } forward_to = [loki.write.default.receiver] } loki.write "default" { endpoint { url = "http://loki:3100/loki/api/v1/push" tenant_id = "flaskcon" } external_labels = { env = "development", app = "flaskcon-demo-app", } }
  20. Percentiles Over Averages Why averages lie: When monitoring performance metrics

    like latency, percentiles provide a more accurate view than averages. Example: 100 requests with 99 at 10ms and 1 at 10,000ms: Average: 109ms (looks good!) p99: 10,000ms (1% of users wait 10 seconds) The average hides a critical issue affecting user experience.
  21. Low Cardinality Labels High Cardinality ❌ Counter('requests', ['user_id', # 1M

    users 'request_id', # infinite 'ip_address'] # 100k IPs ) # = billions of time series # = Prometheus explosion Low Cardinality ✓ Counter('requests', ['endpoint', # ~20 'method', # 5 'status'] # 10 ) # = ~1000 time series # = Manageable Rule: If it's unbounded, DON'T use as label
  22. Alert Design Every alert must answer: 1. What's broken? -

    Clear summary 2. Why does it matter? - User impact 3. How to investigate? - Log queries, metrics 4. How to fix? - Runbook link Sample alert template: annotations: summary: "{{ $labels.path }} error rate {{ $value }}%" description: | Check logs: {service="flaskcon-demo-app"} | json | path="{{ $labels.path }}" |= "ERROR" Runbook: https://flaskcon.com/runbooks/high-error
  23. Scaling to Production Traffic Current demo handles: ~100 req/s 10M

    active time series 15-30 days retention For larger scale, add: Prometheus Federation - Multiple Prometheus per region Thanos/Mimir - Long-term storage (S3/GCS) Prometheus HA - 2+ replicas for reliability AlertManager Clustering - Redundant alert routing Loki Distributor - Horizontal log scaling
  24. Get Started in 5 Minutes git clone https://github.com/birozuru/flaskcon-demo cd flaskcon-demo

    docker-compose up -d make test-traffic open http://localhost:3000 Everything is pre-configured and ready to use
  25. Session Takeaways 1. Start simple - prometheus-flask-exporter gives you 80%

    with one line 2. Use Alloy for unified observability - Single pipeline for metrics and logs 3. Alert intentionally - Every alert must be actionable 4. Track business metrics - Not just infrastructure 5. Structure your logs - JSON makes logs queryable