Upgrade to Pro — share decks privately, control downloads, hide ads and more …

Mapping tick dynamics and tick bite risk using data-driven approaches and volunteered observations

Irene
September 27, 2019

Mapping tick dynamics and tick bite risk using data-driven approaches and volunteered observations

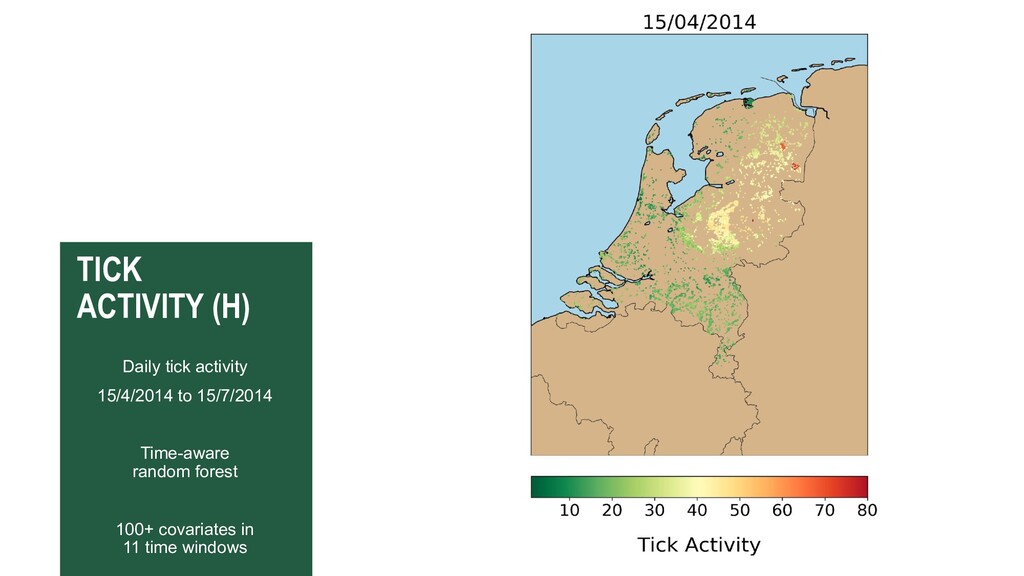
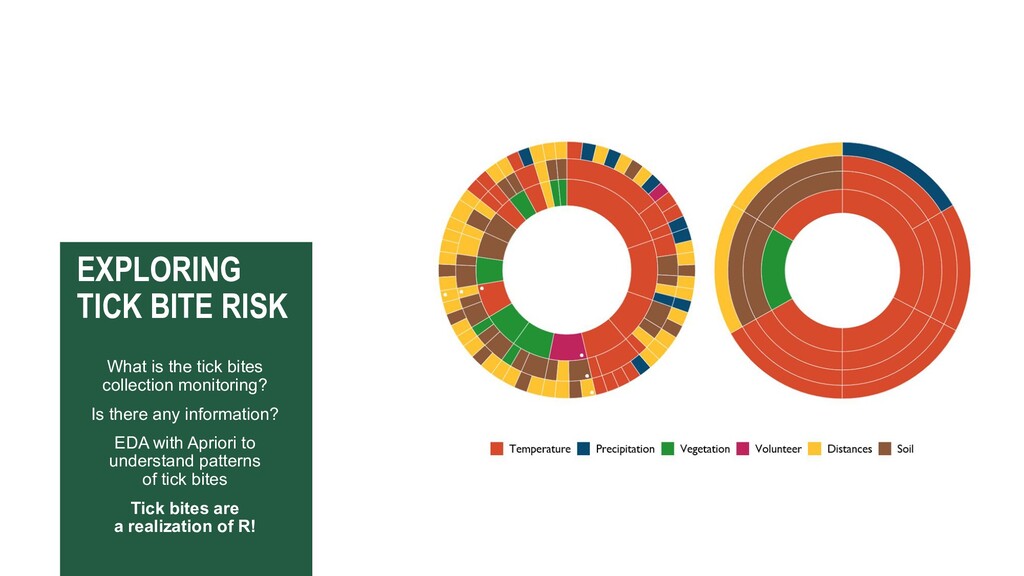
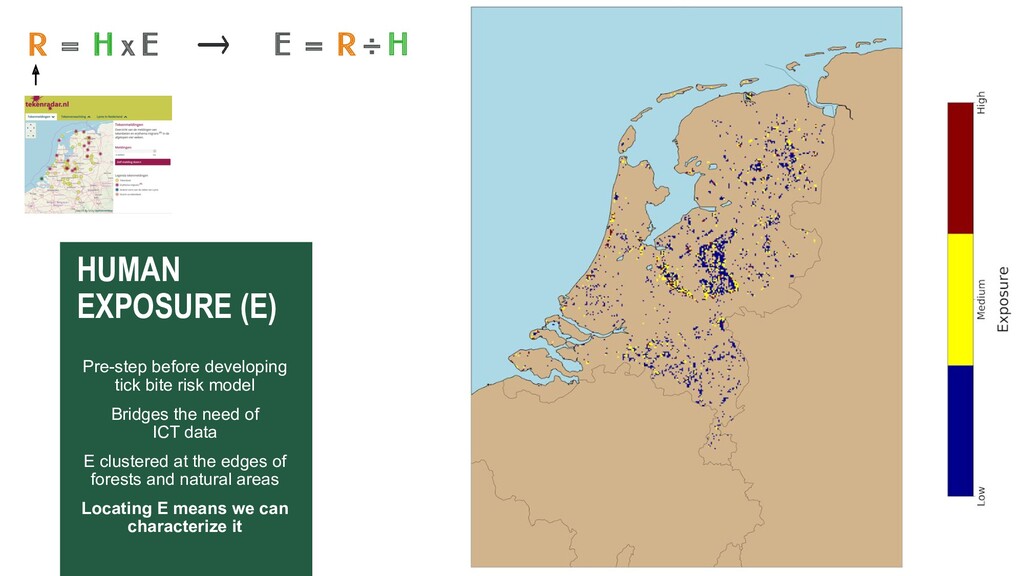
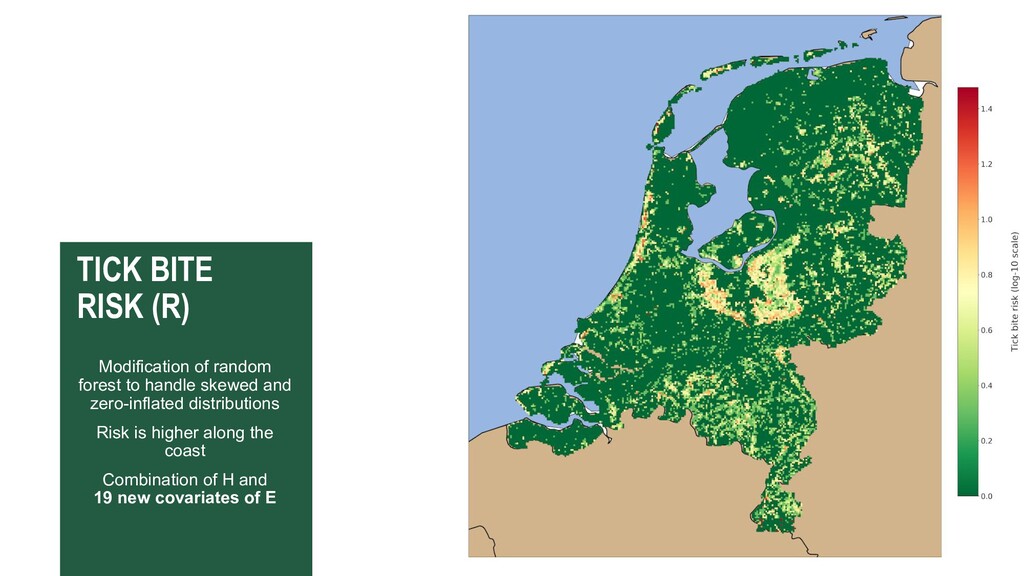
Presentation slides (Layman's talk, 15min) used during my PhD Defence, held on 27th of September 2019 at the University of Twente (the Netherlands). You can find the PhD thesis here: https://library.itc.utwente.nl/papers_2019/phd/garciamarti.pdf and a summary of the research in plain terms here: https://irenegarciamarti.com/post/rs00-explaining-my-phd-research/. Feel free to contact me at research [at] irenegarciamarti [dot] com if you have any questions.

Irene

September 27, 2019
Tweet

More Decks by Irene

Other Decks in Research

Transcript

  1. 1
    Mapping tick dynamics
    and tick bite risk using
    data-driven approaches
    and volunteered observations
    Irene Garcia-Marti
    27-09-2019

    View Slide

  2. CONTEXT
    • Re-emergence of vector-borne diseases:
    • Global & socio-economic changes
    • VDB: 23 diseases (including Zika)
    • Changes + ticks
    • Longer tick season
    • Increase in tick populations
    • Northward + elevation expansion
    • New suitable habitats
    • Concurrent increase of tick-borne diseases
    Source: WHO

    View Slide

  3. CONTEXT
    Source: RIVM
    Source: RIVM
    25K – 27K LD cases per year
    ~2K develop persisting symptoms

    View Slide

  4. CITIZEN SCIENCE
    TICK ACTIVITY
    • Monitoring tick activity
    • Project started and coordinated by
    WUR researchers
    • Monitoring 15-25 forested locations
    in the NL
    • Sampling:
    • Once a month, 2006-2016
    • Using dragging blanket
    • Counting ticks every 25m
    • ~4,000 samples
    • One of the longest time-series on
    tick activity: unique!

    View Slide

  5. CITIZEN SCIENCE
    TICK BITE REPORTS
    WUR + RIVM started Tekenradar in 2012
    Currently 50,000+ samples

    View Slide

  6. THE BIGGER PICTURE
    From “Lyme disease: The ecology of a complex system”
    R.Ostfeld (2012)

    View Slide

  7. R = H x E
    RESEARCH OBJECTIVES
    Modelling tick bite risk and tick activity using citizen science data

    View Slide

  8. DATA AND METHODS
    • General ML operations:
    • Classification
    • Regression
    • Pattern mining
    • ML methods:
    • Random Forest
    • Apriori
    • +
    • Statistics:
    • Poisson, neg. bin.
    • Zero-inflation, skewness

    View Slide

  9. TICK
    ACTIVITY (H)
    Daily tick activity
    15/4/2014 to 15/7/2014
    Time-aware
    random forest
    100+ covariates in
    11 time windows

    View Slide

  10. EXPLORING
    TICK BITE RISK
    What is the tick bites
    collection monitoring?
    Is there any information?
    EDA with Apriori to
    understand patterns
    of tick bites
    Tick bites are
    a realization of R!

    View Slide

  11. HUMAN
    EXPOSURE (E)
    Pre-step before developing
    tick bite risk model
    Bridges the need of
    ICT data
    E clustered at the edges of
    forests and natural areas
    Locating E means we can
    characterize it
    R = H x E E = R ÷ H

    View Slide

  12. 12
    TICK BITE
    RISK (R)
    Modification of random
    forest to handle skewed and
    zero-inflated distributions
    Risk is higher along the
    coast
    Combination of H and
    19 new covariates of E

    View Slide

  13. CONTRIBUTIONS
    • Illustrating intrinsic relationship
    between R, H, E
    • Atmospheric water levels drive tick
    dynamics
    • Tick bite risk is strongly influenced by
    human exposure
    • Principles can be applicable to
    other tick-borne diseases
    Scientific
    • Modify method to handle time-aware
    observations
    • Modify method to handle skewed
    and zero-inflated distributions
    • Devised simple method to estimate
    human exposure to ticks without ICT
    • Guidelines to explore patterns of R
    Methodological
    • Monitoring elusive phenomena at
    unprecedented levels of detail
    • Observations can have sufficient
    quality to support scientific research
    • Sharing creative approaches at
    validating citizen science observations
    Citizen science

    View Slide

  14. FUTURE WORK
    Improving
    prediction of tick
    dynamics
    Creating
    dynamic tick bite
    risk model
    Linking machine
    learning and
    statistics
    Creating apps
    for professionals
    and citizens

    View Slide

  15. View Slide

  16. View Slide