Upgrade to Pro — share decks privately, control downloads, hide ads and more …

Predictive analysis for cache generation in quadtree based geo visualizations

Carla
October 16, 2015

Predictive analysis for cache generation in quadtree based geo visualizations

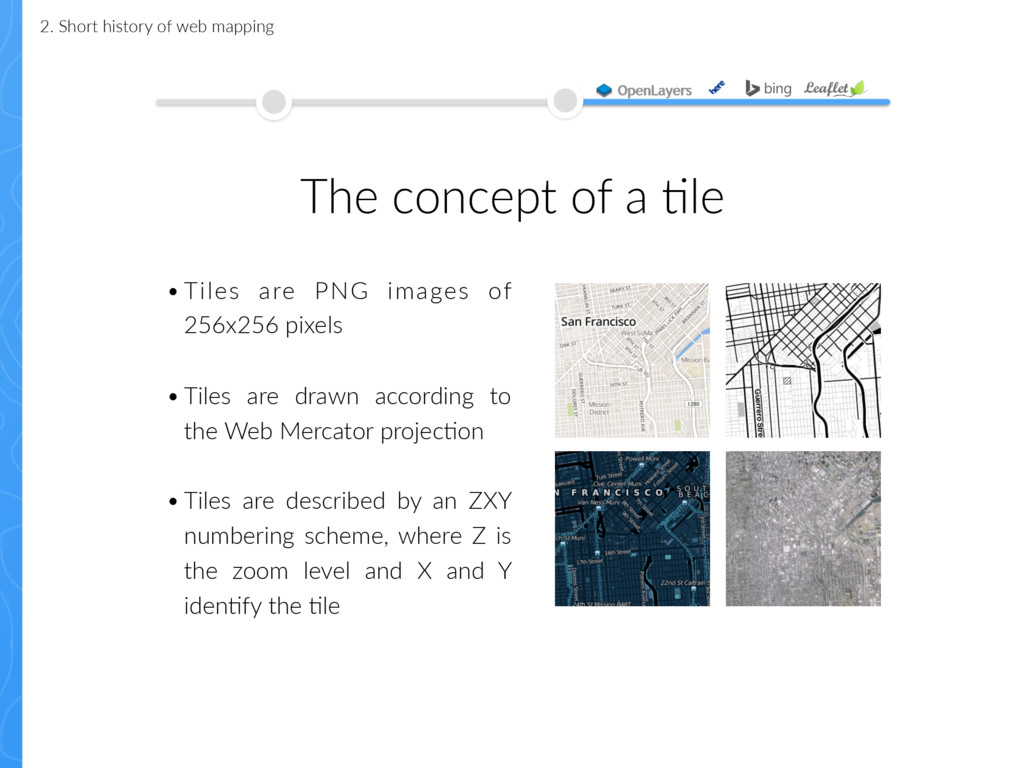
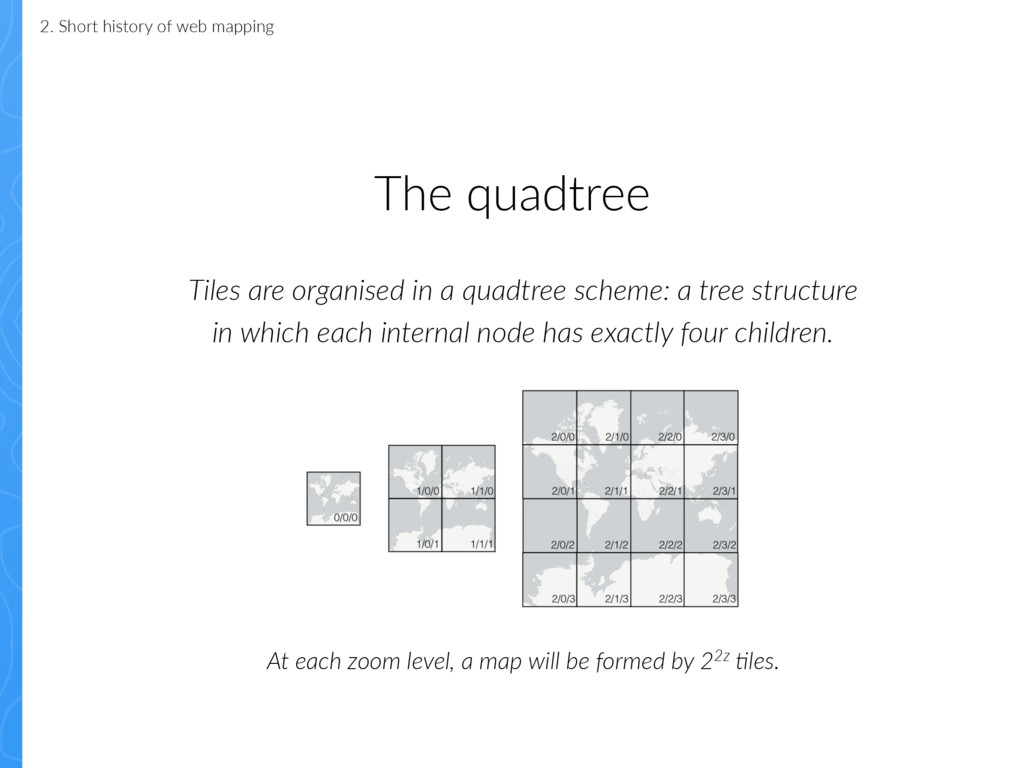
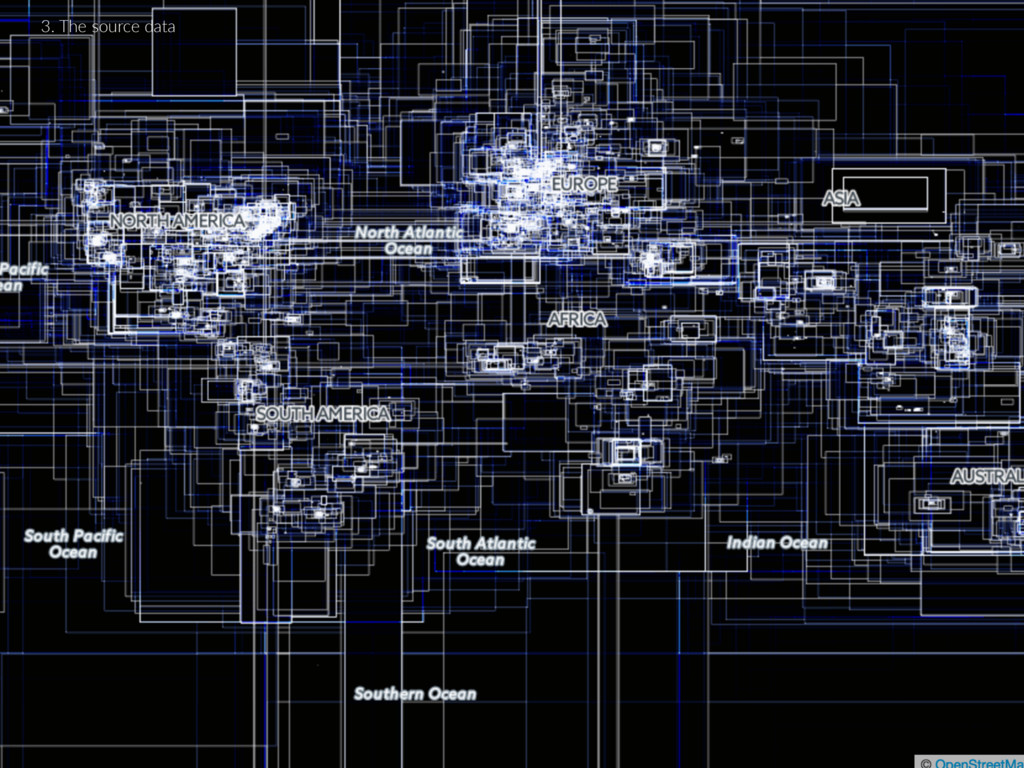
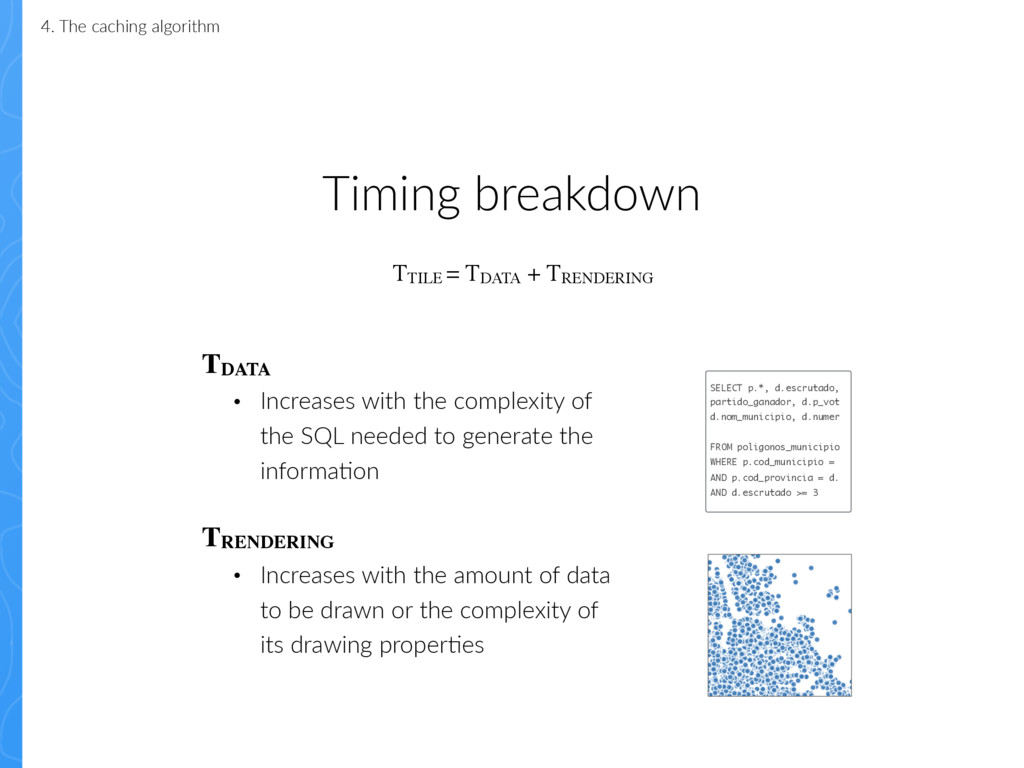
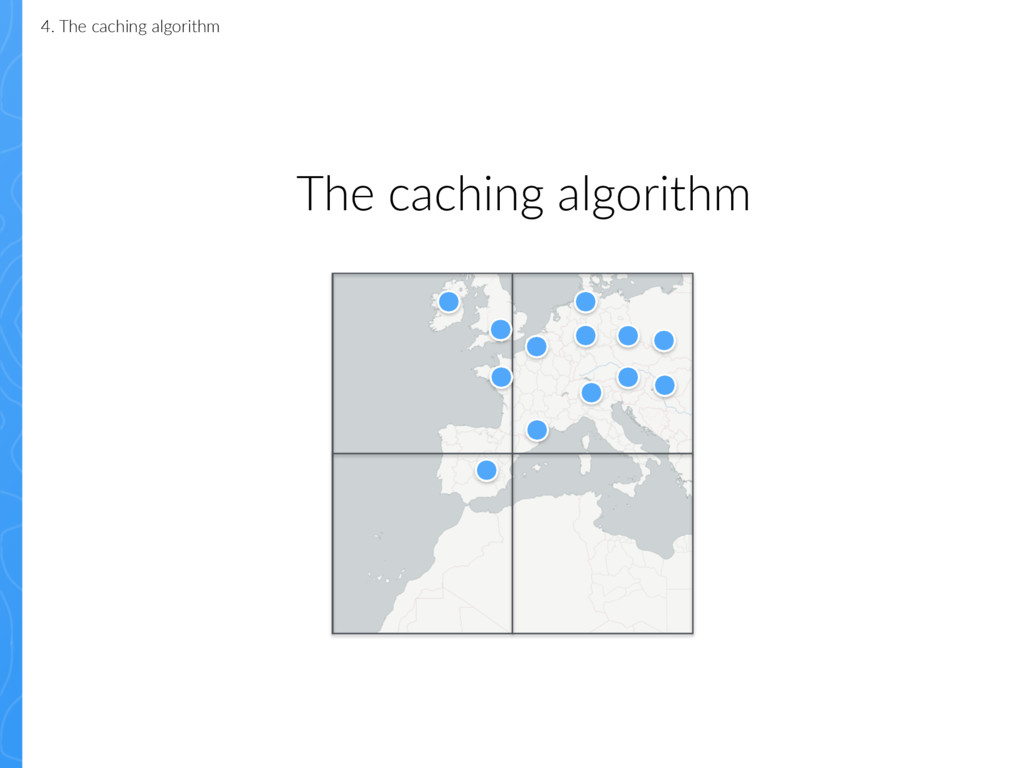
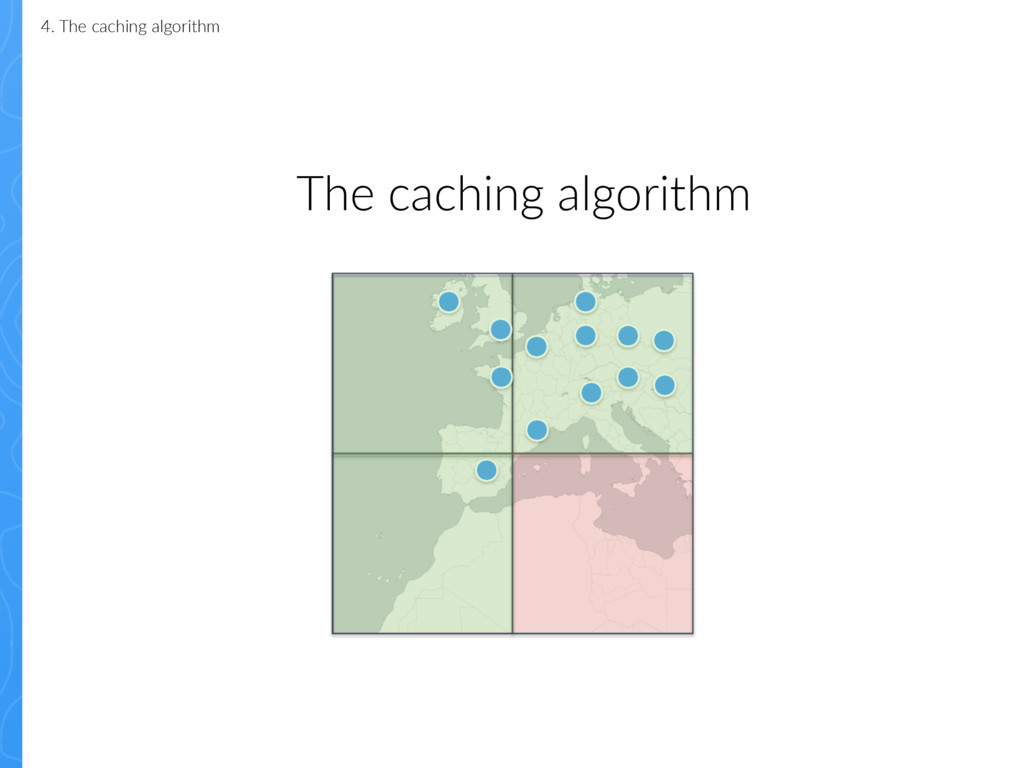
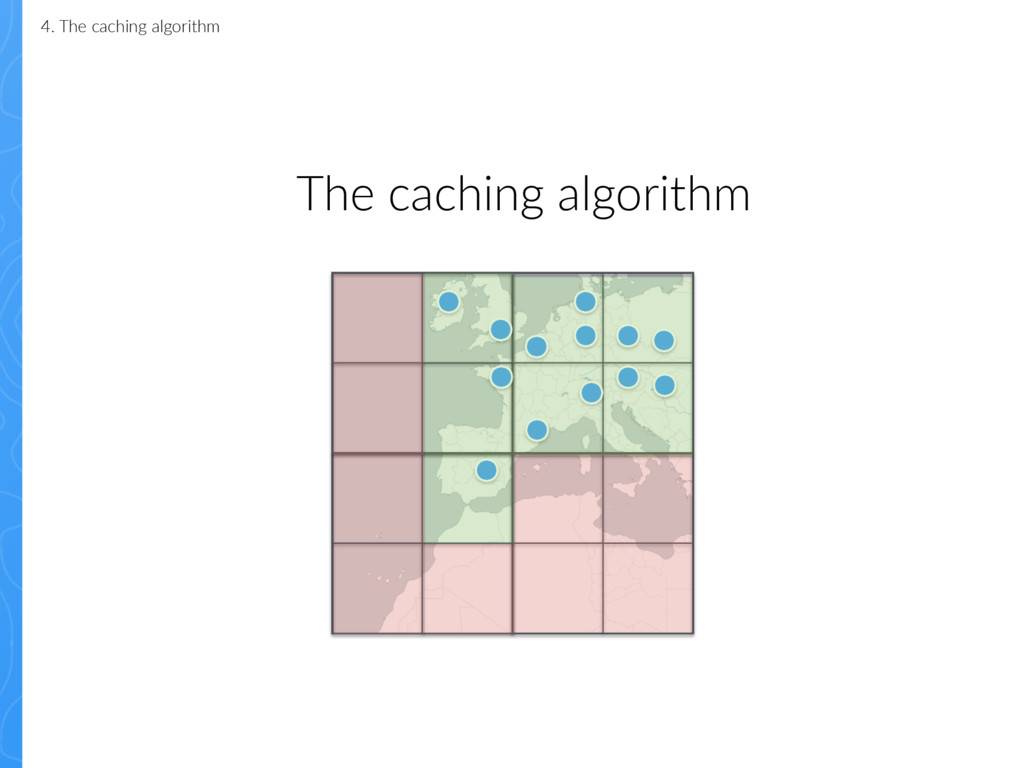
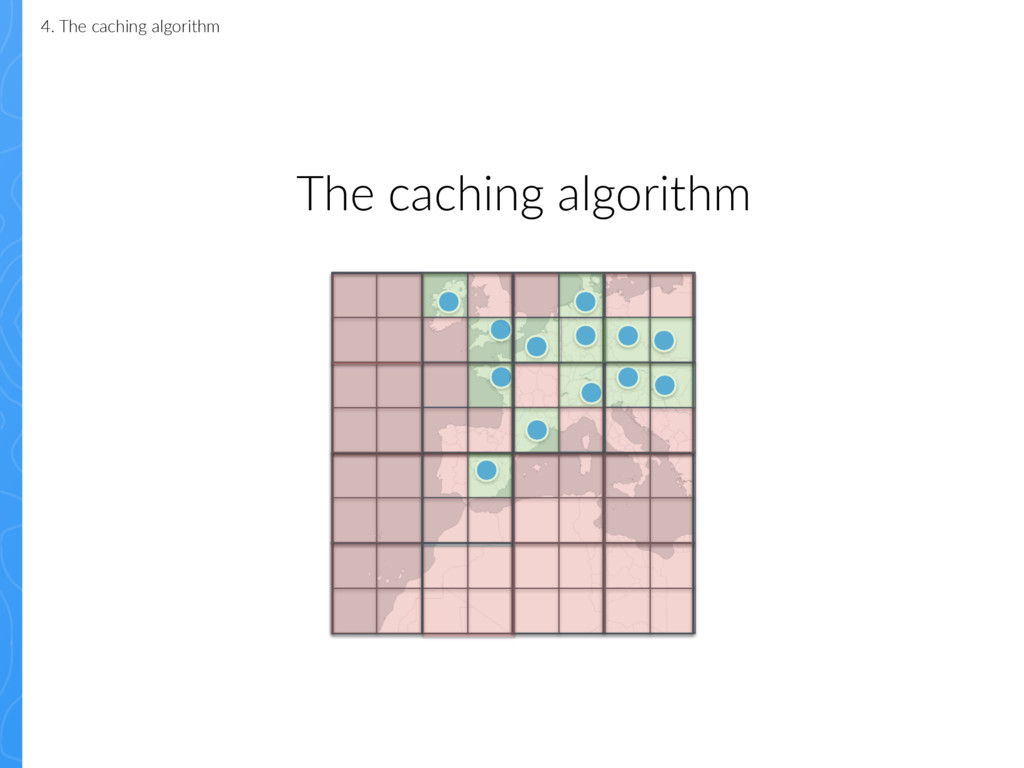
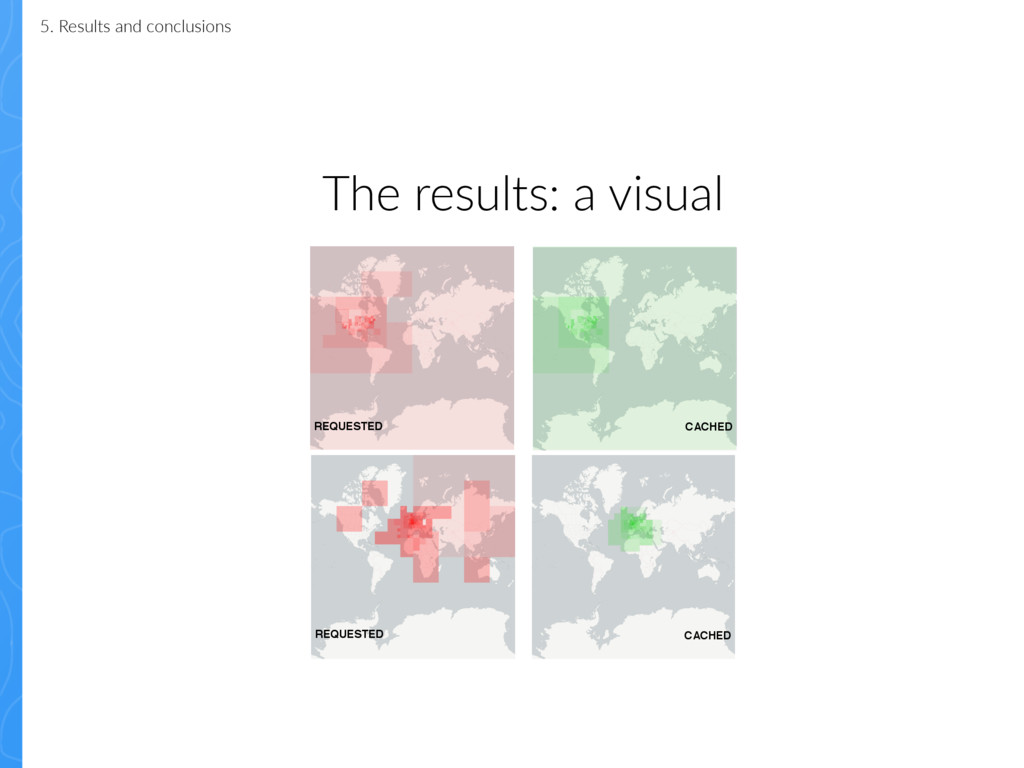
The Web Mercator projection is commonly used in geo data visualizations. This projection shows geospatial information based on some restrictions, but allows to scale the whole world with a precision of centimeters. One of the most important restrictions is the clustering of the information within cells inside map tiles, so that they can be cached. Depending on the data that is being visualized, that cache must behave in a different way to be responsive to user requests.

Carla

October 16, 2015
Tweet

More Decks by Carla

Other Decks in Technology

Transcript

  1. Predic've analysis for cache genera'on in quadtree based 
 geo

    visualiza'ons Carla Iriberri Bachelor in Telema1cs Engineering October 2015
  2. 1. Introduc1on and goals 2. Short history of web mapping

    3. The source data 4. The caching algorithm 5. Results and conclusions Predic1ve analysis for cache genera1on in quadtree based geo visualiza1ons
  3. The amount of 1me people spend online looking at web

    maps has soared by more than 50% in the past two years. 1. Introduc1on and goals Source: ComScore
  4. • To predict usage paMerns in web maps so that

    data can be precached to improve the usability of such maps 1. Introduc1on and goals The goal
  5. • U.S. revenue in the geospa1al industry es1mated in $100

    billion by 2017
 • Legal frameworks regulate government solu1ons (INSPIRE Direc-ve in Europe) 1. Introduc1on and goals The environment
  6. The concept of a 1le • Tiles are PNG images

    of 256x256 pixels
 • Tiles are drawn according to the Web Mercator projec1on
 • Tiles are described by an ZXY numbering scheme, where Z is the zoom level and X and Y iden1fy the 1le 2. Short history of web mapping
  7. 2. Short history of web mapping The quadtree Tiles are

    organised in a quadtree scheme: a tree structure in which each internal node has exactly four children. At each zoom level, a map will be formed by 22z -les.
  8. 2. Short history of web mapping The layers of a

    map !!!!!?###?!######## !!!!!?????######### !!?????????????###! !!???????######### !!!!!?###??######## !!!!???????######## !!!??############# Basemap layer Data layer(s) Interac1vity layer
  9. 3. The source data CDN logs for user requests PostgreSQL

    and Redis dumps for maps and layers metadata 150GB plain text logs 10GB Postgres database 800MB Redis data
  10. The data cura1on process 3. The source data Log data:

    • Collected from compressed files by using regular expressions in Python and transformed to JSON 
 Map metadata: • Sources transformed to JSON files Event = namedtuple("Event", [ 'x', 'y', 'z', 'time', ‘user', ‘ip_address', 'named_map_template', 'layergroup', 'layergroup_timestamp', 'type' ])
  11. Data insights 3. The source data Total requests: 1.7M
 80%

    of which are 1le requests Ratio 0 0,06 0,12 0,18 0,24 0,3 Zoom level 0 2 4 6 8 10 12 14 16 18 20 22 24 26 28 Requests by zoom level: Key measurement: From a specific from level, how much keeps the user zooming in?
  12. Timing breakdown TTILE = TDATA + TRENDERING TDATA • Increases

    with the complexity of the SQL needed to generate the informa1on
 
 • Increases with the amount of data to be drawn or the complexity of its drawing proper1es 
 TRENDERING SELECT p.*, d.escrutado,
 partido_ganador, d.p_vot
 d.nom_municipio, d.numer FROM poligonos_municipio WHERE p.cod_municipio = AND p.cod_provincia = d. AND d.escrutado >= 3 4. The caching algorithm
  13. The caching algorithm: pseudo-code 4. The caching algorithm def caching_traversal(quads,

    max_depth): if max_depth <= 0 or timed_out(): return quads = sorted(quads, key=lambda q: q.information_density) for q in quads: cache_tile(q) md = (max_depth - 1) * q.information_density caching_traversal(q.quads, md) caching_traversal(quads, AverageZoom[z])
  14. 5. Results and conclusions The results • Average TCACHED ≈

    55ms.
 • Min(TTILE ) ≈ 170ms. Max(TTILE ) ≈ 45s
 • The caching technique covers the most common requests