Upgrade to Pro — share decks privately, control downloads, hide ads and more …

Metrics-Driven Rails Performance

j3
January 12, 2012

Metrics-Driven Rails Performance

j3

January 12, 2012
Tweet

More Decks by j3

Other Decks in Technology

Transcript

  1. On Performance 15 Performance is User Experience (UX) UX is

    the only thing that matters Friday, February 3, 12
  2. Perftools.rb 29 ▪ Every Time Slice: ▪ Which method is

    being executed? ▪ Who called it? Friday, February 3, 12
  3. Perftools Text Output 34 2 1.6% 72.0% 10 8.0% ActionDispatch::Routing::RouteSet::Generator#initialize

    Number of times execution was in this method when the sample was taken That sample count as a percentage of all samples taken Friday, February 3, 12
  4. Perftools Text Output 35 2 1.6% 72.0% 10 8.0% ActionDispatch::Routing::RouteSet::Generator#initialize

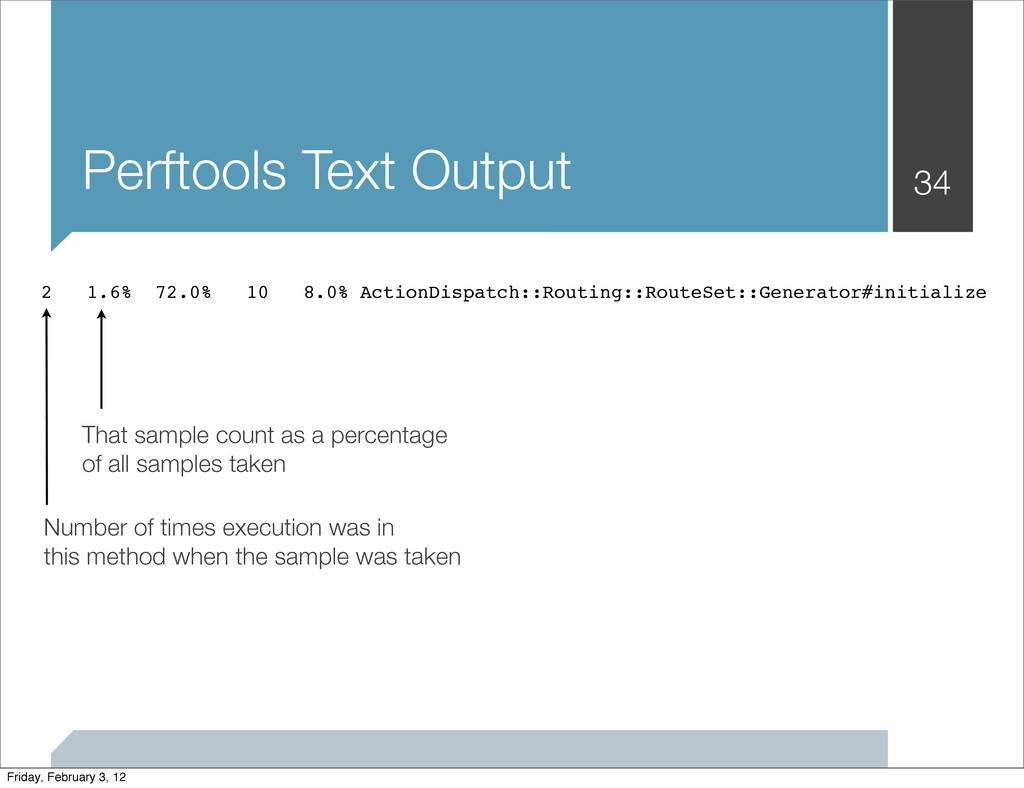
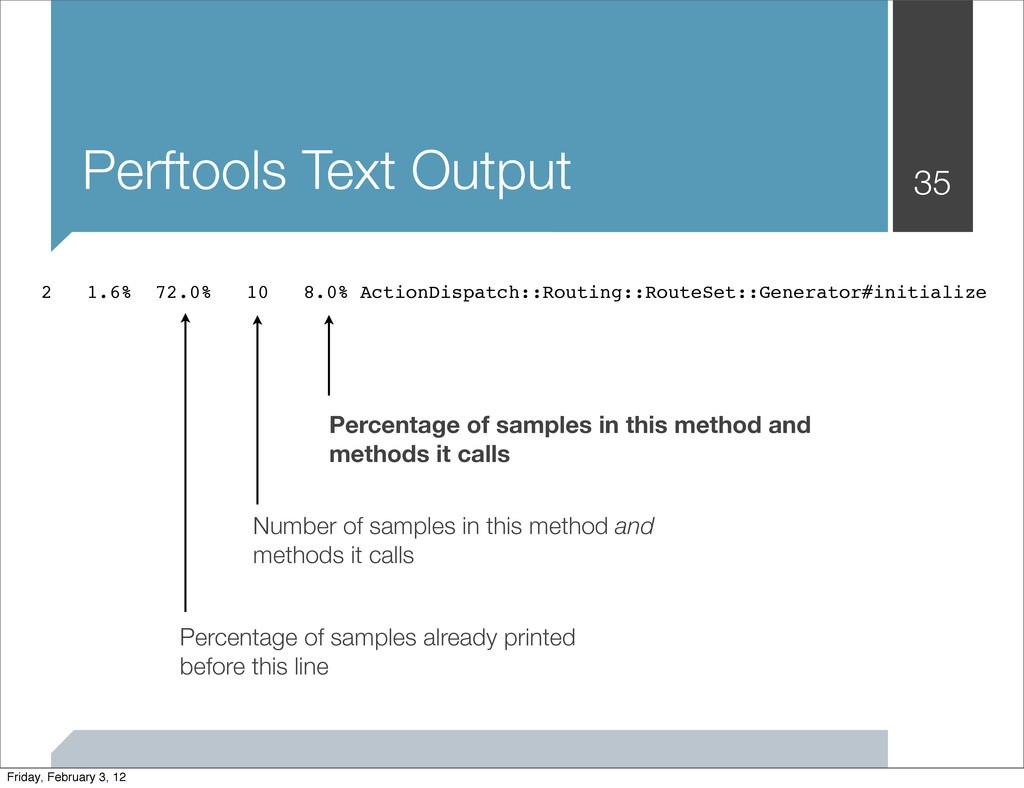
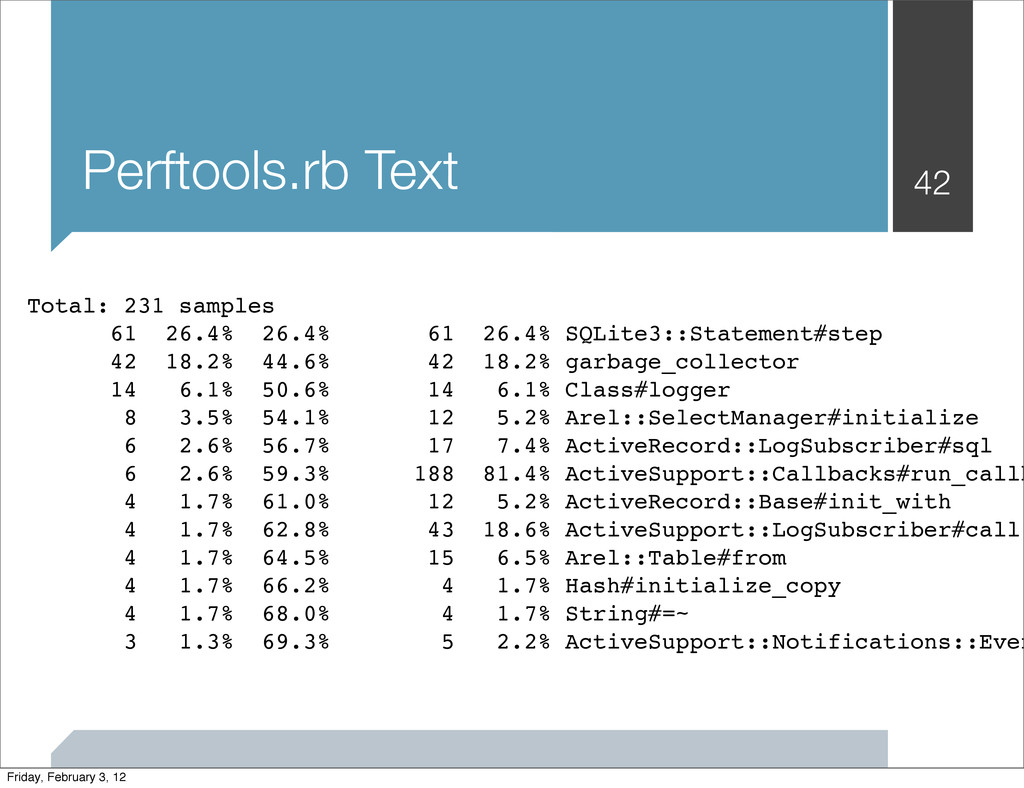
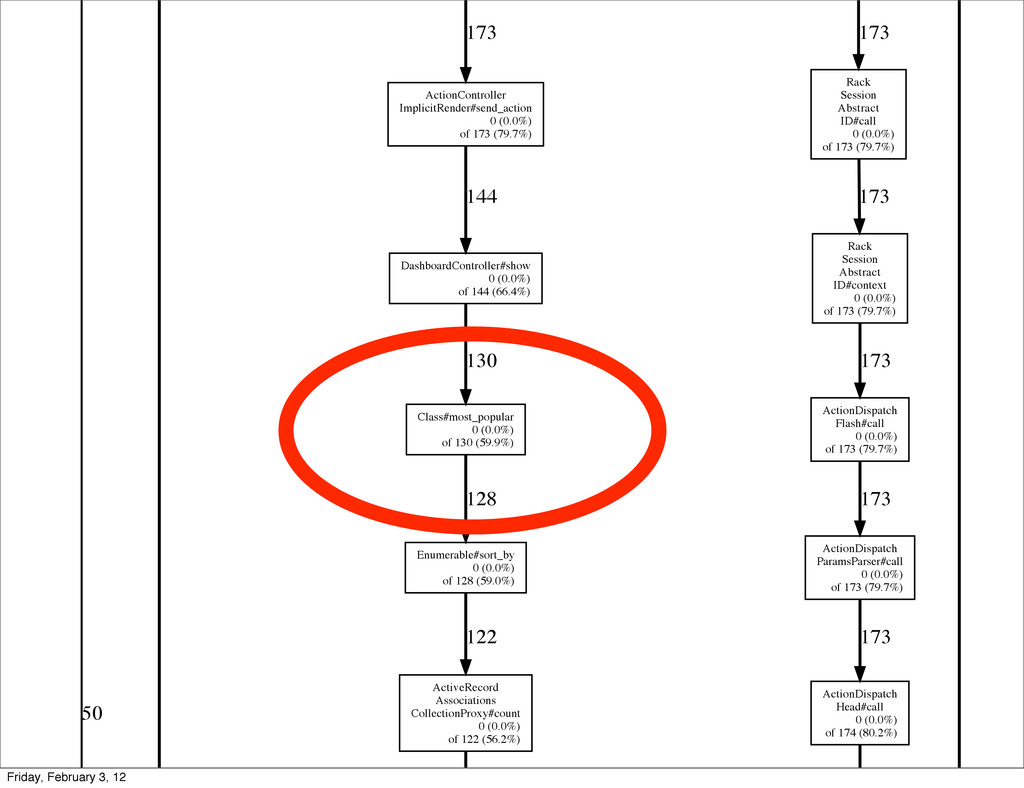
    Percentage of samples already printed before this line Number of samples in this method and methods it calls Percentage of samples in this method and methods it calls Friday, February 3, 12
  5. Perftools PDF Output 37 Samples recorded in this method Calling

    Methods Methods It Calls Samples in this method and methods it calls Friday, February 3, 12
  6. /Users/jcasimir/.rvm/rubies/ruby-1.9.2-p290/bin/ruby Total samples: 131 Focusing on: 131 Dropped nodes with

    <= 0 abs(samples) Dropped edges with <= 0 samples ActionDispatch BestStandardsSupport#call 0 (0.0%) of 80 (61.1%) Bullet Rack#call 0 (0.0%) of 80 (61.1%) 80 Rack PerftoolsProfiler ProfilerMiddleware#call 0 (0.0%) of 80 (61.1%) 80 Rack PerftoolsProfiler ProfileOnce#act 0 (0.0%) of 80 (61.1%) Rack PerftoolsProfiler Profiler#profile 0 (0.0%) of 80 (61.1%) 80 80 Friday, February 3, 12
  7. ActionView AbstractRenderer#wrap_formats 0 (0.0%) of 78 (59.5%) ActionView TemplateRenderer#render_template 0

    (0.0%) of 77 (58.8%) 77 ActionView Renderer#render_template 0 (0.0%) of 78 (59.5%) 78 ActionView TemplateRenderer#render 0 (0.0%) of 78 (59.5%) 78 78 ActionView AbstractRenderer#instrument 0 (0.0%) of 77 (58.8%) ActionView TemplateRenderer#render_with_layout 0 (0.0%) of 77 (58.8%) 77 77 Friday, February 3, 12
  8. Perftools CPU: What to Watch For ▪ Text-mode can find

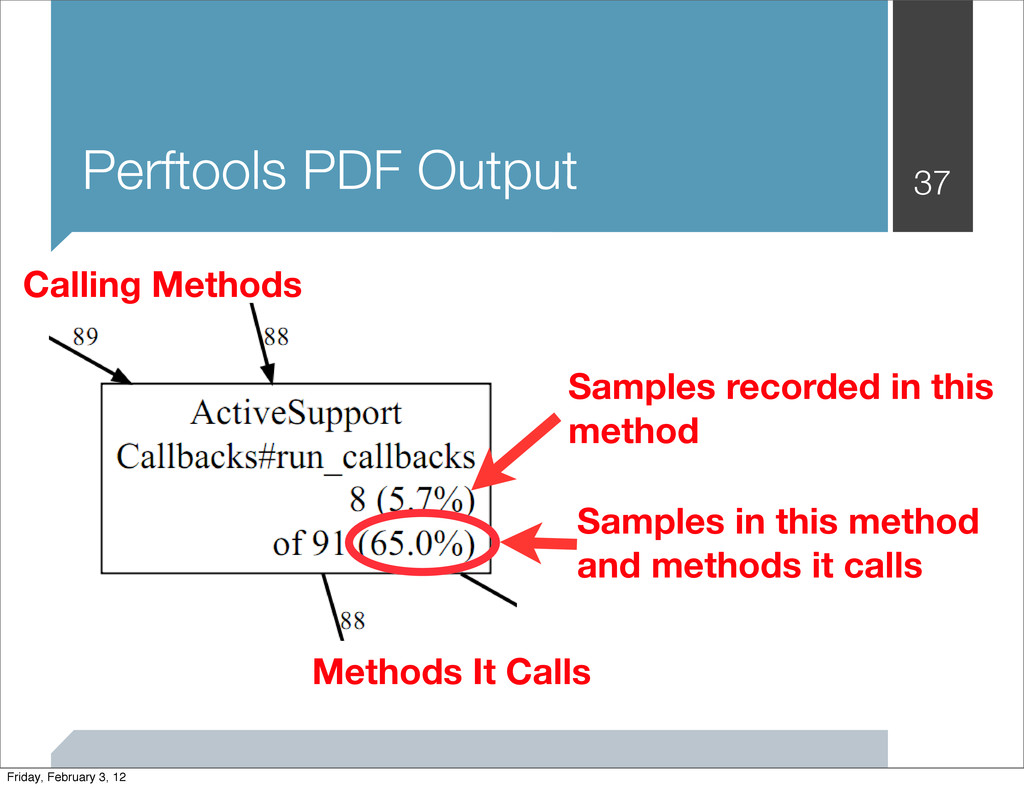
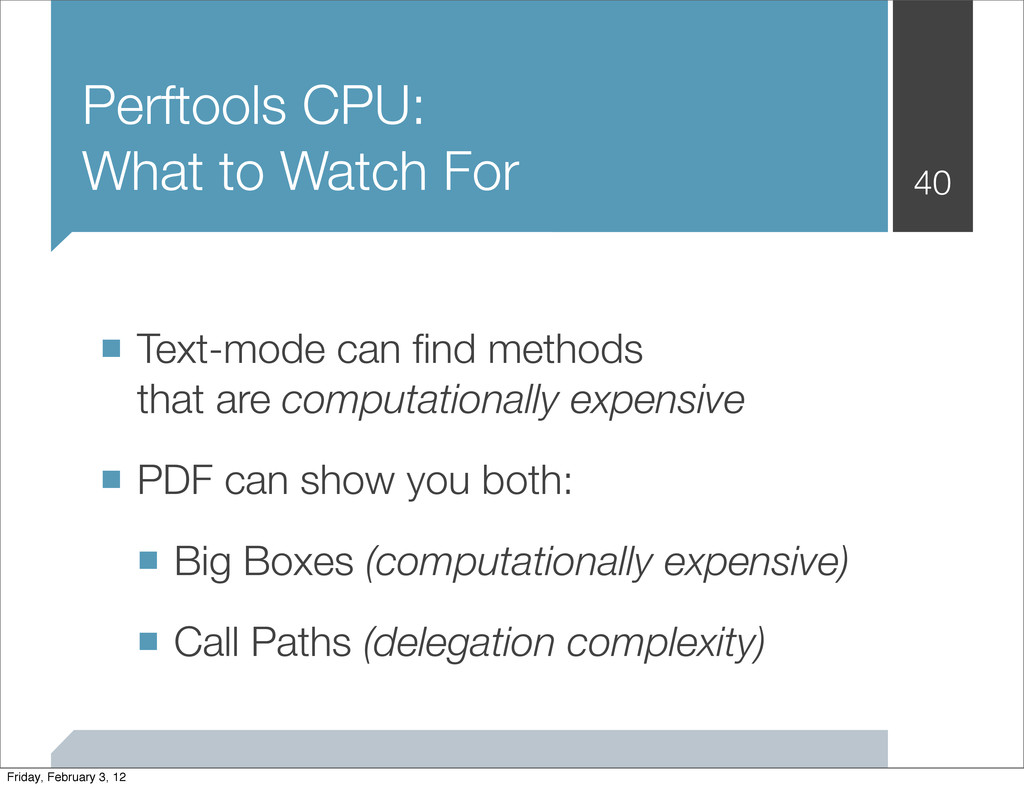
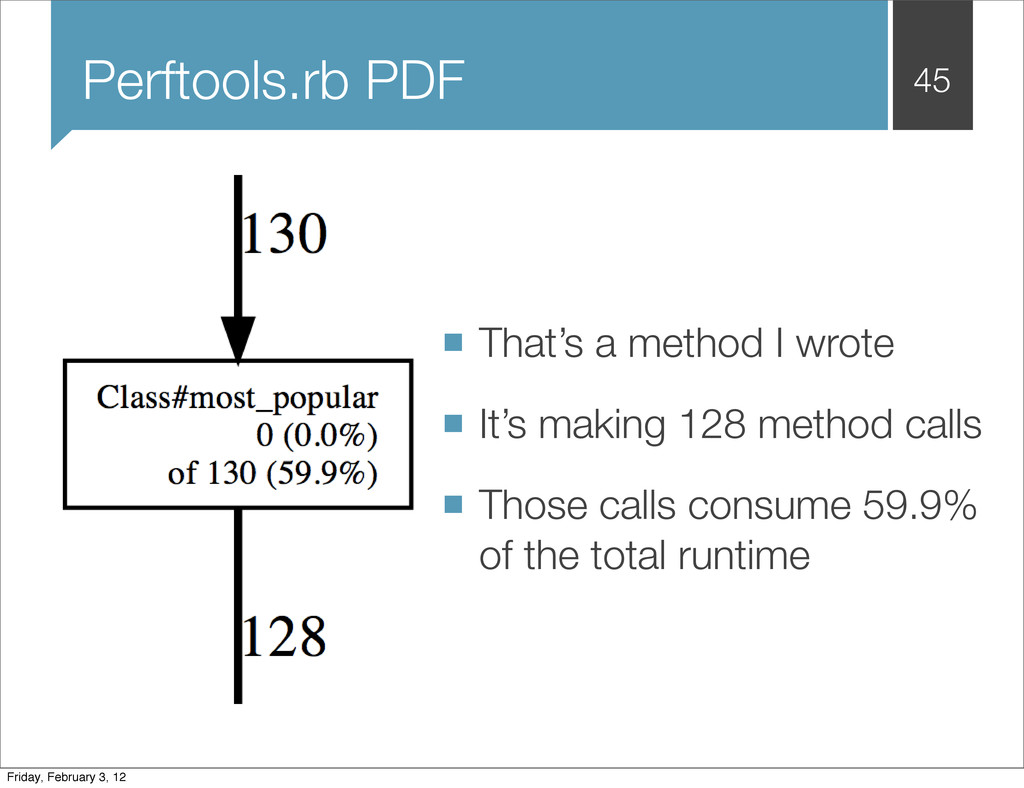
    methods that are computationally expensive ▪ PDF can show you both: ▪ Big Boxes (computationally expensive) ▪ Call Paths (delegation complexity) 40 Friday, February 3, 12
  9. Example: Blog Dashboard ▪ https://github.com/jumpstartlab/jsblogger_advanced ▪ Setup 1000 sample articles

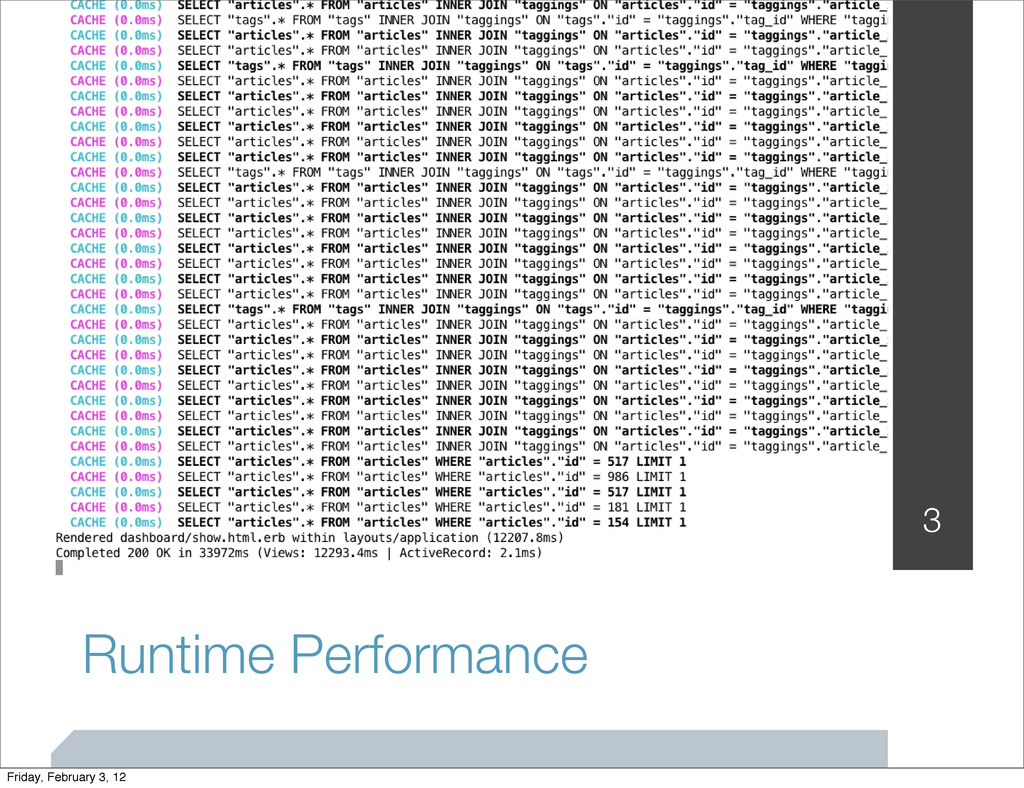
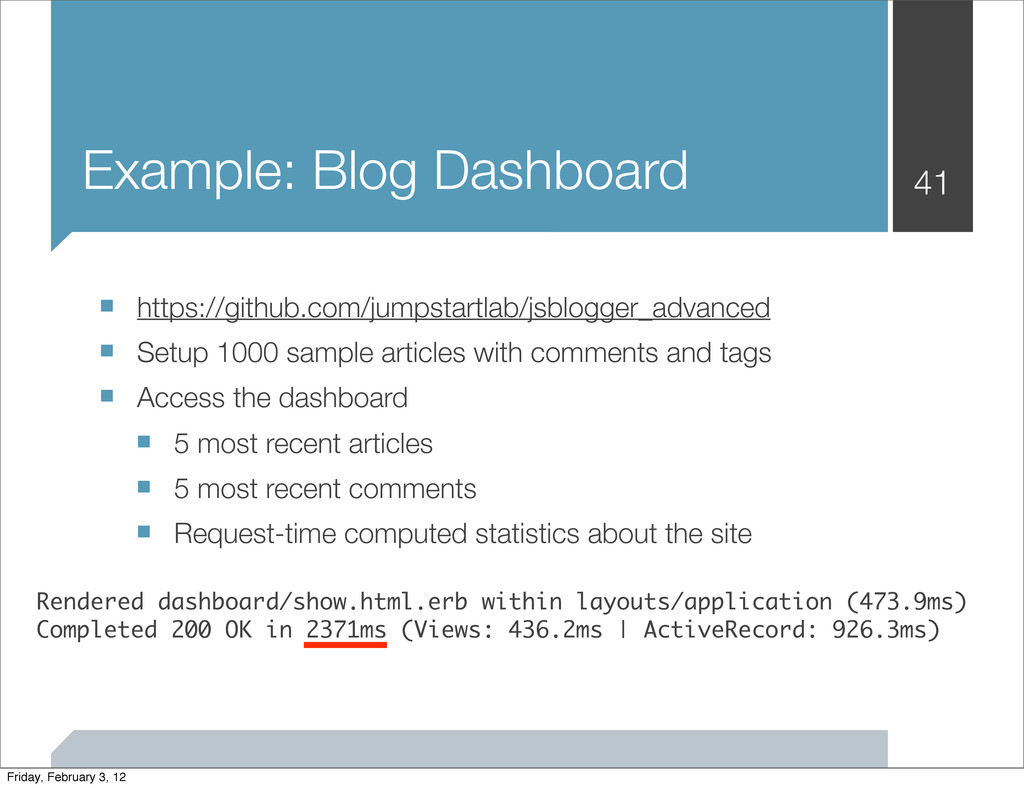
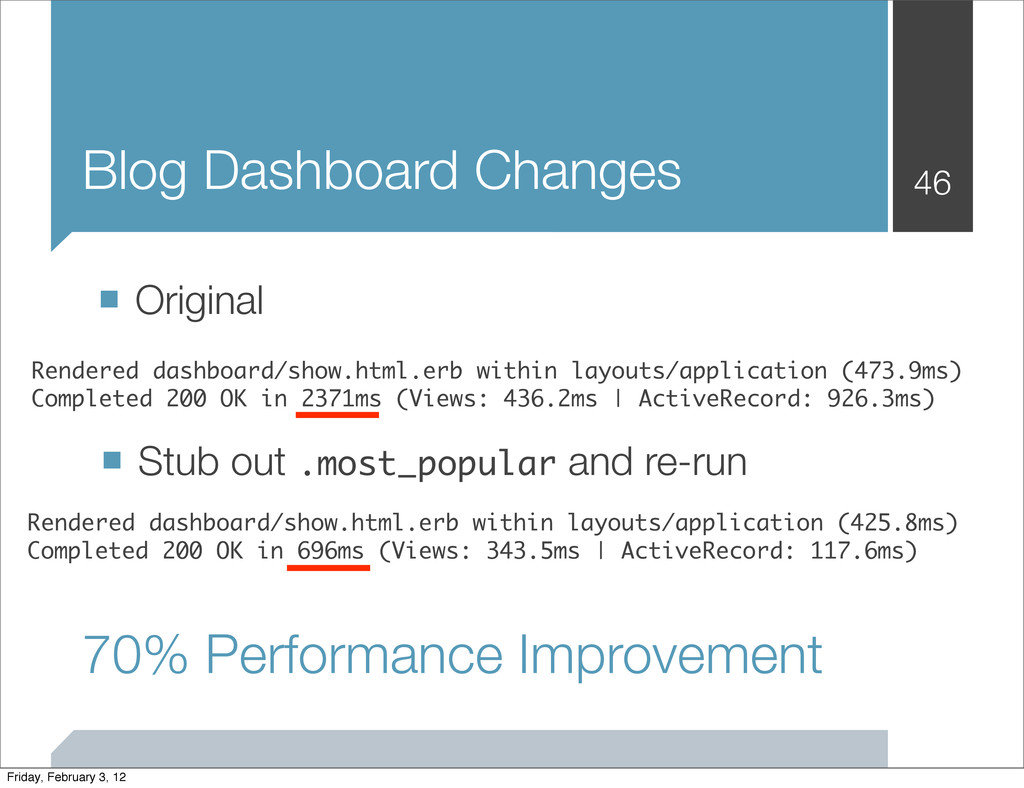
    with comments and tags ▪ Access the dashboard ▪ 5 most recent articles ▪ 5 most recent comments ▪ Request-time computed statistics about the site 41 Rendered dashboard/show.html.erb within layouts/application (473.9ms) Completed 200 OK in 2371ms (Views: 436.2ms | ActiveRecord: 926.3ms) Friday, February 3, 12
  10. Perftools.rb Text 42 Total: 231 samples 61 26.4% 26.4% 61

    26.4% SQLite3::Statement#step 42 18.2% 44.6% 42 18.2% garbage_collector 14 6.1% 50.6% 14 6.1% Class#logger 8 3.5% 54.1% 12 5.2% Arel::SelectManager#initialize 6 2.6% 56.7% 17 7.4% ActiveRecord::LogSubscriber#sql 6 2.6% 59.3% 188 81.4% ActiveSupport::Callbacks#run_callb 4 1.7% 61.0% 12 5.2% ActiveRecord::Base#init_with 4 1.7% 62.8% 43 18.6% ActiveSupport::LogSubscriber#call 4 1.7% 64.5% 15 6.5% Arel::Table#from 4 1.7% 66.2% 4 1.7% Hash#initialize_copy 4 1.7% 68.0% 4 1.7% String#=~ 3 1.3% 69.3% 5 2.2% ActiveSupport::Notifications::Even Friday, February 3, 12
  11. /Users/jcasimir/.rvm/rubies/ruby-1.9.2-p290/bin/ruby Total samples: 217 Focusing on: 217 Dropped nodes with

    <= 1 abs(samples) Dropped edges with <= 0 samples ActionDispatch BestStandardsSupport#call 0 (0.0%) of 174 (80.2%) Bullet Rack#call 0 (0.0%) of 174 (80.2%) 174 Rack PerftoolsProfiler ProfilerMiddleware#call 0 (0.0%) of 174 (80.2%) 174 Rack PerftoolsProfiler ProfileOnce#act 0 (0.0%) of 174 (80.2%) Rack PerftoolsProfiler 174 174 Friday, February 3, 12
  12. ActionDispatch Head#call 0 (0.0%) of 174 (80.2%) ActionController ImplicitRender#send_action 0

    (0.0%) of 173 (79.7%) 173 DashboardController#show 0 (0.0%) of 144 (66.4%) 144 Rack Session Abstract ID#call 0 (0.0%) of 173 (79.7%) 173 ActionDispatch Flash#call 0 (0.0%) of 173 (79.7%) ActionDispatch ParamsParser#call 0 (0.0%) of 173 (79.7%) 173 173 50 Rack Session Abstract ID#context 0 (0.0%) of 173 (79.7%) 173 173 Class#most_popular 0 (0.0%) of 130 (59.9%) 130 Enumerable#sort_by 0 (0.0%) of 128 (59.0%) 128 ActiveRecord Associations CollectionProxy#count 0 (0.0%) of 122 (56.2%) 122 Friday, February 3, 12
  13. 45 Perftools.rb PDF ▪ That’s a method I wrote ▪

    It’s making 128 method calls ▪ Those calls consume 59.9% of the total runtime Friday, February 3, 12
  14. Blog Dashboard Changes ▪ Original 46 Rendered dashboard/show.html.erb within layouts/application

    (473.9ms) Completed 200 OK in 2371ms (Views: 436.2ms | ActiveRecord: 926.3ms) Rendered dashboard/show.html.erb within layouts/application (425.8ms) Completed 200 OK in 696ms (Views: 343.5ms | ActiveRecord: 117.6ms) 70% Performance Improvement ▪ Stub out .most_popular and re-run Friday, February 3, 12
  15. More Digging ▪ In the Rails Console ▪ From the

    Terminal 47 > PerfTools::CpuProfiler.start("/tmp/article_most_popular") do > Article.most_popular > end $ pprof.rb --text /tmp/article_most_popular $ pprof.rb --pdf /tmp/article_most_popular > /tmp/most_popular.pdf $ open most_popular.pdf Friday, February 3, 12
  16. Conclusions 48 Total: 177 samples 110 62.1% 62.1% 110 62.1%

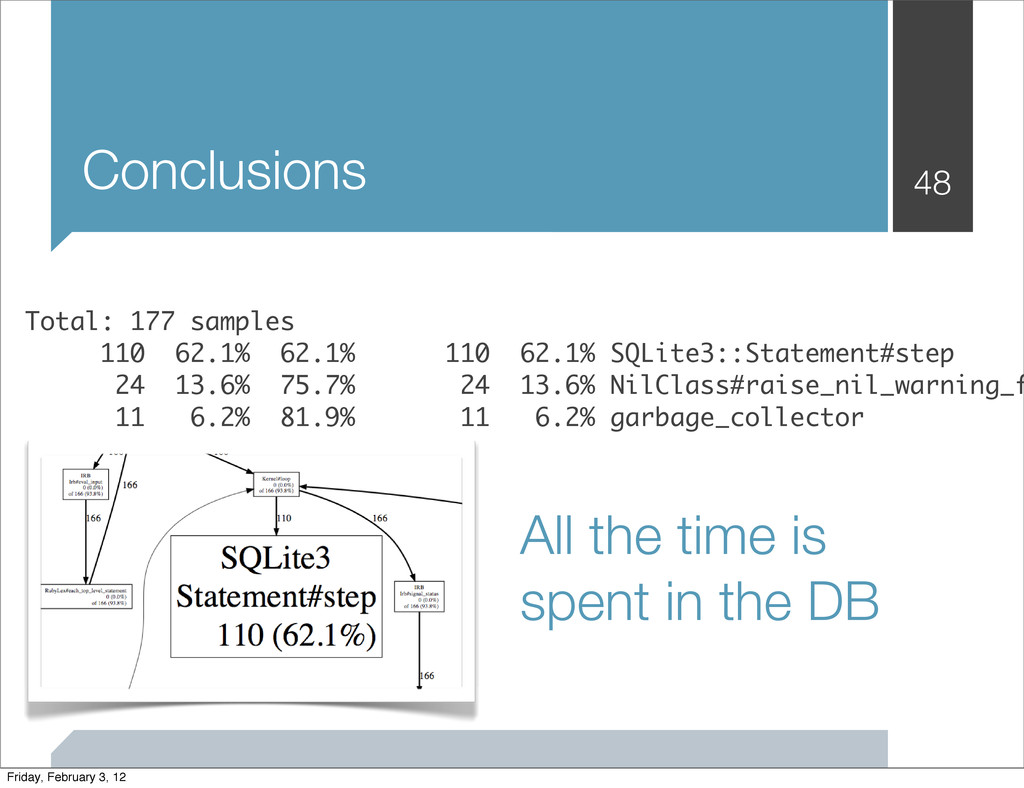
    SQLite3::Statement#step 24 13.6% 75.7% 24 13.6% NilClass#raise_nil_warning_f 11 6.2% 81.9% 11 6.2% garbage_collector All the time is spent in the DB Friday, February 3, 12
  17. Perftools.rb for Memory/Objects 52 ▪ Use the rack middleware like

    before ▪ Append mode=objects to the URL: http://localhost:3000/articles/2? profile=true&printer=text&mode=objects Friday, February 3, 12
  18. Perftools.rb Memory Text 53 Total: 1378046 samples 206488 15.0% 15.0%

    361354 26.2% ActiveRecord::Base#init_with 131334 9.5% 24.5% 131334 9.5% String#split 103246 7.5% 32.0% 1377610 100.0% ActiveSupport::Callbacks#run_cal 101871 7.4% 39.4% 101871 7.4% Array#zip 91892 6.7% 46.1% 91892 6.7% Kernel#caller 79669 5.8% 51.8% 79669 5.8% Symbol#to_s 77433 5.6% 57.5% 465076 33.7% Class#instantiate 77265 5.6% 63.1% 77265 5.6% Hash.[] How useful is this? Friday, February 3, 12
  19. Setup 57 Gemfile gem 'bullet' Initializer YourAppName::Application.config.after_initialize do Bullet.enable =

    true Bullet.alert = true Bullet.disable_browser_cache = true Bullet.rails_logger = true end Friday, February 3, 12
  20. In the Log File 59 localhost:3000http://localhost:3000/articles N+1 Query detected Tag

    => [:articles] Add to your finder: :include => [:articles] N+1 Query method call stack /Users/jcasimir/Dropbox/Projects/jsblogger_advanced/app/helpers/ tags_helper.rb:30:in `block in tag_links_with_count' /Users/jcasimir/Dropbox/Projects/jsblogger_advanced/app/helpers/ tags_helper.rb:29:in `tag_links_with_count' /Users/jcasimir/Dropbox/Projects/jsblogger_advanced/app/views/articles/ index.html.erb:13:in `block in _app_views_articles_index_html_erb___186389655085943572_70332291225800' /Users/jcasimir/Dropbox/Projects/jsblogger_advanced/app/views/articles/ index.html.erb:10:in `_app_views_articles_index_html_erb___186389655085943572_70332291225800' Friday, February 3, 12
  21. That Helper Method 60 def tag_links_with_count(tags) tags.collect do |tag| link_to

    ("#{tag.name} (#{tag.articles.length})"), articles_path(:tag => tag.name) end.join(",").html_safe end Friday, February 3, 12
  22. Link Helper Changes ▪ Original with .length 61 Rendered articles/index.html.erb

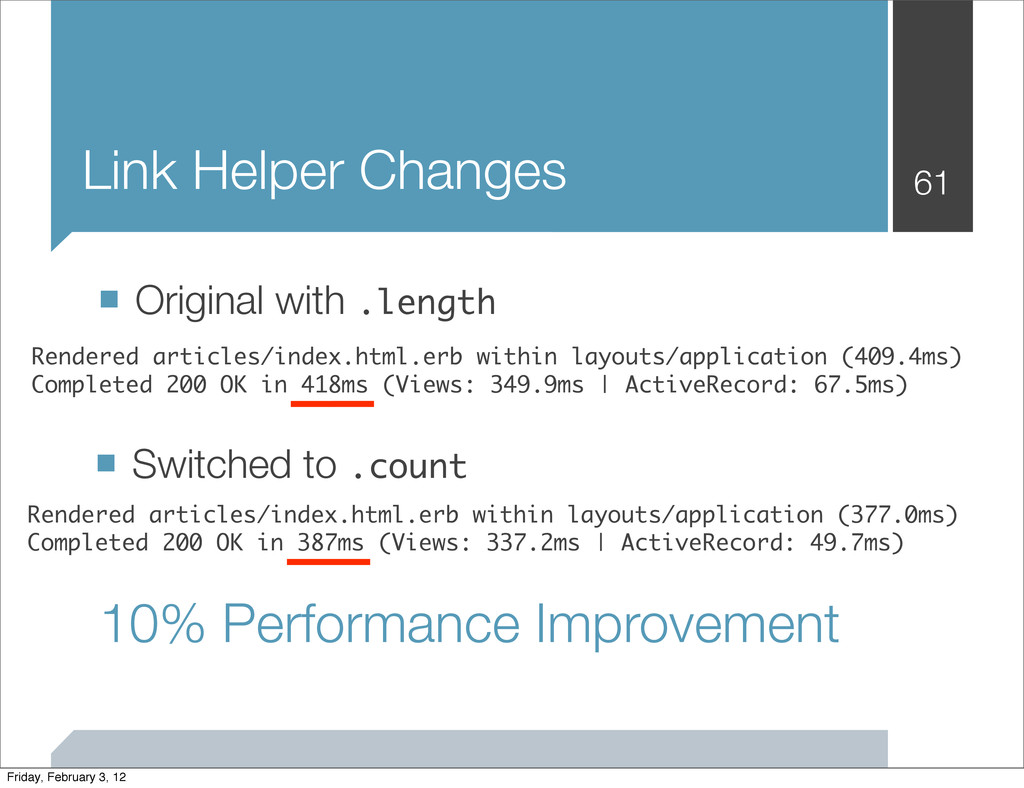
    within layouts/application (409.4ms) Completed 200 OK in 418ms (Views: 349.9ms | ActiveRecord: 67.5ms) Rendered articles/index.html.erb within layouts/application (377.0ms) Completed 200 OK in 387ms (Views: 337.2ms | ActiveRecord: 49.7ms) 10% Performance Improvement ▪ Switched to .count Friday, February 3, 12
  23. Setup 63 Gemfile gem 'slowjam' Initializer Slowjam.threshold = 3 #

    milliseconds Slowjam.frames = 5 Slowjam.accept = %r{^(app|config|lib)}.freeze Slowjam.cleaner = Rails.backtrace_cleaner Slowjam.attach Friday, February 3, 12
  24. Logfile Results 64 [1m[35mComment Load (8.0ms)[0m SELECT "comments".* FROM "comments"

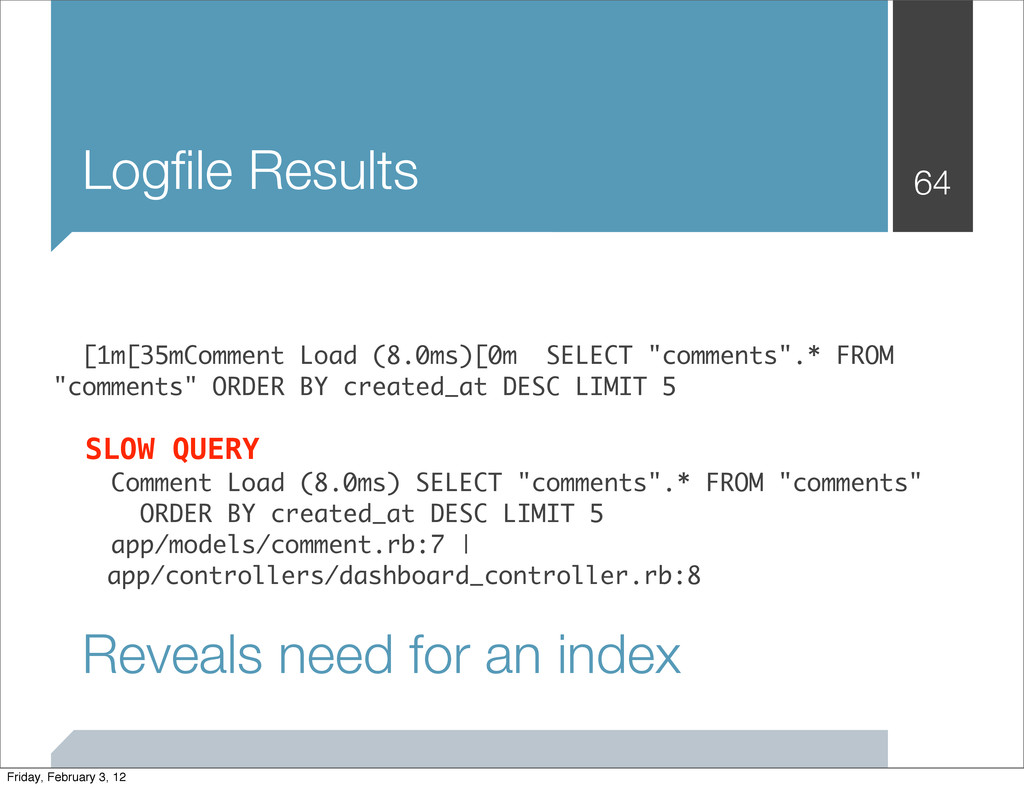
    ORDER BY created_at DESC LIMIT 5 SLOW QUERY Comment Load (8.0ms) SELECT "comments".* FROM "comments" ORDER BY created_at DESC LIMIT 5 app/models/comment.rb:7 | app/controllers/dashboard_controller.rb:8 Reveals need for an index Friday, February 3, 12
  25. 67 ▪ Performance matters! ▪ Profile the CPU with Perftools.rb

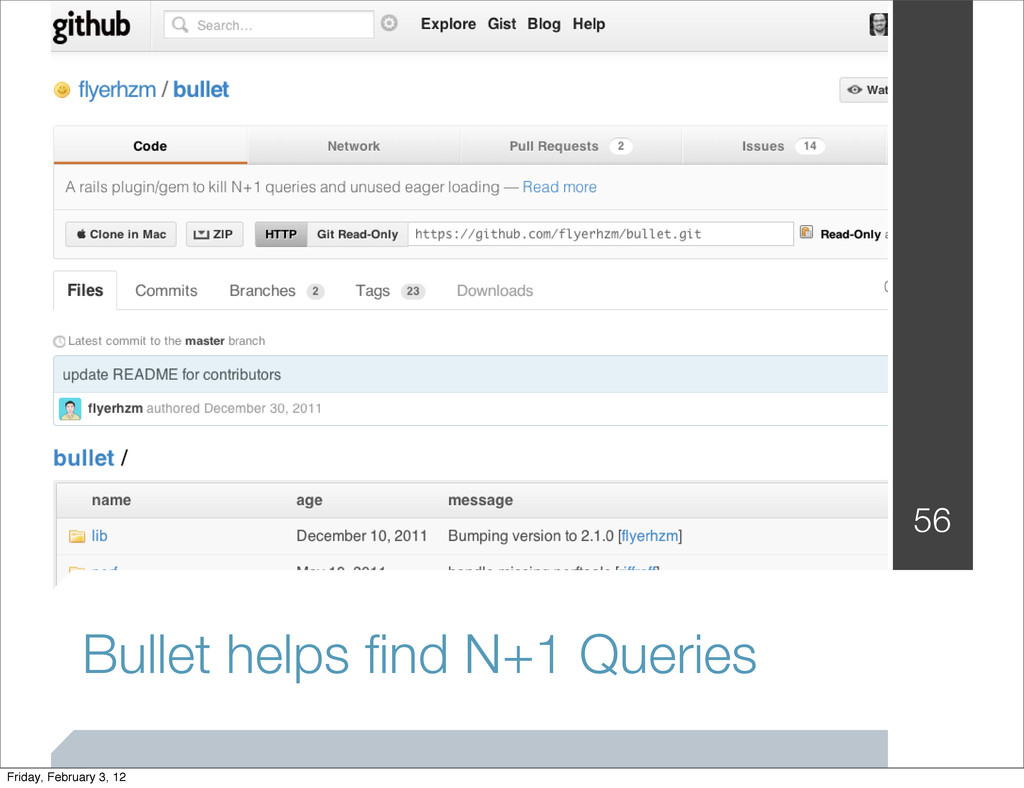
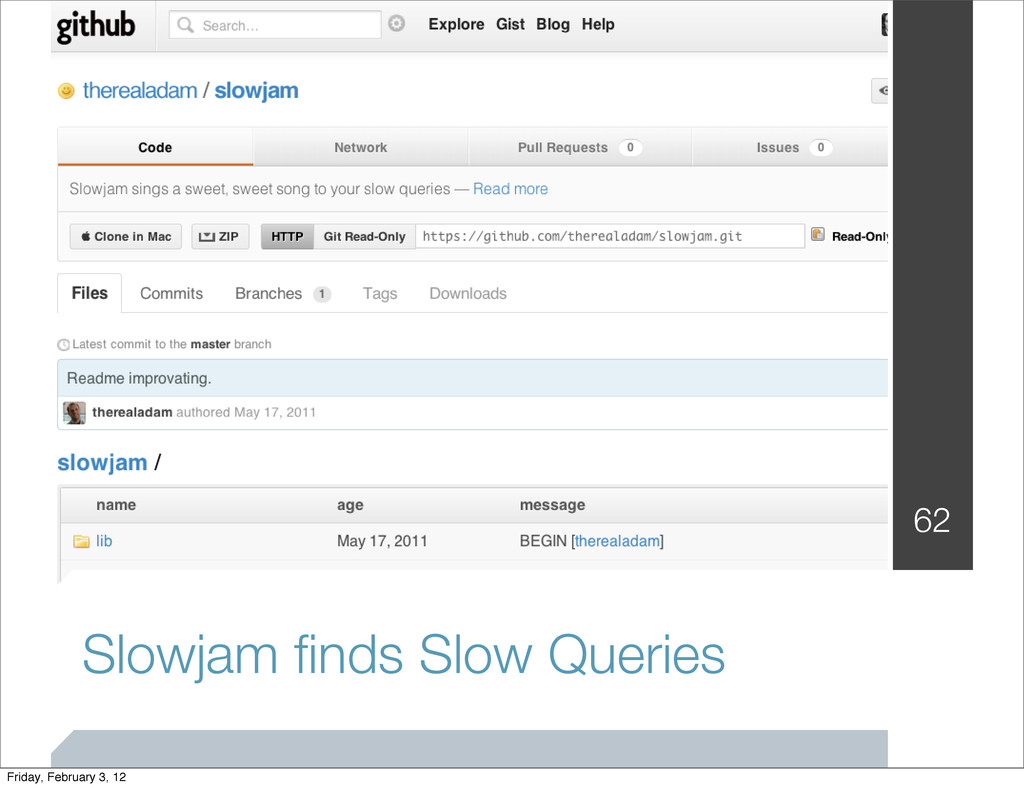
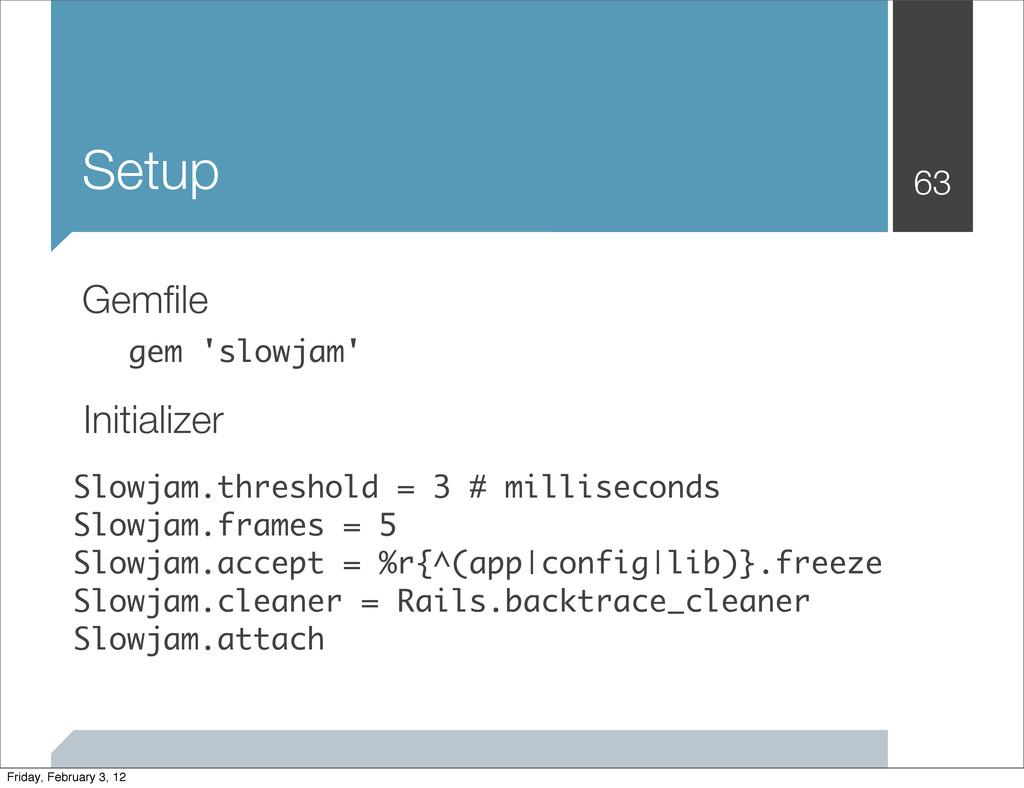
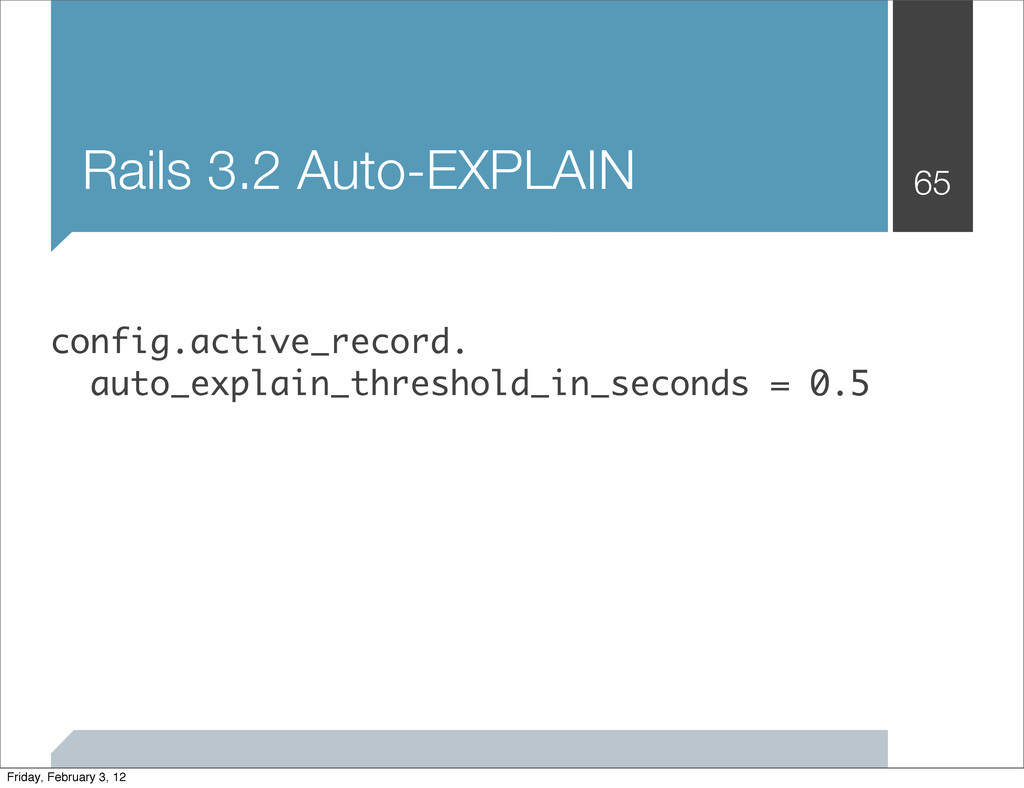
    ▪ Profile Memory with Memprof (1.8.7) or Perftools.rb ▪ Watch your Database ▪ N+1 Queries with Bullet ▪ Slow Queries with Slowjam / Auto-EXPLAIN ▪ Links and more resources at: http://jumpstartlab.com/performance Jeff Casimir / @j3 Metrics-Driven Rails Performance Friday, February 3, 12