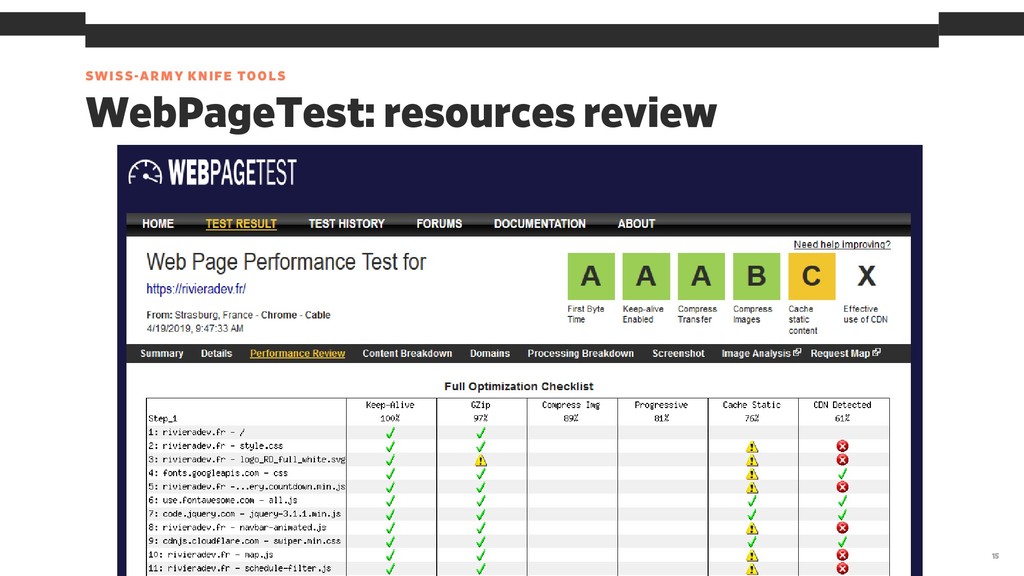
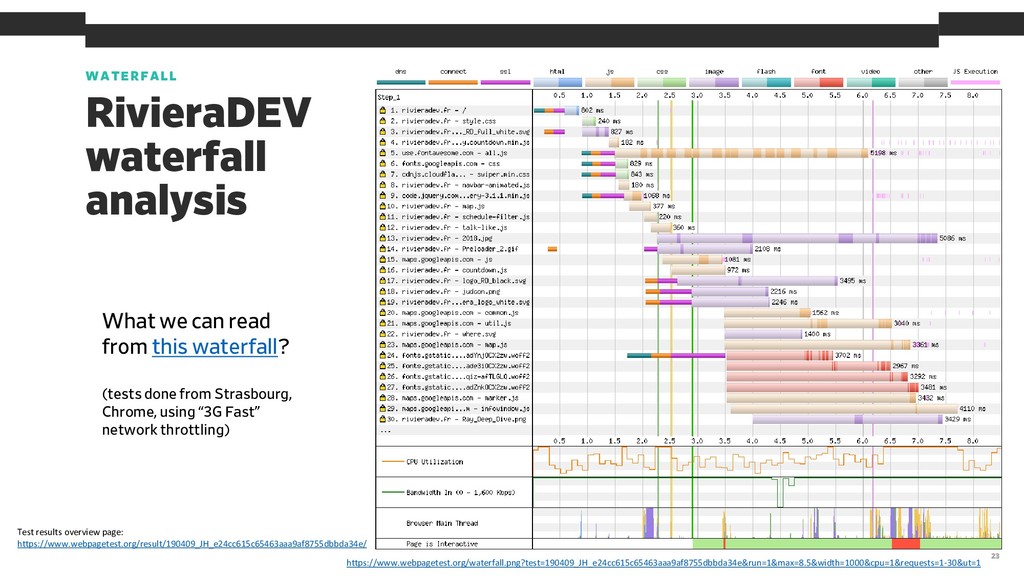
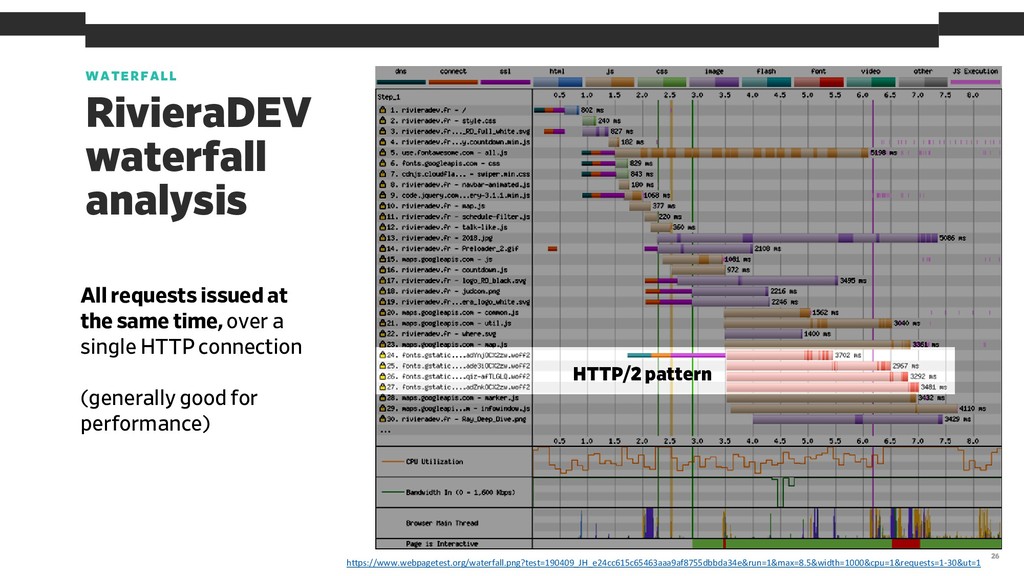
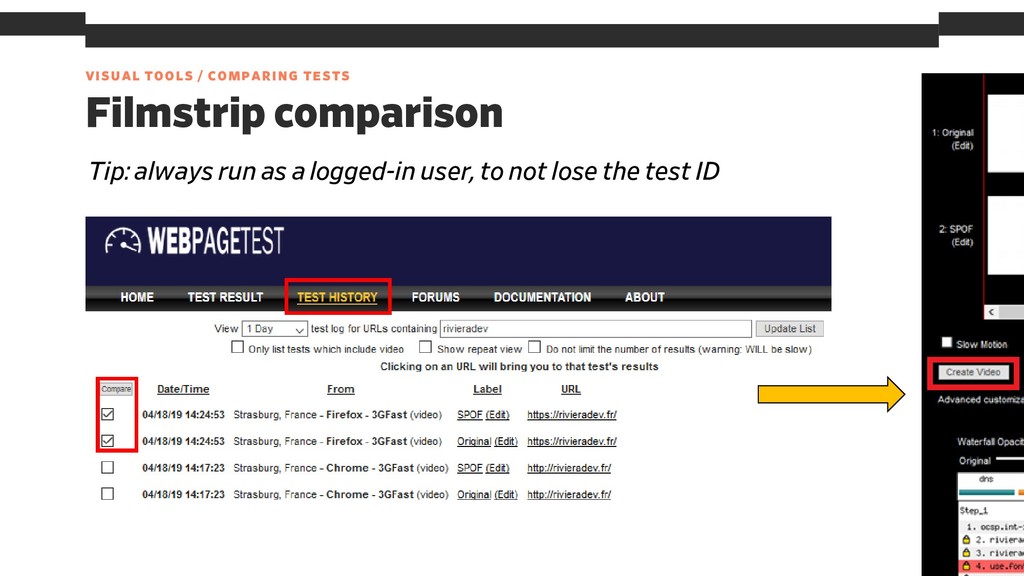
from this waterfall? (tests done from Strasbourg, Chrome, using “3G Fast” network throttling) Test results overview page: https://www.webpagetest.org/result/190409_JH_e24cc615c65463aaa9af8755dbbda34e/
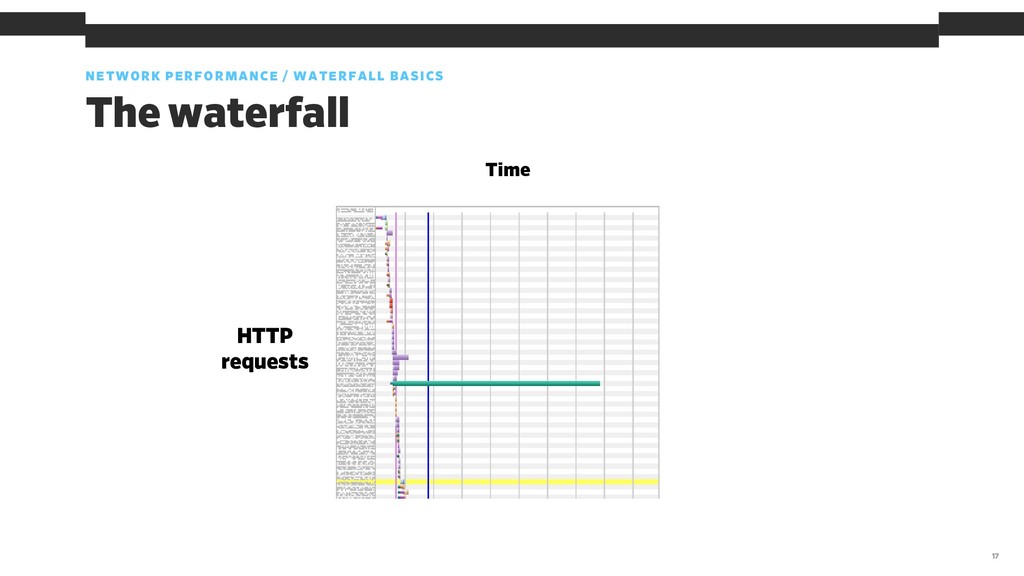
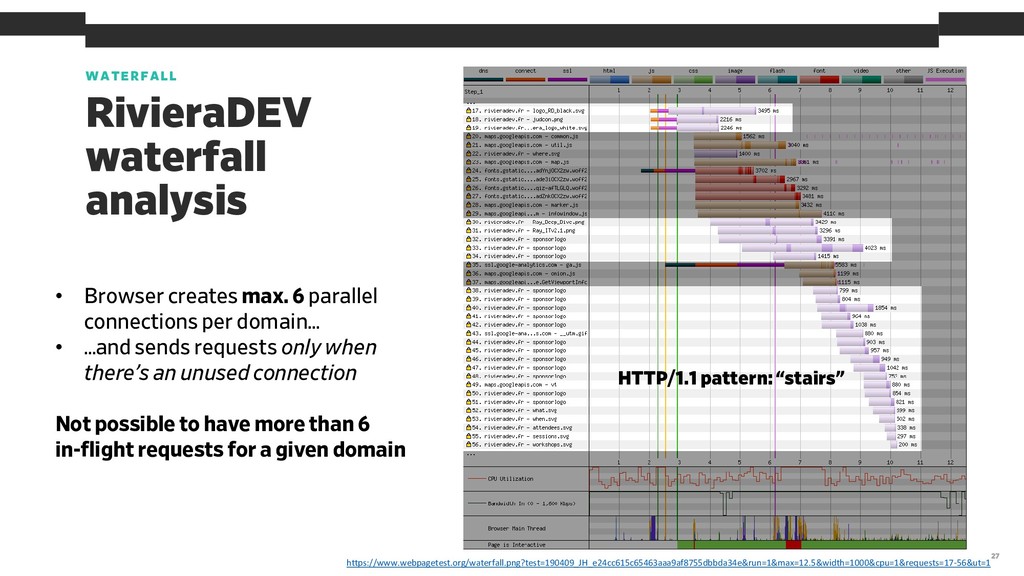
6 parallel connections per domain… • …and sends requests only when there’s an unused connection Not possible to have more than 6 in-flight requests for a given domain HTTP/1.1 pattern: “stairs”
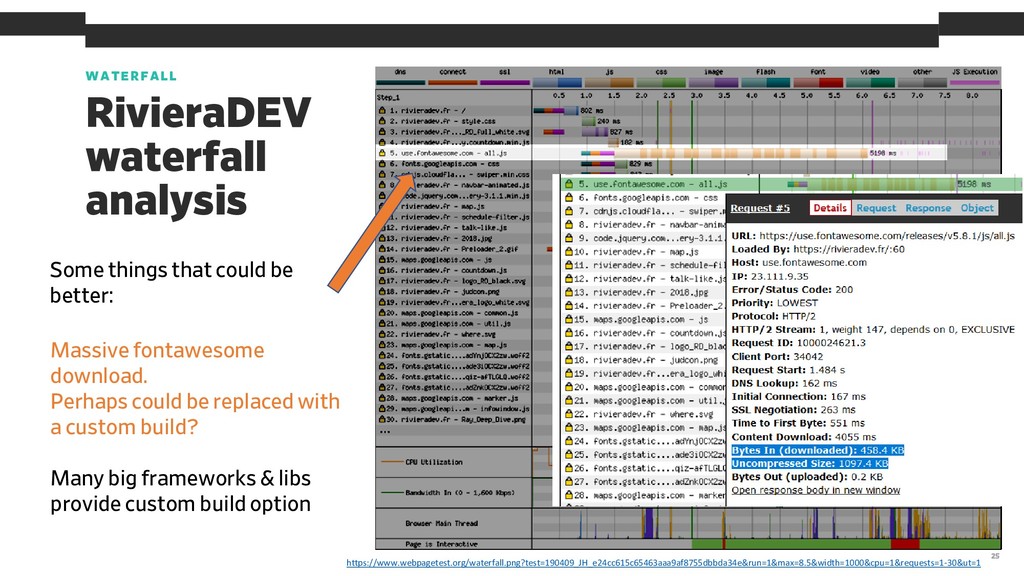
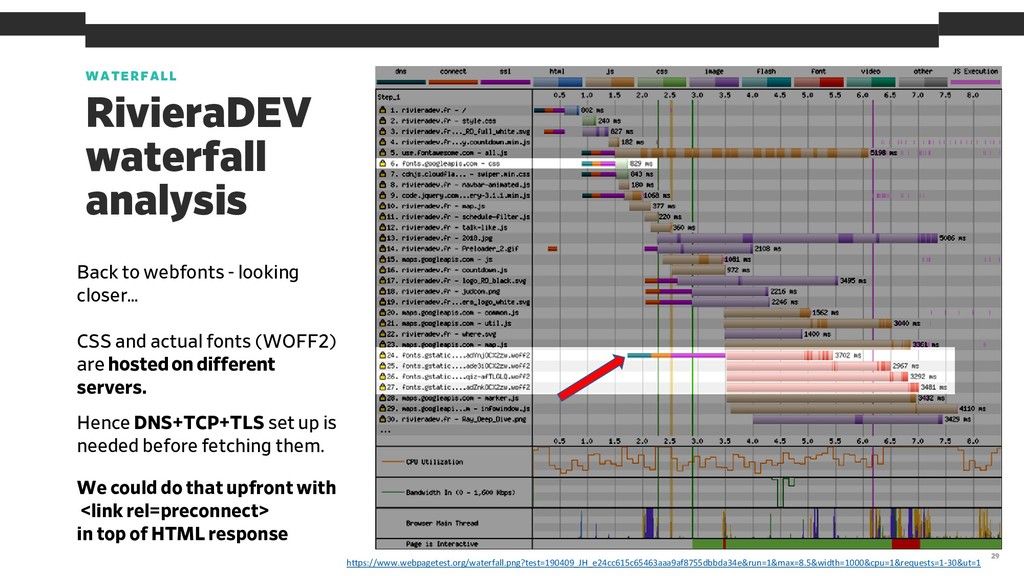
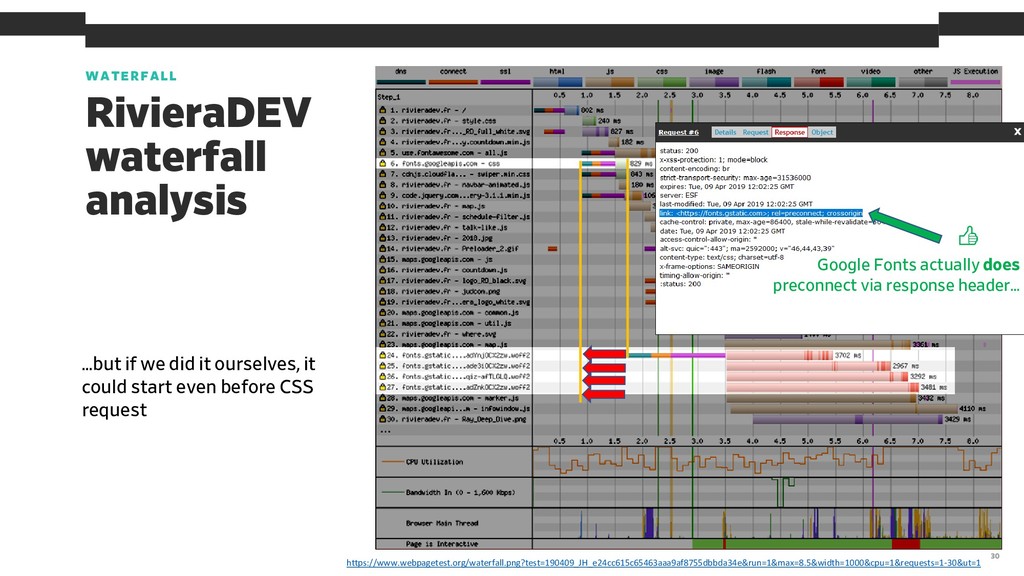
looking closer… CSS and actual fonts (WOFF2) are hosted on different servers. Hence DNS+TCP+TLS set up is needed before fetching them. We could do that upfront with <link rel=preconnect> in top of HTML response
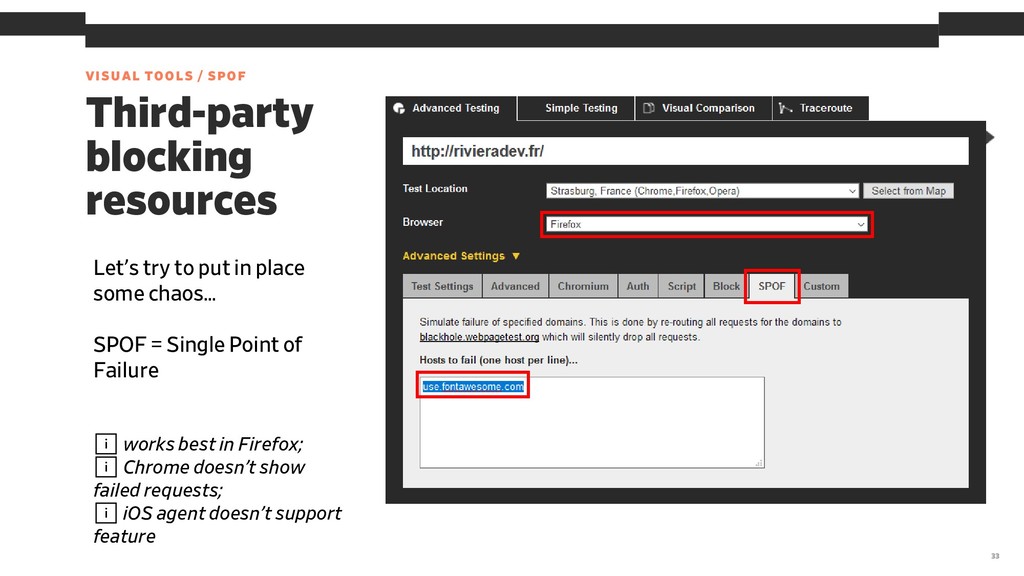
to put in place some chaos… SPOF = Single Point of Failure ℹ works best in Firefox; ℹ Chrome doesn’t show failed requests; ℹ iOS agent doesn’t support feature
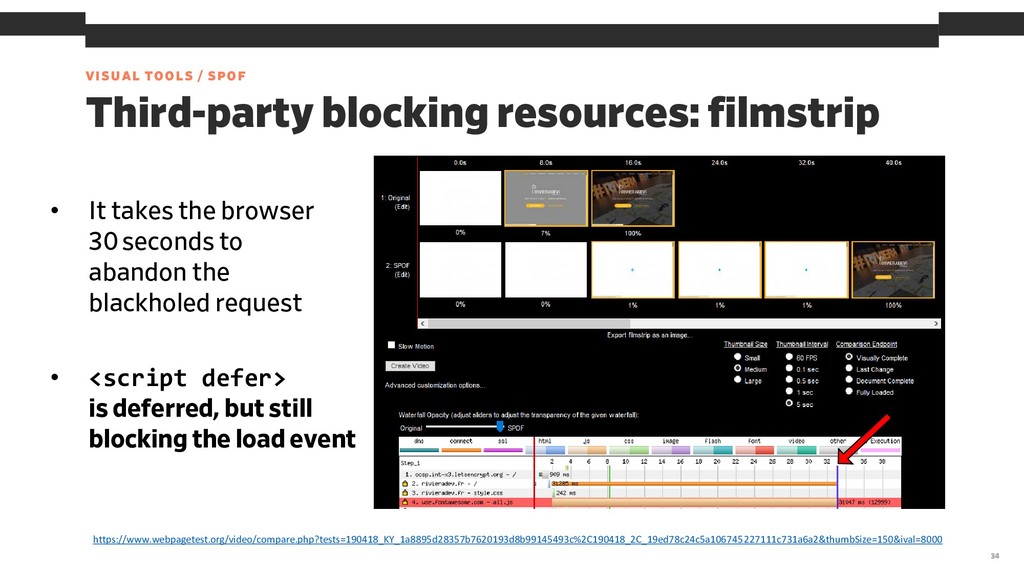
It takes the browser 30seconds to abandon the blackholed request https://www.webpagetest.org/video/compare.php?tests=190418_KY_1a8895d28357b7620193d8b99145493c%2C190418_2C_19ed78c24c5a106745227111c731a6a2&thumbSize=150&ival=8000 • <script defer> is deferred, but still blocking the load event
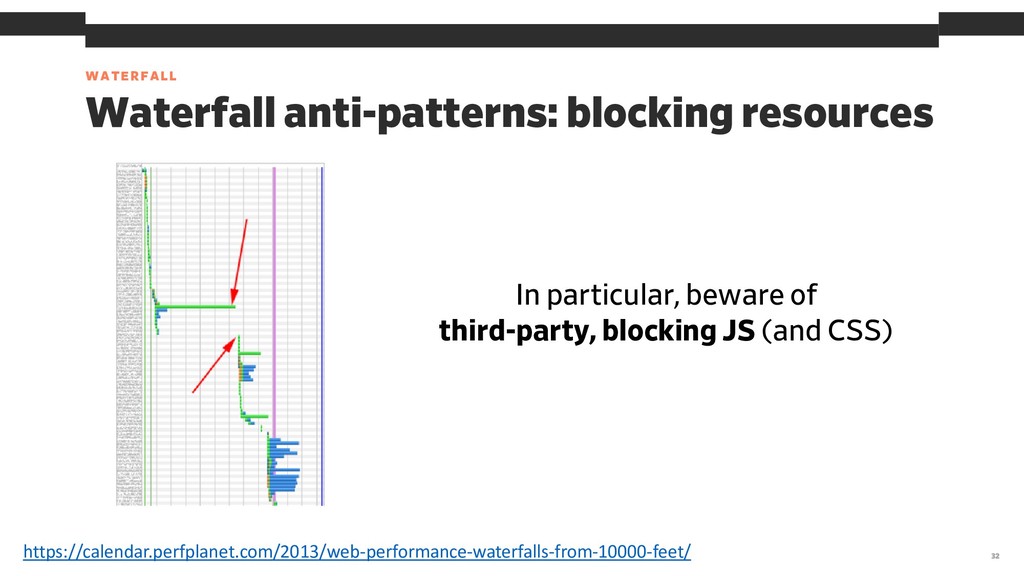
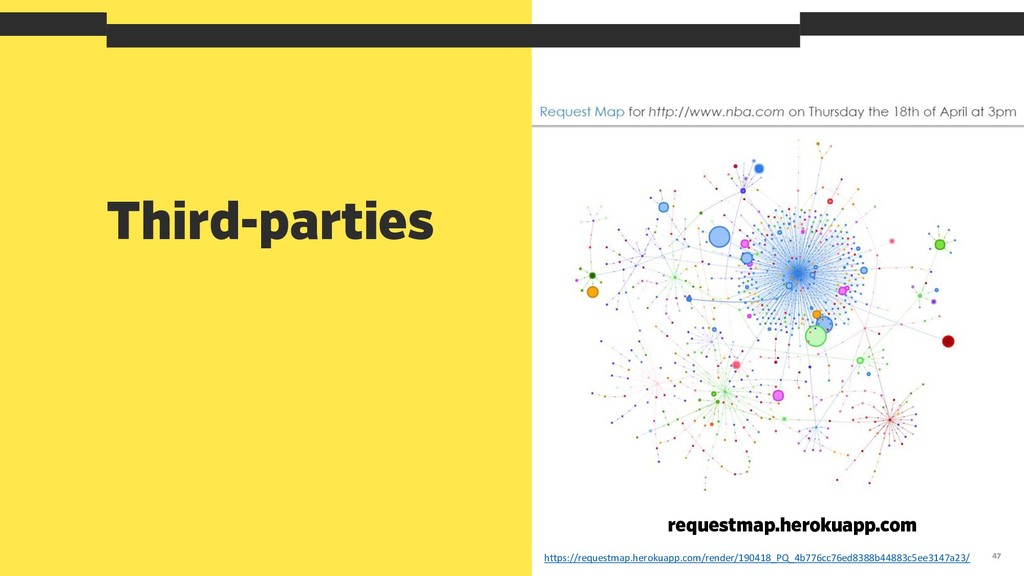
Prefer async third parties than synchronous ones; load them after `load` event • Analytics, A/B testing providers, libraries, social widgets… • Calculate the risk. Does a third party provide SLA or historical uptime data? • Good sign if the lib is hosted by a reputable CDN provider • Self-host (if possible) when unsure • Perhaps have a server-side switch to start serving your own copy instead of 3rd-party • You don’t want a social widget to take down your website • When dealing with social widgets: perhaps load on demand (also good for user privacy)
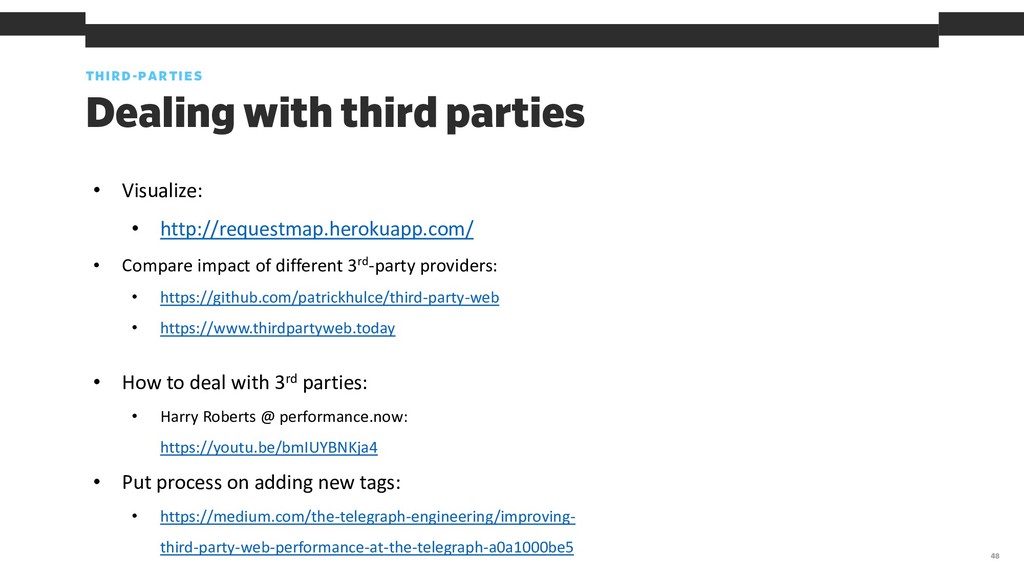
• Compare impact of different 3rd-party providers: • https://github.com/patrickhulce/third-party-web • https://www.thirdpartyweb.today • How to deal with 3rd parties: • Harry Roberts @ performance.now: https://youtu.be/bmIUYBNKja4 • Put process on adding new tags: • https://medium.com/the-telegraph-engineering/improving- third-party-web-performance-at-the-telegraph-a0a1000be5
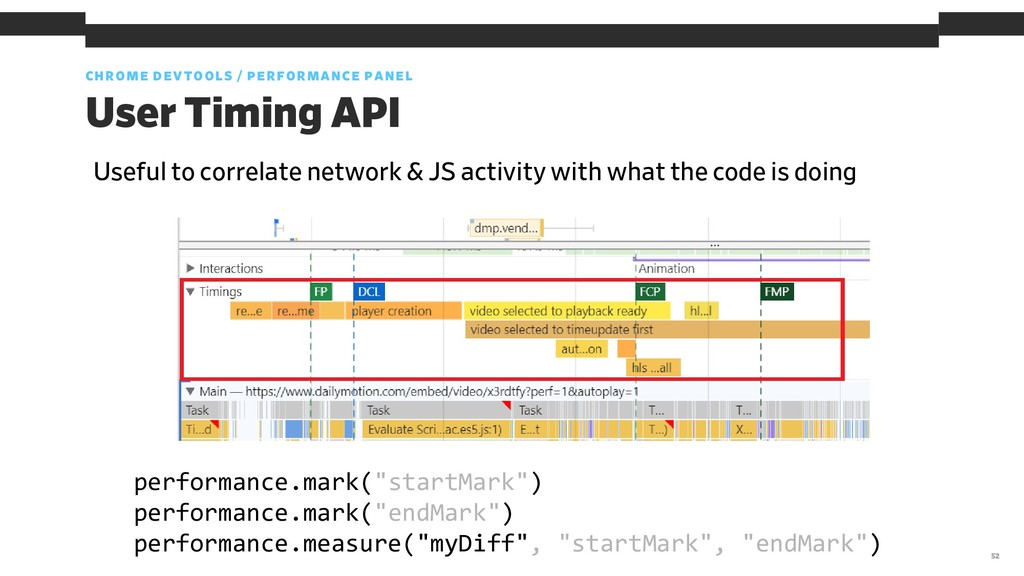
performance.mark("endMark") performance.measure("myDiff", "startMark", "endMark") Useful to correlate network & JS activity with what the code is doing
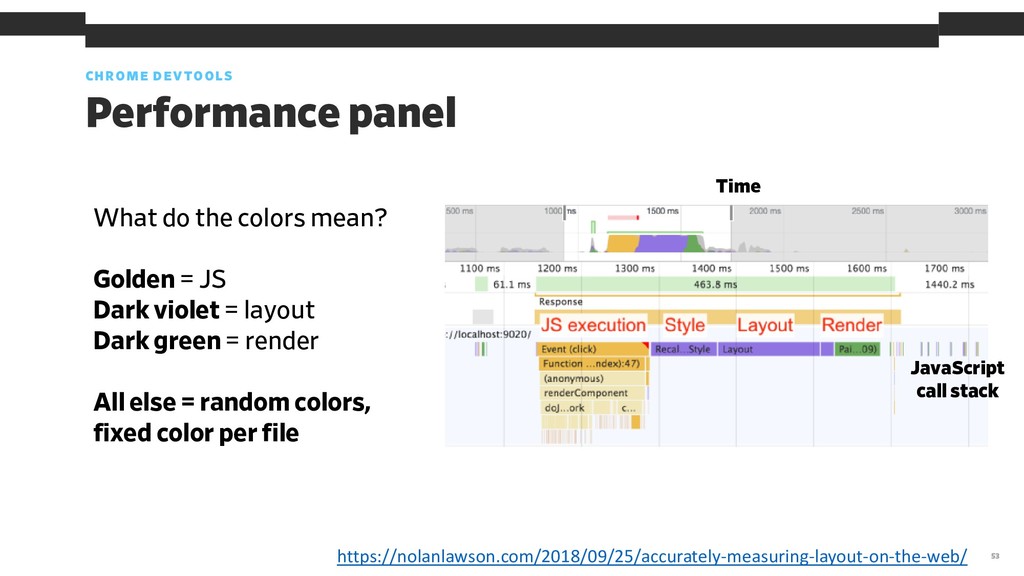
Golden = JS Dark violet = layout Dark green = render All else = random colors, fixed color per file https://nolanlawson.com/2018/09/25/accurately-measuring-layout-on-the-web/ Time JavaScript call stack
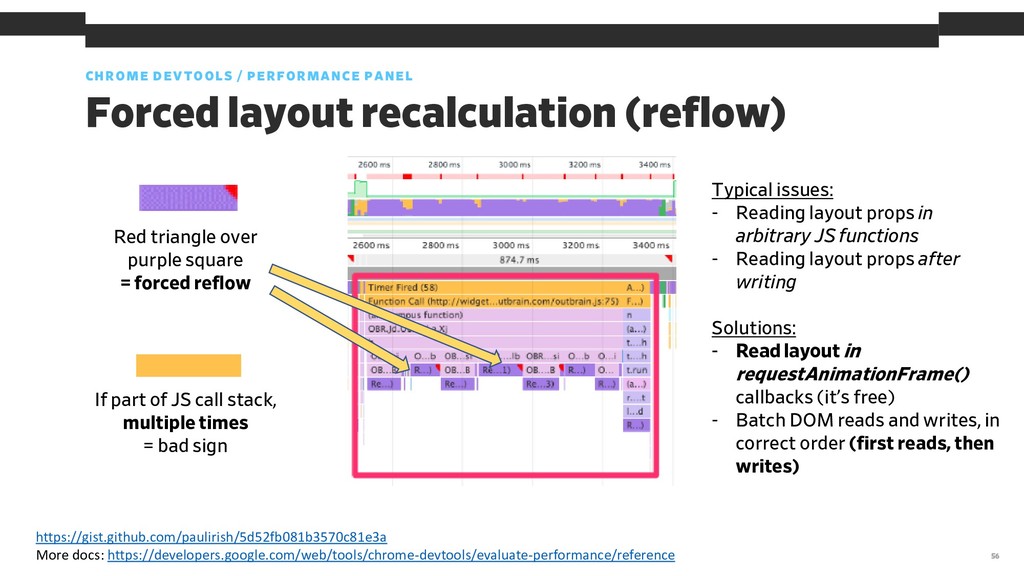
https://gist.github.com/paulirish/5d52fb081b3570c81e3a More docs: https://developers.google.com/web/tools/chrome-devtools/evaluate-performance/reference If part of JS call stack, multiple times = bad sign Red triangle over purple square = forced reflow Typical issues: - Reading layout props in arbitrary JS functions - Reading layout props after writing Solutions: - Read layout in requestAnimationFrame() callbacks (it’s free) - Batch DOM reads and writes, in correct order (first reads, then writes)
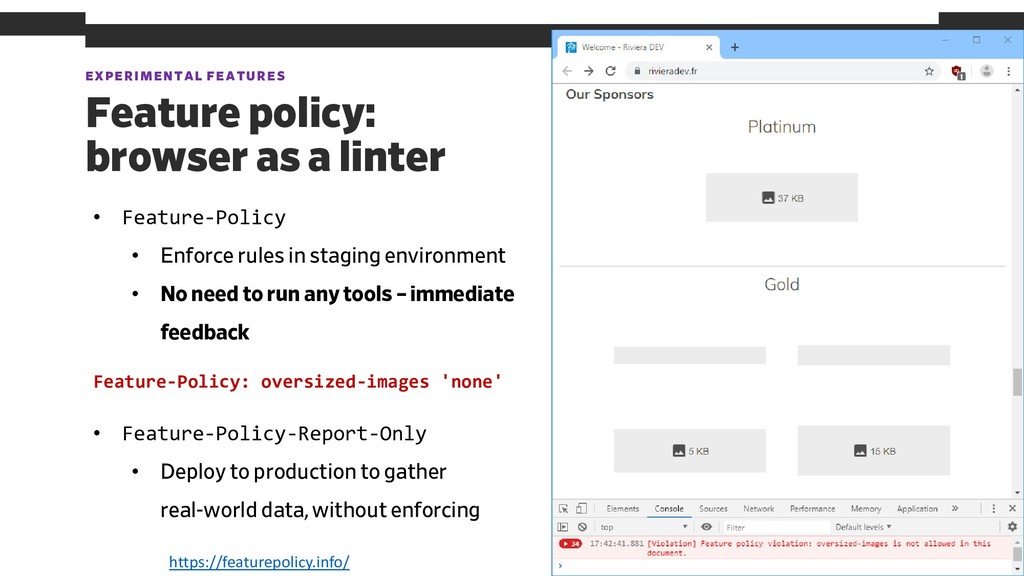
Feature-Policy • Enforce rules in staging environment • No need to run any tools – immediate feedback Feature-Policy: oversized-images 'none' • Feature-Policy-Report-Only • Deploy to production to gather real-world data, without enforcing https://featurepolicy.info/
https://www.webpagetest.org/ Advanced throttling options Throttling also possible in Fiddler, although: • no dedicated UI (via FiddlerScript) • less sophisticated
Some proxies downgrade HTTP/2 to HTTP/1.1 which may notably affect how resources are loaded: • Fiddler • BrowserStack • … Be careful when benchmarking / comparing. ⚠
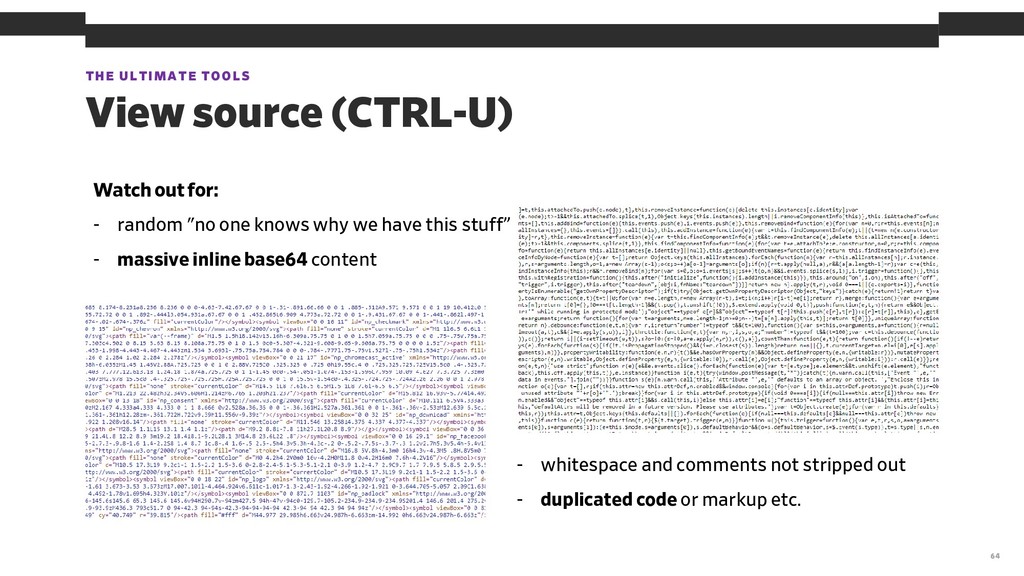
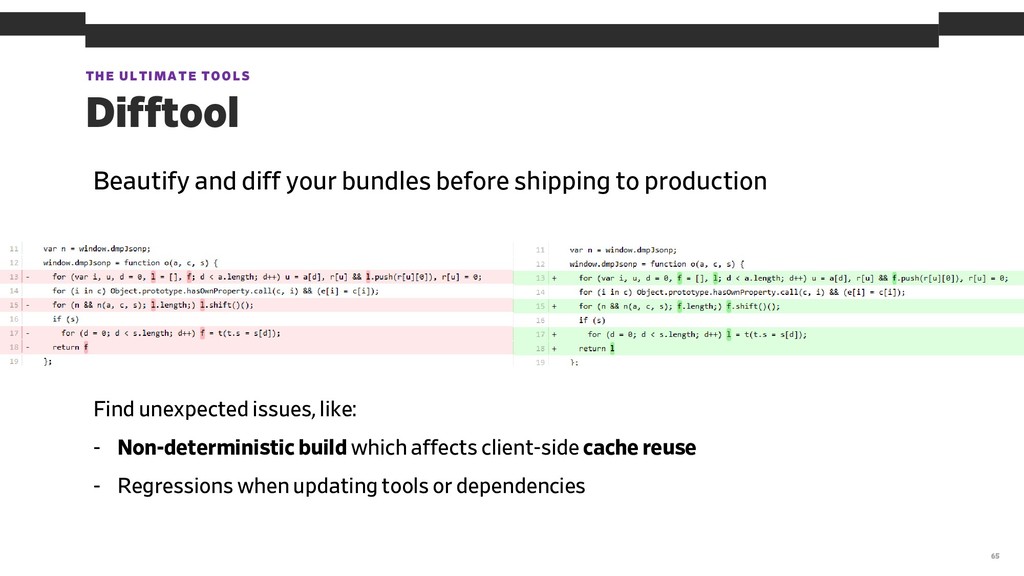
- random "no one knows why we have this stuff” - massive inline base64 content - whitespace and comments not stripped out - duplicated code or markup etc.
before shipping to production Find unexpected issues, like: - Non-deterministic build which affects client-side cache reuse - Regressions when updating tools or dependencies
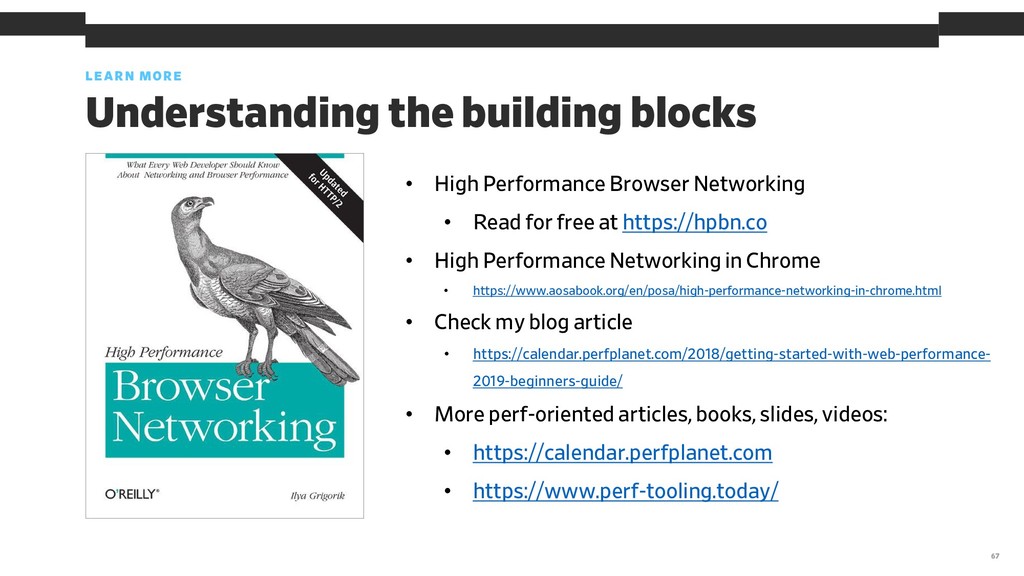
Browser Networking • Read for free at https://hpbn.co • High Performance Networking in Chrome • https://www.aosabook.org/en/posa/high-performance-networking-in-chrome.html • Check my blog article • https://calendar.perfplanet.com/2018/getting-started-with-web-performance- 2019-beginners-guide/ • More perf-oriented articles, books, slides, videos: • https://calendar.perfplanet.com • https://www.perf-tooling.today/
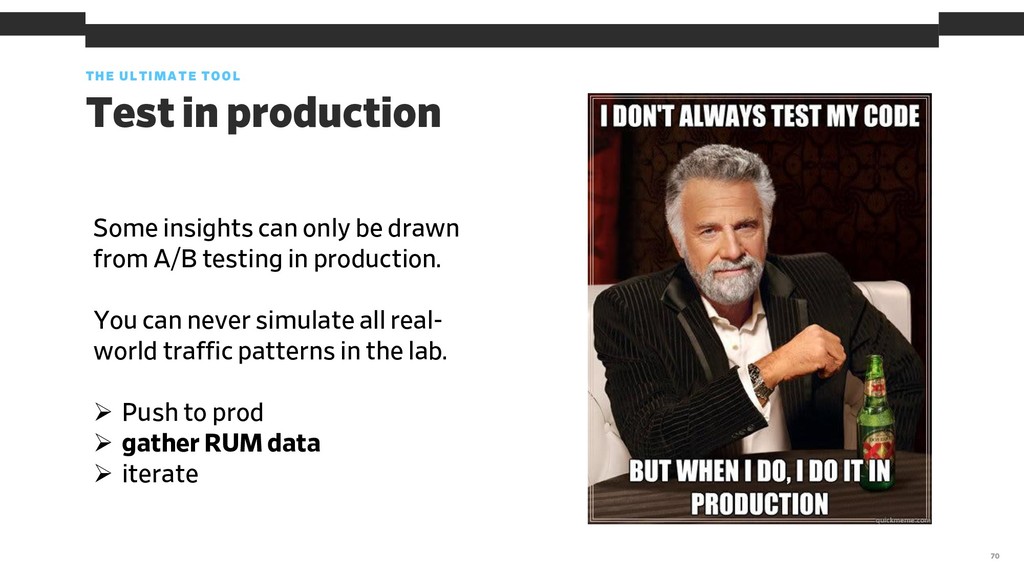
only be drawn from A/B testing in production. You can never simulate all real- world traffic patterns in the lab. ➢ Push to prod ➢ gather RUM data ➢ iterate
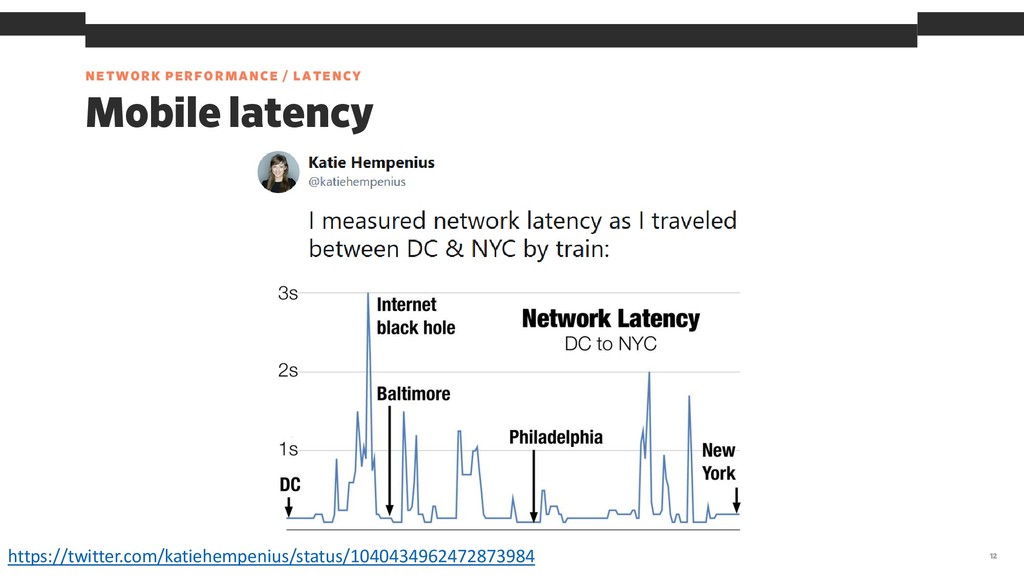
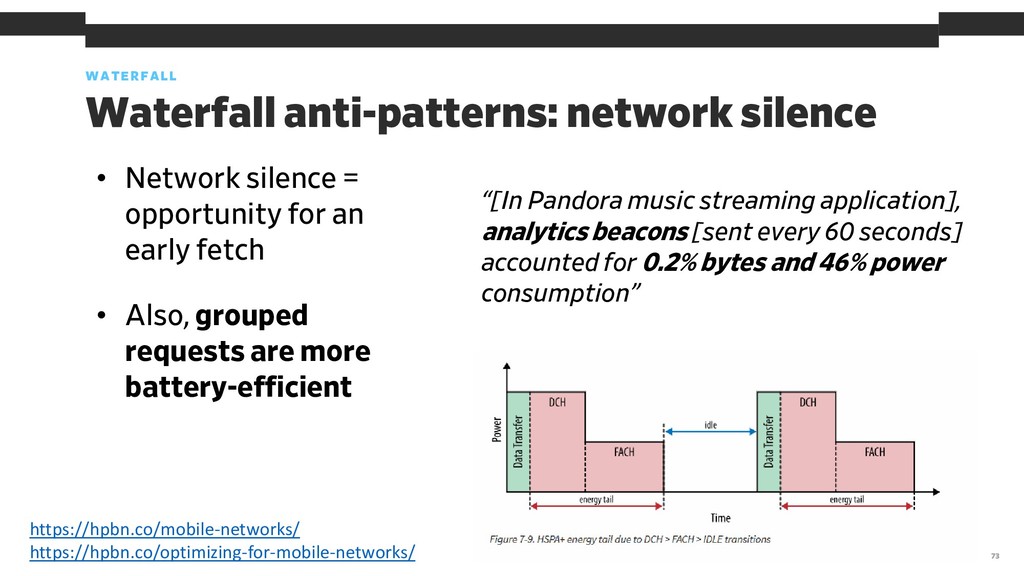
opportunity for an early fetch https://hpbn.co/mobile-networks/ https://hpbn.co/optimizing-for-mobile-networks/ “[In Pandora music streaming application], analytics beacons [sent every 60 seconds] accounted for 0.2% bytes and 46% power consumption” • Also, grouped requests are more battery-efficient
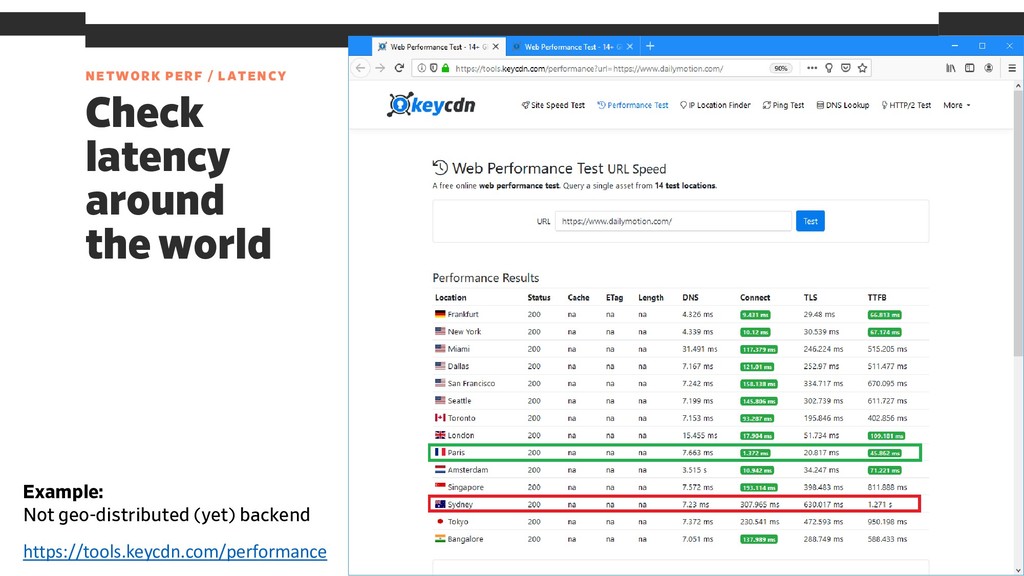
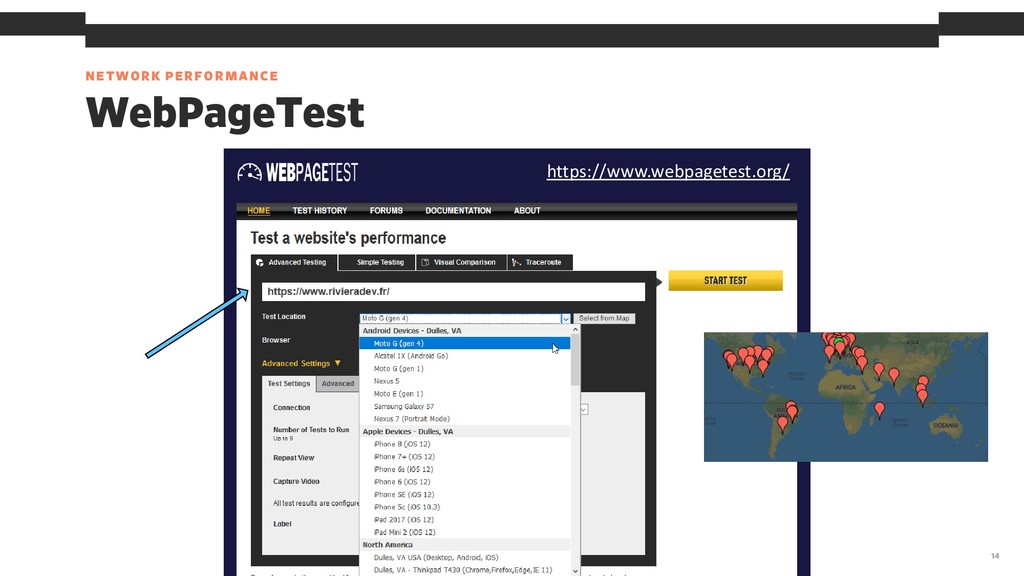
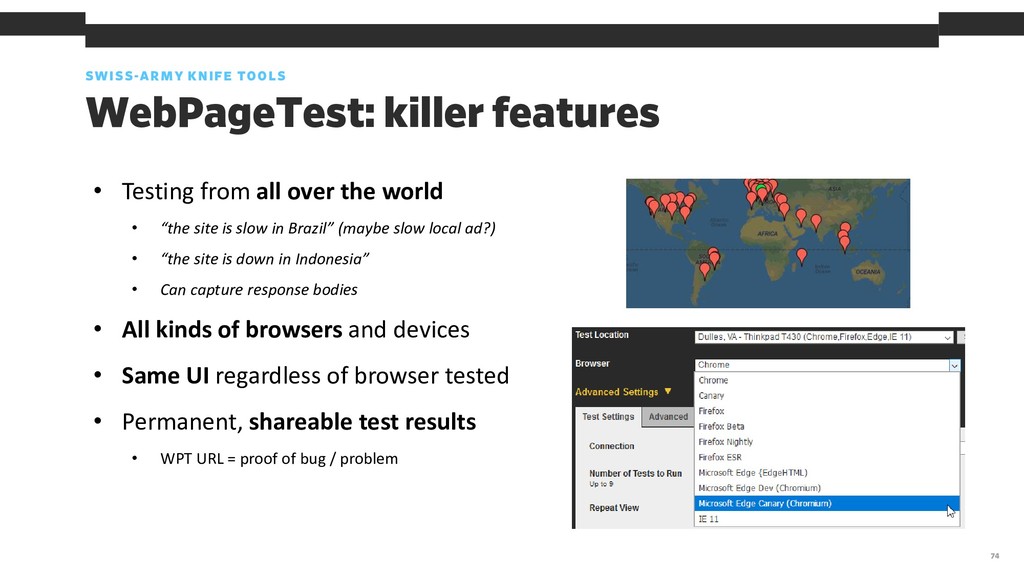
all over the world • “the site is slow in Brazil” (maybe slow local ad?) • “the site is down in Indonesia” • Can capture response bodies • All kinds of browsers and devices • Same UI regardless of browser tested • Permanent, shareable test results • WPT URL = proof of bug / problem
gather lots of low-level data • tcpdump, advanced HTTP/2 info, Chrome timeline, Chrome tracing data… • Data can be exported in HAR format • Automation possible • REST API, npm package (https://www.npmjs.com/package/webpagetest) • Free, open source, not for profit (PHP, https://github.com/WPO-Foundation/webpagetest)
test only public websites (production) • Although you can set up a private instance • Small differences in detail level between browsers • Most notably: some data can’t be gathered on iOS
via URL param • CPU throttling via mobile emulation • Custom waterfall URL params: • &width=2000 (width of waterfall in pixels) • &max=30 (width of waterfall in seconds) • &ut=1 (show User Timing marks) • … • Several more “hidden features” via URL params (check up docs): high quality images, experimental timings etc. • Just click around any links on WebPageTest.org to discover features • See also: • https://deanhume.com/ten-things-you-didnt-know- about-webpagetest-org/ (https://github.com/WPO-Foundation/webpagetest/blob/master/www/settings/mobile_devices.ini)
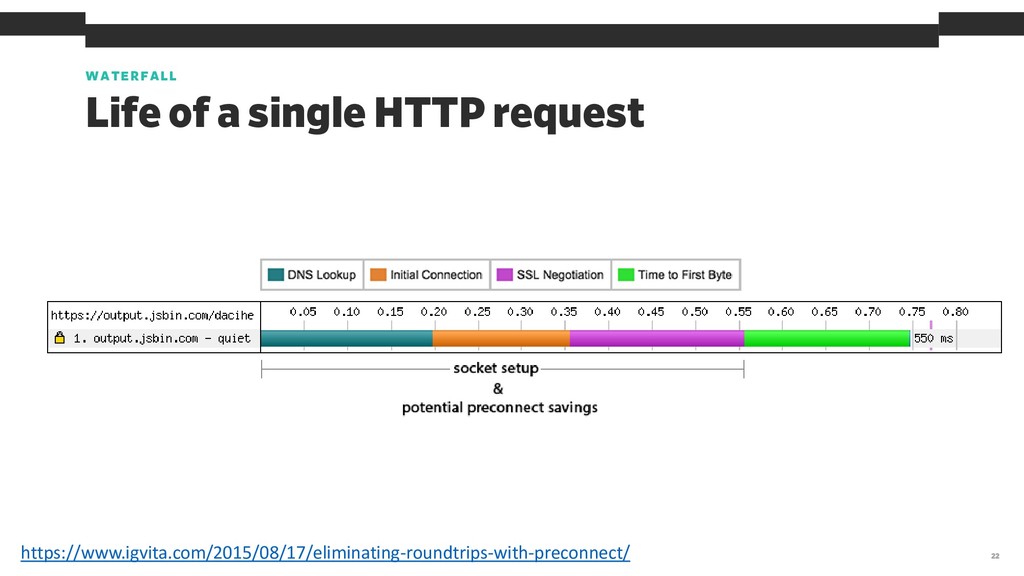
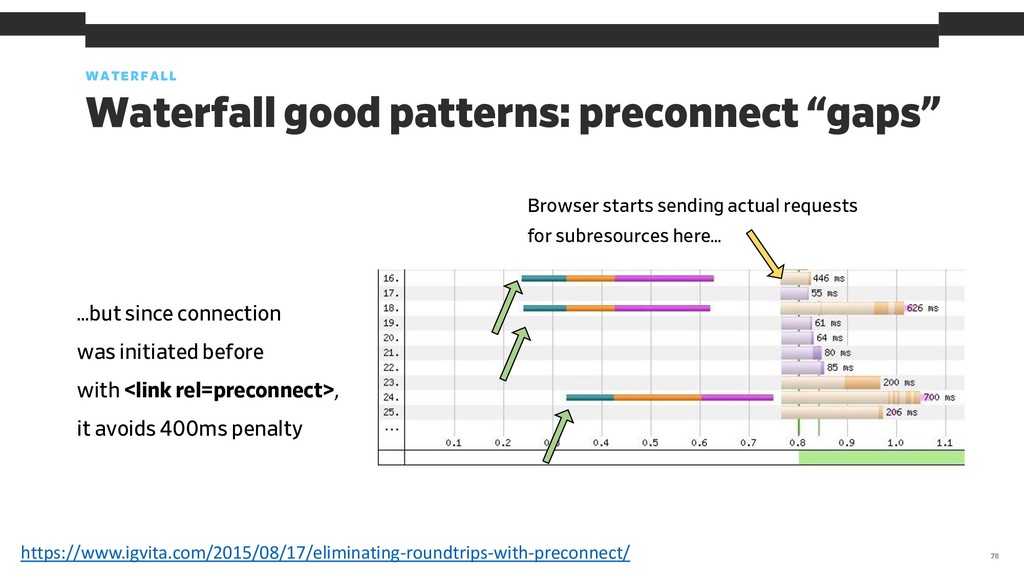
was initiated before with <link rel=preconnect>, it avoids 400ms penalty Browser starts sending actual requests for subresources here… https://www.igvita.com/2015/08/17/eliminating-roundtrips-with-preconnect/
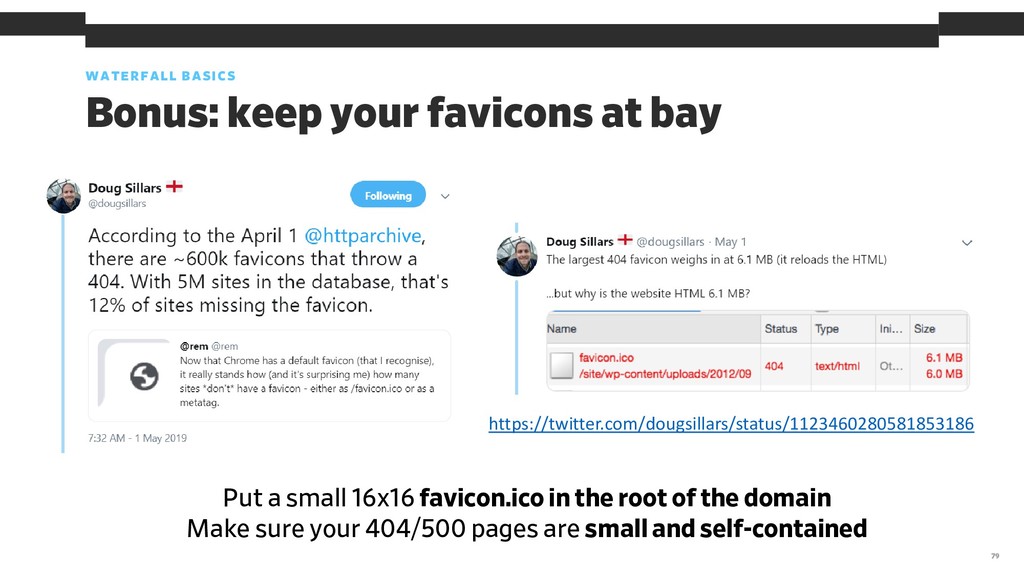
a small 16x16 favicon.ico in the root of the domain Make sure your 404/500 pages are small and self-contained https://twitter.com/dougsillars/status/1123460280581853186
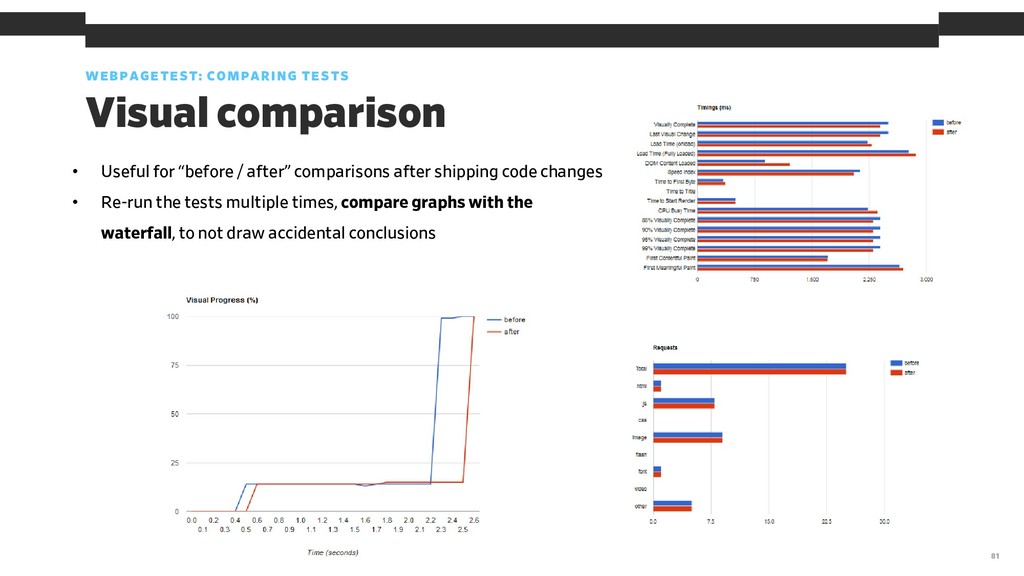
/ after” comparisons after shipping code changes • Re-run the tests multiple times, compare graphs with the waterfall, to not draw accidental conclusions
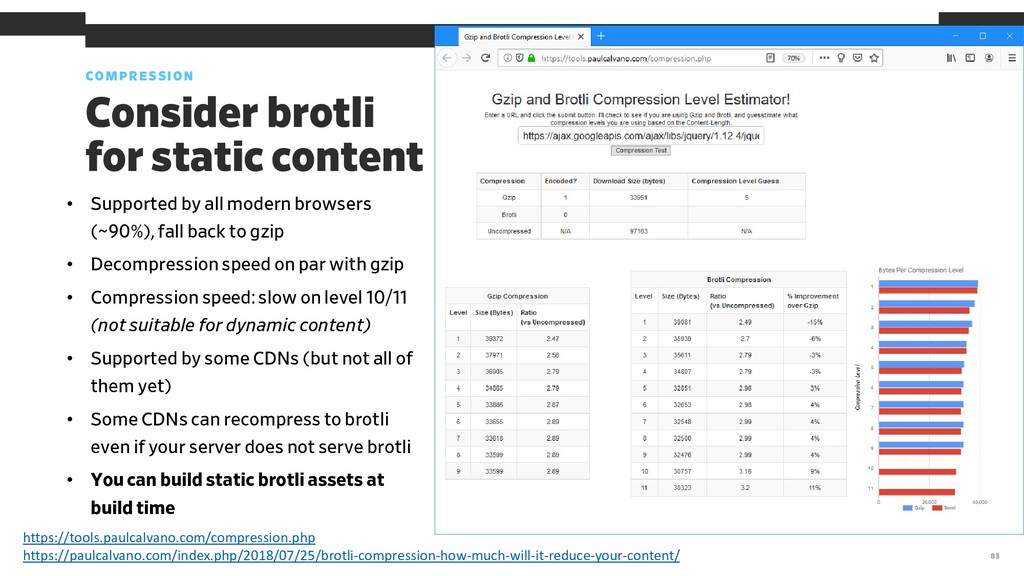
all modern browsers (~90%), fall back to gzip • Decompression speed on par with gzip • Compression speed: slow on level 10/11 (not suitable for dynamic content) • Supported by some CDNs (but not all of them yet) • Some CDNs can recompress to brotli even if your server does not serve brotli • You can build static brotli assets at build time https://tools.paulcalvano.com/compression.php https://paulcalvano.com/index.php/2018/07/25/brotli-compression-how-much-will-it-reduce-your-content/
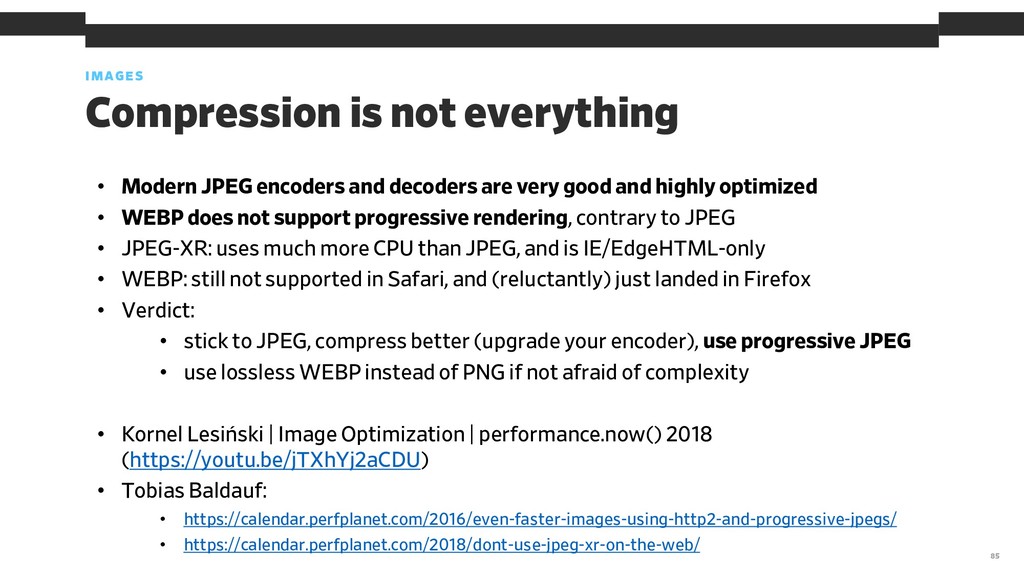
and decoders are very good and highly optimized • WEBP does not support progressive rendering, contrary to JPEG • JPEG-XR: uses much more CPU than JPEG, and is IE/EdgeHTML-only • WEBP: still not supported in Safari, and (reluctantly) just landed in Firefox • Verdict: • stick to JPEG, compress better (upgrade your encoder), use progressive JPEG • use lossless WEBP instead of PNG if not afraid of complexity • Kornel Lesiński | Image Optimization | performance.now() 2018 (https://youtu.be/jTXhYj2aCDU) • Tobias Baldauf: • https://calendar.perfplanet.com/2016/even-faster-images-using-http2-and-progressive-jpegs/ • https://calendar.perfplanet.com/2018/dont-use-jpeg-xr-on-the-web/
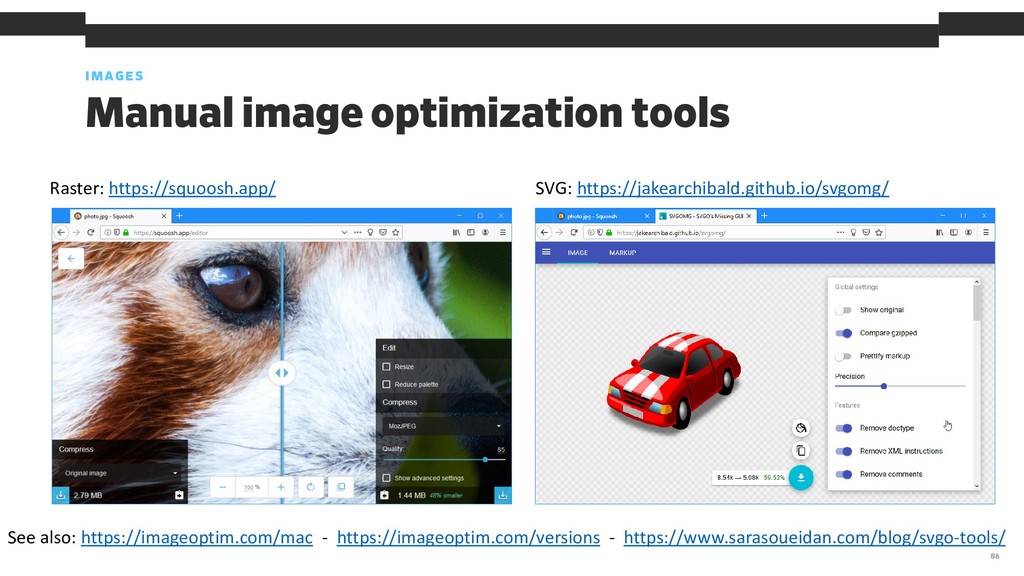
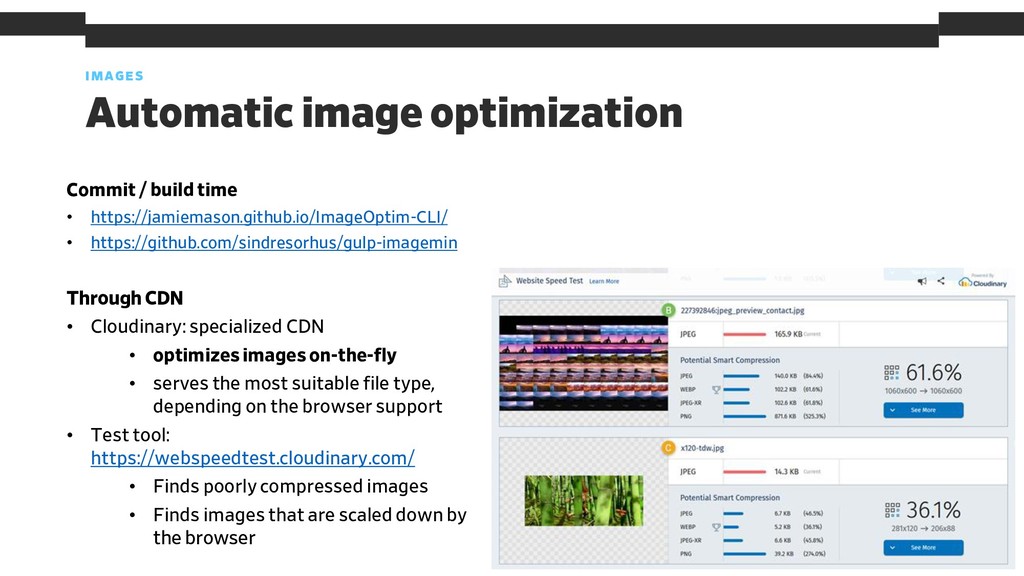
https://jamiemason.github.io/ImageOptim-CLI/ • https://github.com/sindresorhus/gulp-imagemin Through CDN • Cloudinary: specialized CDN • optimizes images on-the-fly • serves the most suitable file type, depending on the browser support • Test tool: https://webspeedtest.cloudinary.com/ • Finds poorly compressed images • Finds images that are scaled down by the browser
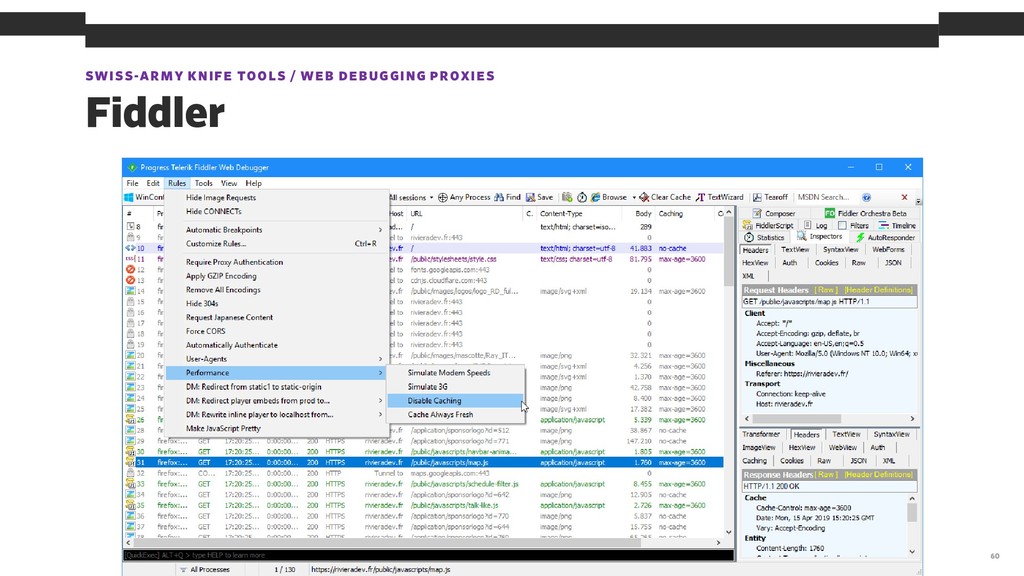
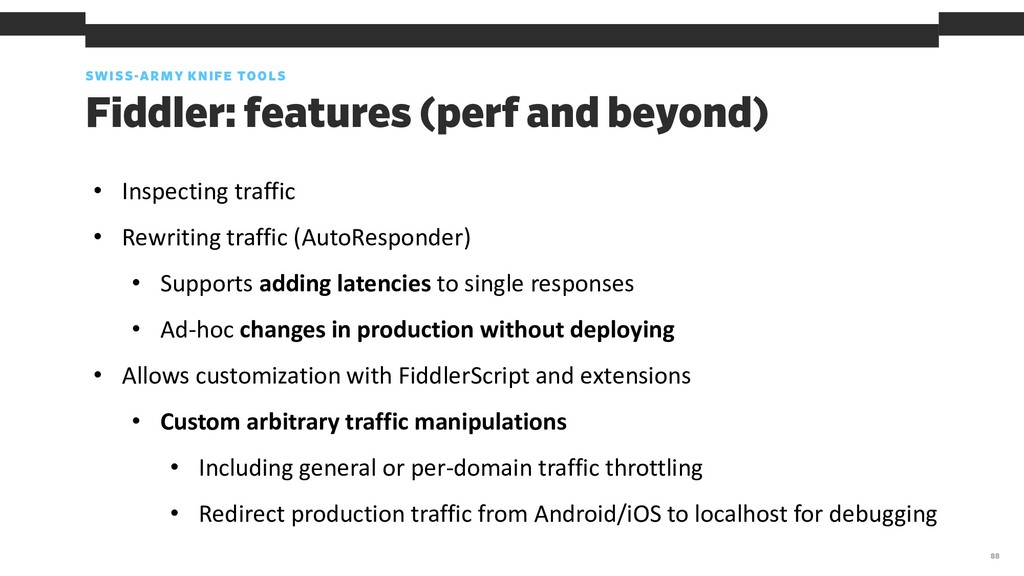
Inspecting traffic • Rewriting traffic (AutoResponder) • Supports adding latencies to single responses • Ad-hoc changes in production without deploying • Allows customization with FiddlerScript and extensions • Custom arbitrary traffic manipulations • Including general or per-domain traffic throttling • Redirect production traffic from Android/iOS to localhost for debugging
traffic from all web browsers with same UI • Configure once, have same behavior in all clients • Allows being configured as a proxy for external devices (Android, iOS) • Import/export sessions (including HAR format) • Including importing sessions into AutoResponder • Ask a user for HAR/SAZ file (or get it from WebPageTest), reproduce exact experience on your machine (except dynamic JS-generated requests)
Charles Proxy for a cross-platform alternative • Downgrades traffic to HTTP/1.1 • Keep in mind when enabled, as this can lead to false discoveries • Traffic throttling is easier with Charles • Like each MITM proxy, requires some setup for HTTPS decryption • Particularly onerous on recent iOS, Android and a bit in desktop Firefox • FiddlerScript is JScript.NET(kind of like a mix of JavaScript and C#) and not modular
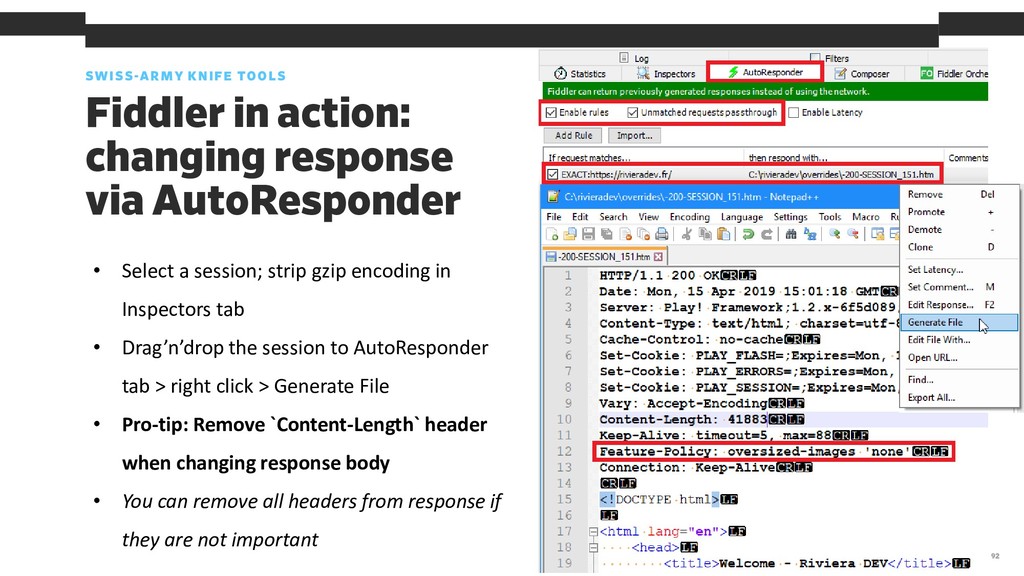
AutoResponder • Select a session; strip gzip encoding in Inspectors tab • Drag’n’drop the session to AutoResponder tab > right click > Generate File • Pro-tip: Remove `Content-Length` header when changing response body • You can remove all headers from response if they are not important
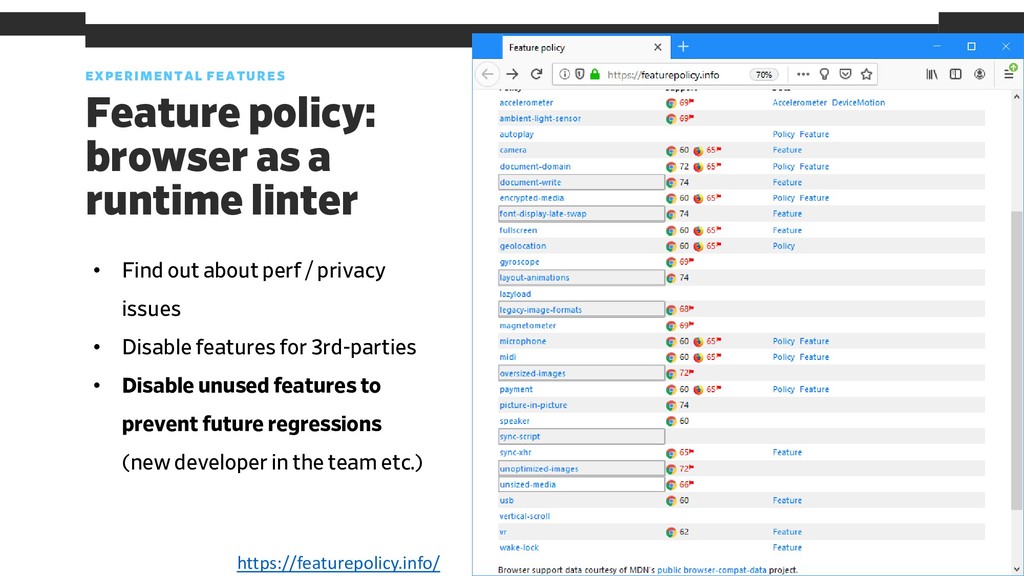
• Find out about perf / privacy issues • Disable features for 3rd-parties • Disable unused features to prevent future regressions (new developer in the team etc.) https://featurepolicy.info/
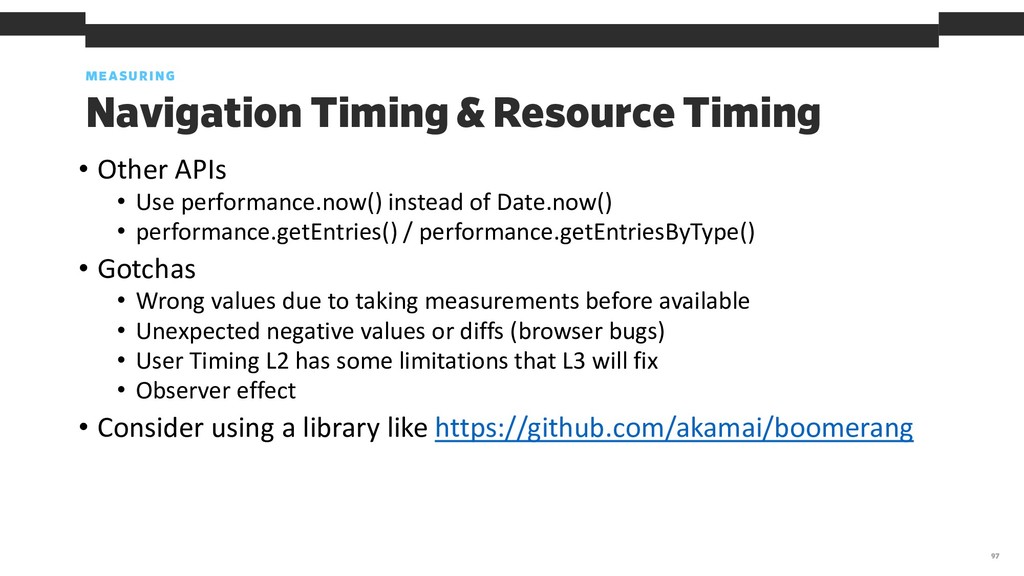
• Use performance.now() instead of Date.now() • performance.getEntries() / performance.getEntriesByType() • Gotchas • Wrong values due to taking measurements before available • Unexpected negative values or diffs (browser bugs) • User Timing L2 has some limitations that L3 will fix • Observer effect • Consider using a library like https://github.com/akamai/boomerang
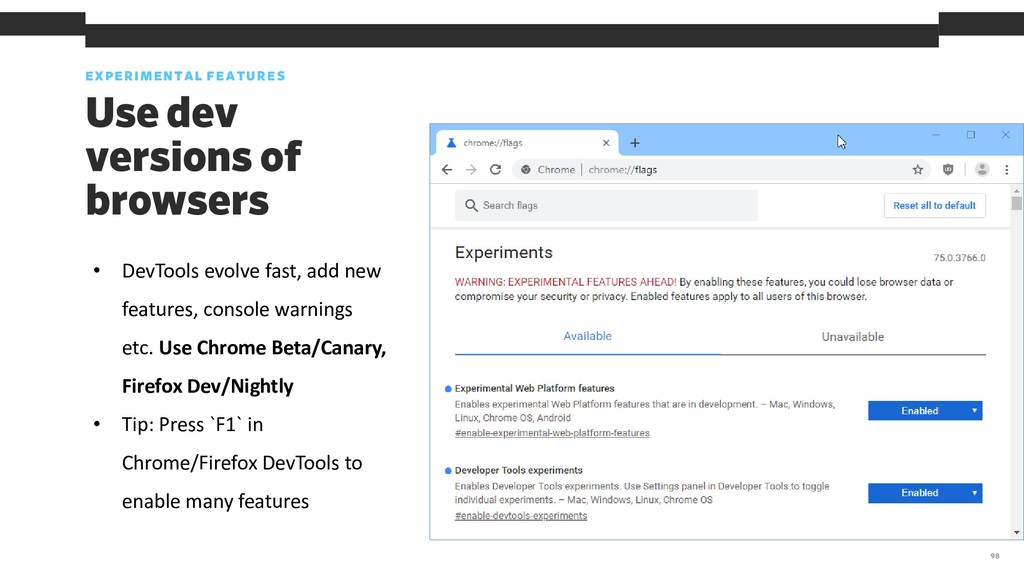
evolve fast, add new features, console warnings etc. Use Chrome Beta/Canary, Firefox Dev/Nightly • Tip: Press `F1` in Chrome/Firefox DevTools to enable many features
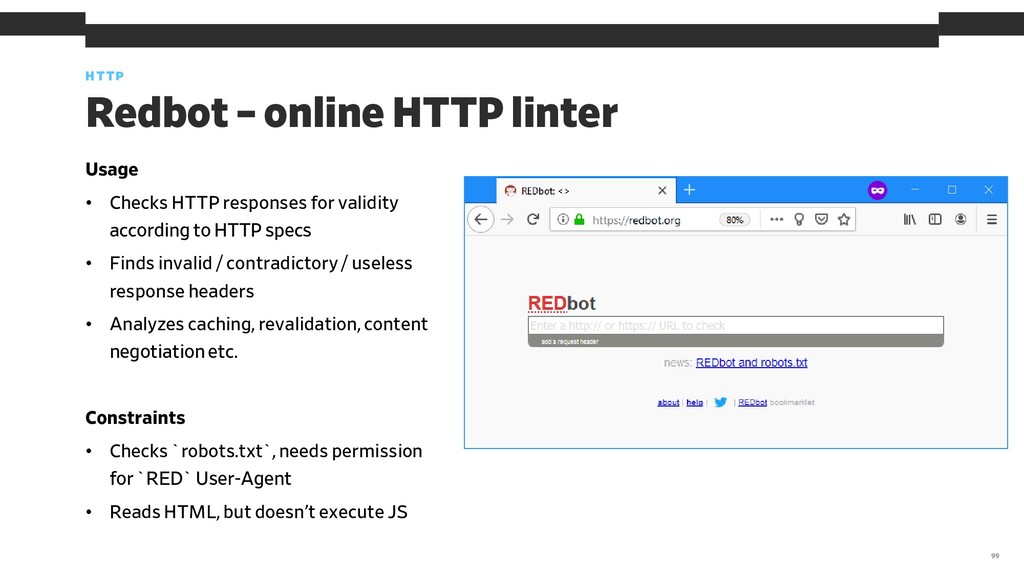
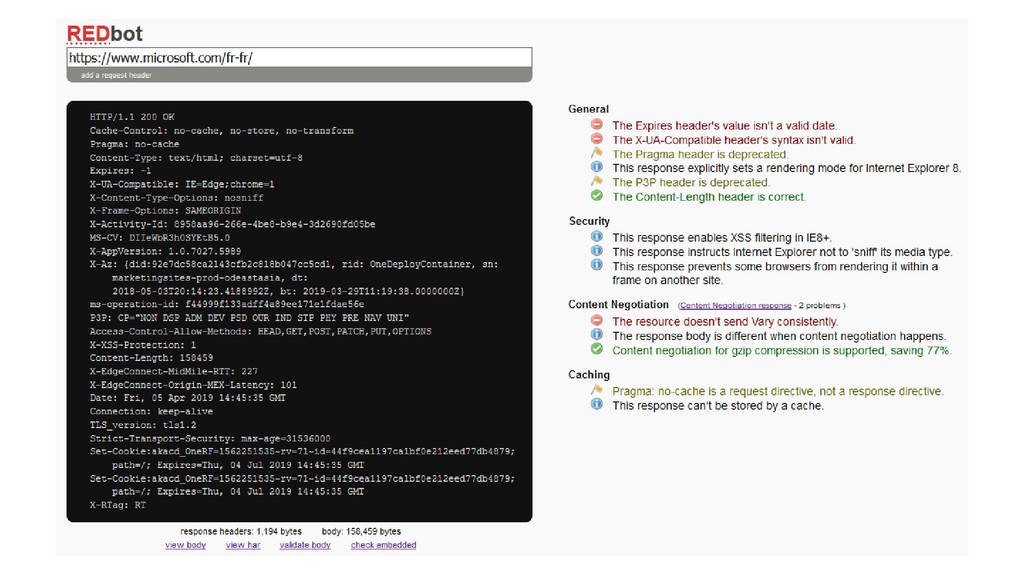
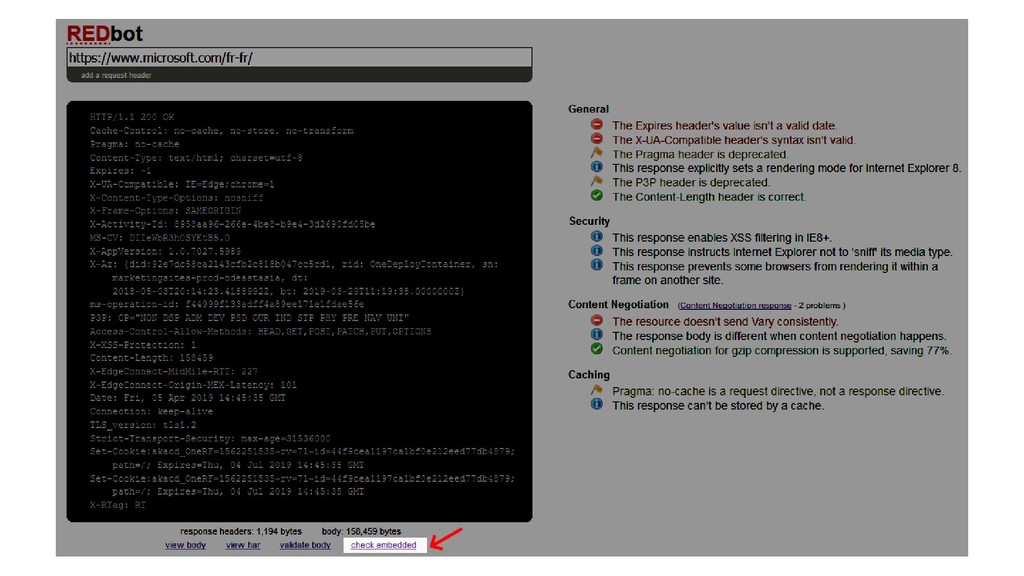
headers have non-intuitive syntax. Easy to make a typo, or forget to escape a special character • Some response headers were useful a decade ago or two, but now are implied or ignored and just waste bandwidth • Contradictory rules make debugging much harder Redbot – problems it solves HTTP 104
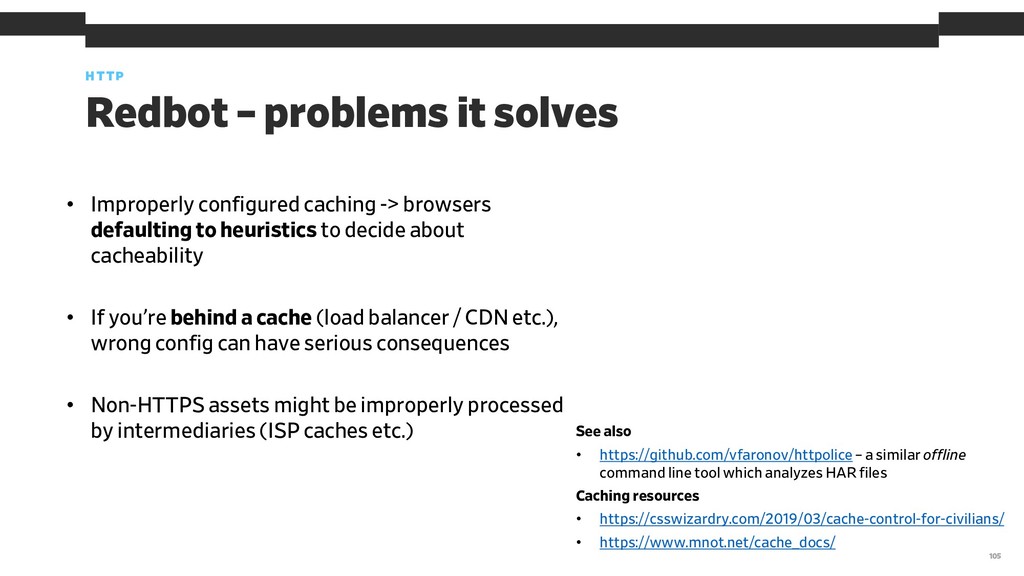
decide about cacheability • If you’re behind a cache (load balancer / CDN etc.), wrong config can have serious consequences • Non-HTTPS assets might be improperly processed by intermediaries (ISP caches etc.) Redbot – problems it solves HTTP 105 See also • https://github.com/vfaronov/httpolice – a similar offline command line tool which analyzes HAR files Caching resources • https://csswizardry.com/2019/03/cache-control-for-civilians/ • https://www.mnot.net/cache_docs/
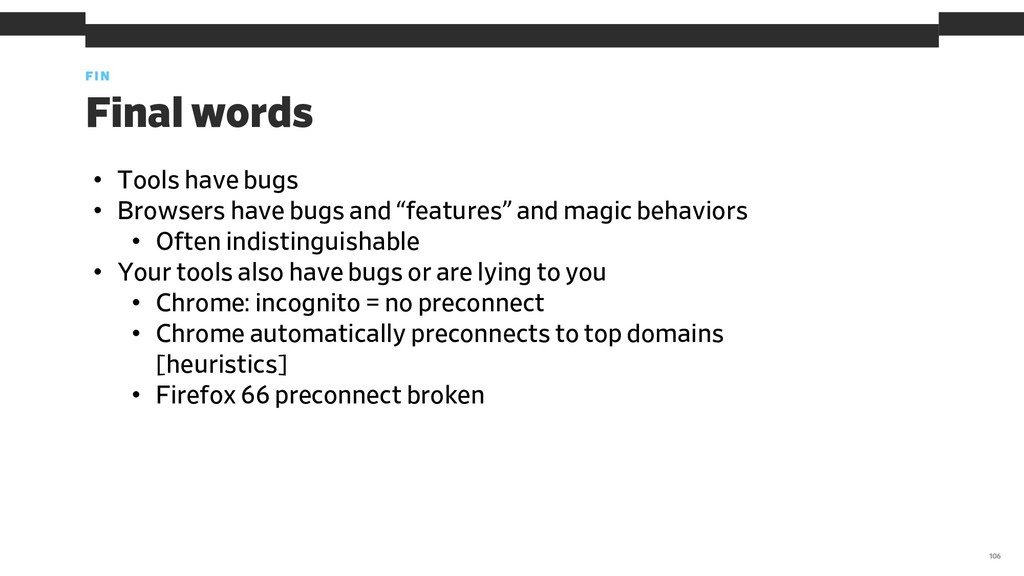
have bugs and “features” and magic behaviors • Often indistinguishable • Your tools also have bugs or are lying to you • Chrome: incognito = no preconnect • Chrome automatically preconnects to top domains [heuristics] • Firefox 66 preconnect broken
![MEASURING 95 Navigation Timing & Resource Timing https://www.w3.org/TR/navigation-timing-2/ performance.getEntriesByType('navigation')[0]](https://files.speakerdeck.com/presentations/d6dc602a477a4fb082a7f694b8b23771/slide_94.jpg)