Upgrade to Pro — share decks privately, control downloads, hide ads and more …

GIS In The Rockies Keynote: How to Remain Relevant in the Age of Change

James Fee
October 09, 2013

GIS In The Rockies Keynote: How to Remain Relevant in the Age of Change

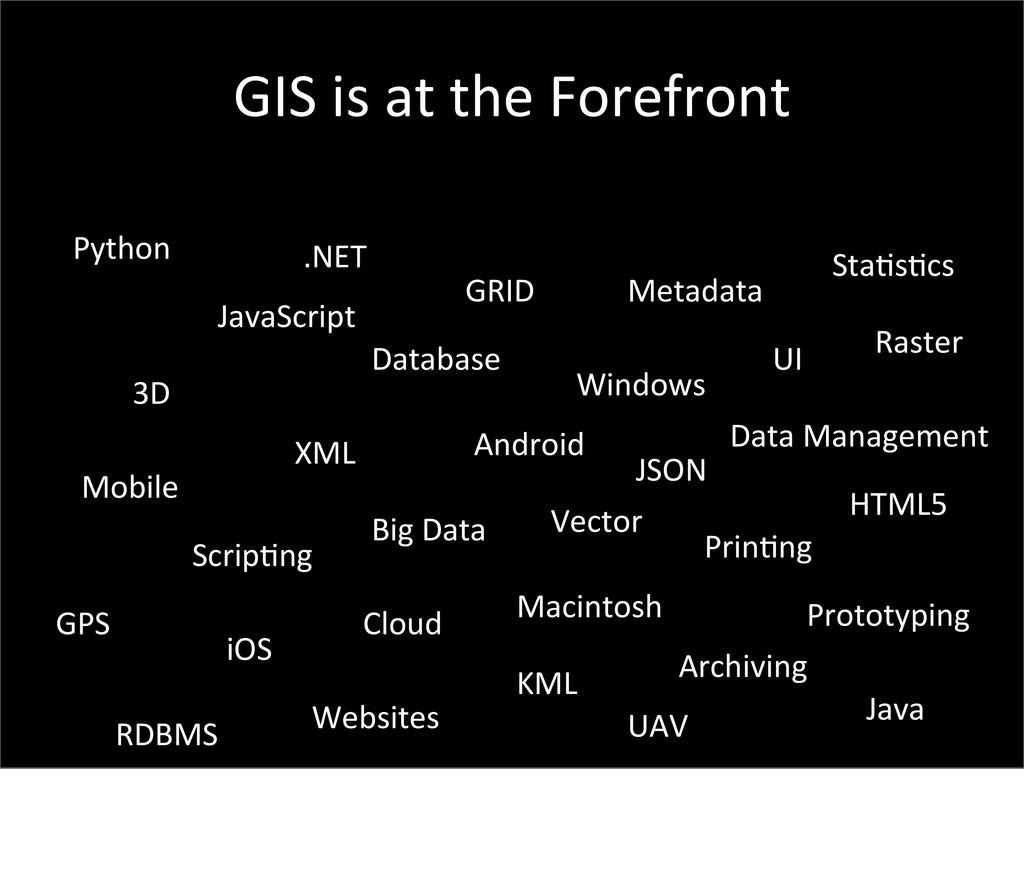
Technology moves fast and when you have your head down doing your job, it is easy to miss where the spatial industry is headed. But you don't have to stay focused on Twitter all day to know how to keep your skills relevant. There are a couple technologies that GIS and Mapping use that will keep you on top of today's technology trends and make sure you are completely relevant in today's workforce. James will go over some amazingly simple ways to make sure you don't get left behind and give you the tools to be successful in any GIS job.

James Fee

October 09, 2013
Tweet

More Decks by James Fee

Other Decks in Technology

Transcript

  1. How  to  Remain  Relevant  in  the  Age  of  Change
    or  
    What  GIS  Pros  Can  Do  to  
    Keep  Their  Skills  in  Demand
    Stormtroopers  On  A  Wire  by  Pedro  Vezini  hEp://flic.kr/p/8RRLk5

    View Slide

  2. • 19  year  GIS  veteran
    • Started  own  consul5ng  
    company  in  2013
    • Blogs  at  spa5allyadjusted.com
    • Doesn’t  own  a  GPS
    • Has  a  working  
    SPARCsta5on  20
    A  LiEle  
    About  Me

    View Slide

  3. The  Future…
    isn’t  always
    what  you  expect

    View Slide

  4. Photo  by  drmacro  -­‐  hEp://flic.kr/p/83i2aa
    I  loved  to  look  at  maps  at  a  young  age.    These  AAA  TripTik  maps  were  par5cularly  awesome  in  that  they  routed  you  to  your  des5na5on.

    View Slide

  5. Photo  by  sylvar  -­‐  hEp://flic.kr/p/o8EML
    Efficiency  it  was  not,  these  things  were  put  together  by  hand  and  you’d  best  hope  they  didn’t  skip  a  page!

    View Slide

  6. Photo  by  Tambako  the  Jaguar  -­‐  hEp://flic.kr/p/81nfaV
    Like  most  GIS  people  I  enjoyed  Risk,  nothing  like  using  a  map  as  a  board.    In  face  we  usually  dumped  the  default  Risk  board  and  used  an  atlas  
    for  real  world  domina5on.

    View Slide

  7. Photo  by  larskflem  -­‐  hEp://flic.kr/p/7Kr4J
    My  favorite  pas5me?    Reading  an  atlas.    It  was  by  my  bed  and  I  leafed  through  it  every  night.    I  think  I  looked  at  every  label  on  every  map  over  
    and  over  again.    Honestly  these  books  are  a  lost  art.

    View Slide

  8. View Slide

  9. I  took  to  programming  at  an  early  age  too.    Logo  was  an  awesome  way  to  get  introduced  to  programming  a  computer.

    View Slide

  10. But  quickly  I  outgrew  Logo  and  even  BASIC  and  looked  to  Pascal.    Once  I  determined  you  didn’t  get  a  Porsche  for  using  it,  I  moved  on.

    View Slide

  11. I  think  the  thing  that  really  caught  me  was  HyperCard.    It  used  HyperTalk  to  control  user  ac5ons  and  was  similar  to  Pascal.    It  was  probably  the  
    most  popular  hypermedia  system  before  the  internet.

    View Slide

  12. I  created  applica5ons  that  created  a  front  end  to  a  database.    

    View Slide

  13. The  Modern
    Waldseemüller
    I  had  vision  of  being  a  modern  Waldseemuller….

    View Slide

  14. Photo  by  Manitoba  Historical  Maps  -­‐  hEp://flic.kr/p/4jPTyW
    Oblique  view  of  Winnipeg,  awesome  stuff.

    View Slide

  15. Photo  by  noaha  -­‐  hEp://flic.kr/p/CkruJ
    Alas,  I  could  only  draw  scribbbles.

    View Slide

  16. I  turned  to  computers  to  give  me  more  fine  grained  control  that  AutoCAD  couldn’t  at  the  5me.  

    View Slide

  17. I  started  to  do  amazing  computer  cartography  such  as  this.    Yea  it’s  blank,  my  work  is  stuck  on  this  old  SyQuest  Media…

    View Slide

  18. I  also  dabbled  in  the  web  back  when  you  could  almost  throw  anything  up  and  get  visits.

    View Slide

  19. I  can’t  find  a  copy  of  an  early  page  of  mine  but  I  like  to  think  it  included  an  awesome  background.

    View Slide

  20. Arc/INFO
    Then  I  discovered  arc  

    View Slide

  21. View Slide

  22. View Slide

  23. View Slide

  24. neon  takeaway  by  skipratmedia  hEp://flic.kr/p/uUuKX

    View Slide

  25. View Slide

  26. always
    be
    learning
    A
    B
    L

    View Slide

  27. View Slide

  28. Change  is  constant!
    But  one  thing  is  sure,  always  embrace  it…

    View Slide

  29. What  is  GIS?
    Who  Cares?
    GIS is hard to define - GISP Example
    Spend less time worrying about what GIS is and more doing GIS

    View Slide

  30. What  are  GIS  Professionals?
    Programmers!
    GIS professionals are programmers!

    View Slide

  31. Say
    Wut?

    View Slide

  32. Programmer  
    /=  
    Developer
    Photo  by  Joachim  S.  Müller  -­‐  hEp://flic.kr/p/egrei2
    A programmer is not a developer
    Programmer writes code
    Developer builds software applications

    View Slide

  33. My mom was a programmer in the 60’s (that isn’t her).
    She told computers how to manipulate data from hospitals for
    insurance purposes.

    View Slide

  34. James’  Definibon  of  a  GIS  Professional
    Someone  digitally  creates  and  
    "manipulates"  spabal  areas  that  may  
    be  jurisdicbonal,  purpose,  or  
    applicabon-­‐oriented.
    Now why did I bold manipulate?

    View Slide

  35. Image  aEribubon:  ESRI  Internabonal  User  Conference  -­‐  2011  -­‐  San  Diego,  California  by  Kris  Krüg  hEp://flic.kr/p/a2rdhq  CC  BY-­‐NC-­‐SA  2.0
    When Jack is up on stage, he’s showcasing how GIS Pros are
    programming ArcGIS to manipulate spatial data

    View Slide

  36. History  of  GIS  Professionals
    Photo  by  Johnson  Cameraface  -­‐  hEp://flic.kr/p/dwQdSq

    View Slide

  37. Rise  of  the  Database

    View Slide

  38. Rise  of  the  Internet

    View Slide

  39. View Slide

  40. PR1ME  COMPUTER
    Prime  made  minicomputers  for  most  of  the  70s  and  80s.    The  original  ArcInfo  ran  on  it.

    View Slide

  41. Sun
    Microsystems  
    SPARCtower  6  by  storem  hEp://flic.kr/p/k79fJ
    Prime  made  minicomputers  for  most  of  the  70s  and  80s.    The  original  ArcInfo  ran  on  it.

    View Slide

  42. Mobile
    We’ve  embraced  mobile  devices  for  years

    View Slide

  43. Some  of  them  are  extremely  sexy

    View Slide

  44. These  mesa  devices  are  among  my  favorite

    View Slide

  45. View Slide

  46. Just  think  about  how  much  more  enjoyable  the  world  would  have  been  with  GIS  people  at  the  5p  of  the  spear.

    View Slide

  47. Big  Data
    Big  data  is  a  buzz  word…

    View Slide

  48. GIS  has  feasted  on  big  data  for  years.    I  mean  who  other  than  GIS  people  cares  that  there  is  a  4GB  limit  to  TIFF  or  that  a  JPG  can  only  be  30,000  
    pixels  wide?

    View Slide

  49. Why  Do  GIS  Professionals  Stay  

    View Slide

  50. GIS  Professionals  Assimilate  New  

    View Slide

  51. GIS  is  at  the  Forefront
    Python
    3D
    JavaScript
    Mobile
    XML
    .NET
    Scrip5ng
    GPS
    iOS
    RDBMS
    Database
    Big  Data
    Cloud
    Websites
    GRID
    Android
    Metadata
    Macintosh
    Windows
    Prin5ng
    JSON
    Vector
    UAV
    Sta5s5cs
    Data  Management
    UI
    Archiving
    KML
    Raster
    HTML5
    Prototyping
    Java
    All  these  great  technologies!

    View Slide

  52. We  Push  the  Envelope
    We  push  the  envelope

    View Slide

  53. hEp://www.flickr.com/photos/wwarby/2989238425/
    Python
    http://www.flickr.com/photos/wwarby/2989238425/

    View Slide

  54. If  you  like  GIS,  you  like  stabsbcs
    If  you  like  stabsbcs,  you  like  
    baseball
    If  you  like  baseball,  you  should  
    root  for  the  2012  World  Series  
    Champion  San  Francisco  Giants

    View Slide

  55. Baseball  as  an  Excuse  to  
    Program

    View Slide

  56. View Slide

  57. NYY 95 67 .586 +136
    BAL 93 69 .574 +7
    TAM 90 72 .556 +120
    TOR 73 89 .451 -68
    BOS 69 93 .426 -72
    DET 88 74 .543 +56
    CHS 85 77 .525 +72
    KAN 72 90 .444 -70
    CLE 68 94 .420 -178
    MIN 66 96 .407 -131
    OAK 94 68 .580 +99
    TEX 93 69 .574 +101
    LAA 89 73 .549 +68
    SEA 75 87 .463 -32
    WAS 98 64 .605 +137
    ATL 94 68 .580 +100
    PHI 81 81 .500 +4
    NYM 74 88 .457 -59
    MIA 69 93 .426 -115
    CIN 97 65 .599 +81
    STL 88 74 .543 +117
    MIL 83 79 .512 +43
    PIT 79 83 .488 -23
    CHC 61 101 .377 -146
    HOU 55 107 .340 -211
    SFG 94 68 .580 +69
    LAD 86 76 .531 +40
    ARI 81 81 .500 +46
    SDP 76 86 .469 -59
    COL 64 98 .395 -132

    View Slide

  58. #!/usr/bin/python
    from  scipy  import  stats
    from  pylab  import  *
    #  Read  in  the  data.
    mlb  =  loadtxt('mlb.txt',  dtype=[('team',  'S3'),  ('w',  'i'),  ('l',  'i'),  ('pct',  'f'),    
    ('rdiff',  'i')])
    #  Plot  the  data  with  invisible  points.
    scatter(mlb['rdiff'],  mlb['w'],  s=0)
    xlabel('Run  differential')
    ylabel('Wins')
    #  Put  team  names  at  the  data  points.
    for  (t,  w,  rd)  in  zip(mlb['team'],  mlb['w'],  mlb['rdiff']):
      text(rd,  w,  t,  size=9,
        horizontalalignment='center',  verticalalignment='center')
    #  Perform  the  linear  regression
    m,  b,  r,  p,  stderr  =  stats.linregress(mlb['rdiff'],  mlb['w'])
    #  Get  endpoints  of  regression  line  and  plot  it.
    rdMin  =  min(mlb['rdiff'])
    wMin  =  m*rdMin  +  b
    rdMax  =  max(mlb['rdiff'])
    wMax  =  m*rdMax  +  b
    plot([rdMin,  rdMax],  [wMin,  wMax])
    show()
    PyLab: NumPy, SciPy, Matplotlib, and IPython (Replaces MATLAB)
    SciPy: linear regression
    matplotlib: plotting tools

    View Slide

  59. View Slide

  60. View Slide

  61. Rainbows  and  Unicorns

    View Slide

  62. The  Future  for  GIS  
    Professionals

    View Slide

  63. So  You  Want  to  be  a
    Word  Processor
    Dames & Moore
    4 people in an office of 100
    10 years ago you could make a career doing this.

    View Slide

  64. The  Future  for
    Word  Processors
    Dames & Moore
    4 people in an office of 100
    10 years ago you could make a career doing this.

    View Slide

  65. What’s the future for GIS?

    View Slide

  66. If  You...
    • Put  points  on  a  map  and  throw  up  a  
    scale  bar
    • Perform  geoprocessing  without  Python  
    or  Model  Builder
    • Have  a  job  descrip5on  of  “Ploier  
    Operator”
    • Have  no  idea  what  “fuzzy  tolerance”  is

    View Slide

  67. You’ll  be  out  of  a  job

    View Slide

  68. If  You...
    • Embrace  Python  as  your  GIS  tool  of  
    choice.
    • Use  Model  Builder  to  automate  your  
    work  flows.
    • Learn  new  tools  such  as  TileMill/
    Mapnik/PostGIS

    View Slide

  69. Bringing ArcView to the browser requires someone to create
    Geoprocessing scripts to enable that. You want to be that guy.

    View Slide

  70. So  go  out  and  hug  a  globe  today!

    View Slide

  71. Prinbng,  gunpowder  and  the  compass:
    These  three  have  changed  the  whole  face  
    and  state  of  things  throughout  the  world
    Francis  Bacon

    View Slide

  72. Francis  Bacon
    Andrew  Turner
    Prinbng,  gunpowder  and  the  compass:
    Internet,  mobile  phones  and  the  GPS:
    These  three  have  changed  the  whole  face
    and  state  of  things  throughout  the  world
    Andrew  Turner  puts  it  so  very  well!

    View Slide

  73. Contact
    James  Fee  –  Founder  Spa5ally  Adjusted
    email:  [email protected]
    voice:  480-­‐225-­‐2287
    web:  spa5allyadjusted.com
    twiier:  @cageyjames
    Slide  Deck:  hip://bit.ly/gitr13_key

    View Slide