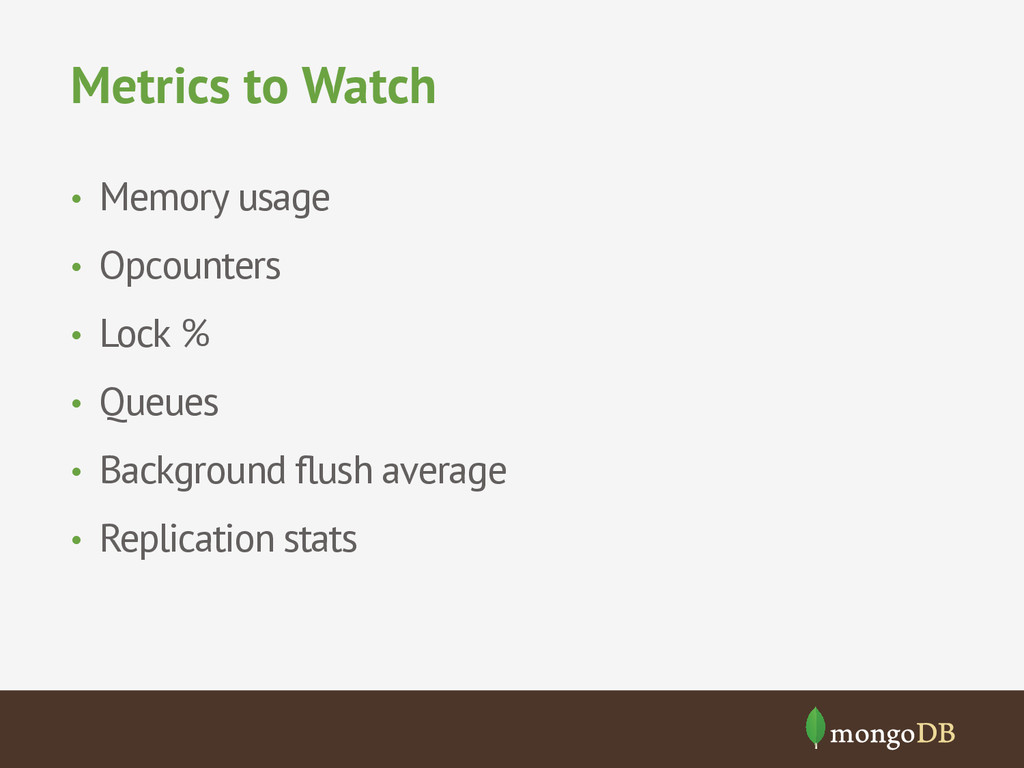
memory-mapped files i.e. read-through write-through memory caching. • Runs nearly everywhere • Data serialized as BSON (fast parsing) • Full support for primary & secondary indexes • Document model = less work
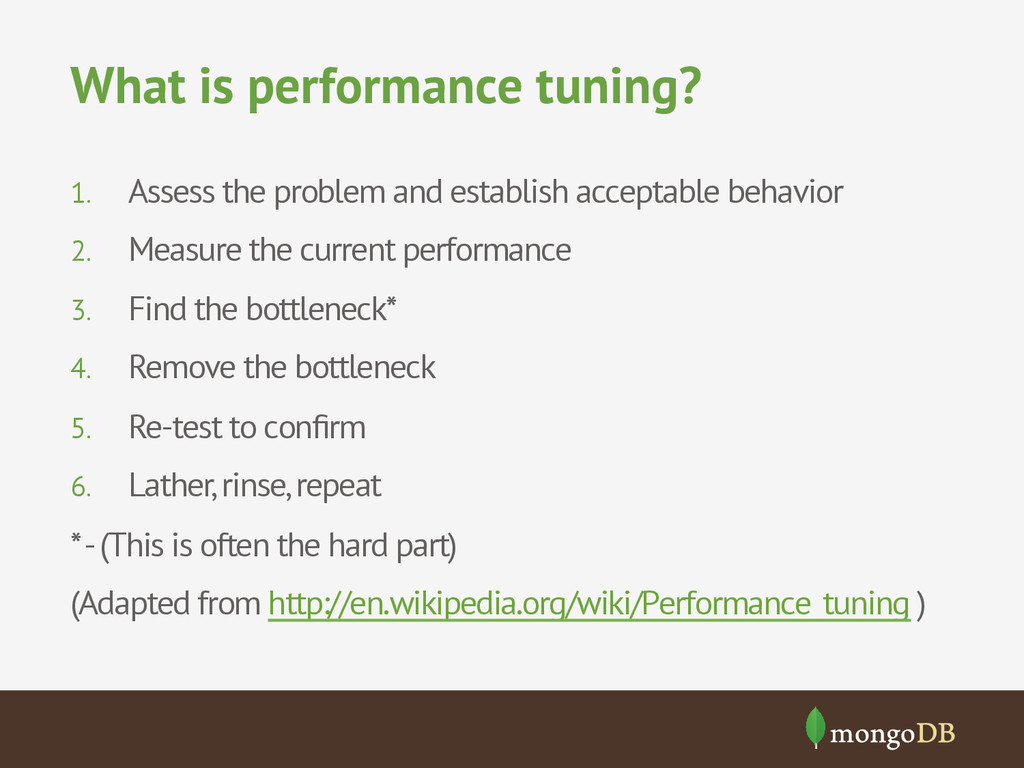
acceptable behavior 2. Measure the current performance 3. Find the bottleneck* 4. Remove the bottleneck 5. Re-test to confirm 6. Lather, rinse, repeat * - (This is often the hard part) (Adapted from http://en.wikipedia.org/wiki/Performance_tuning )
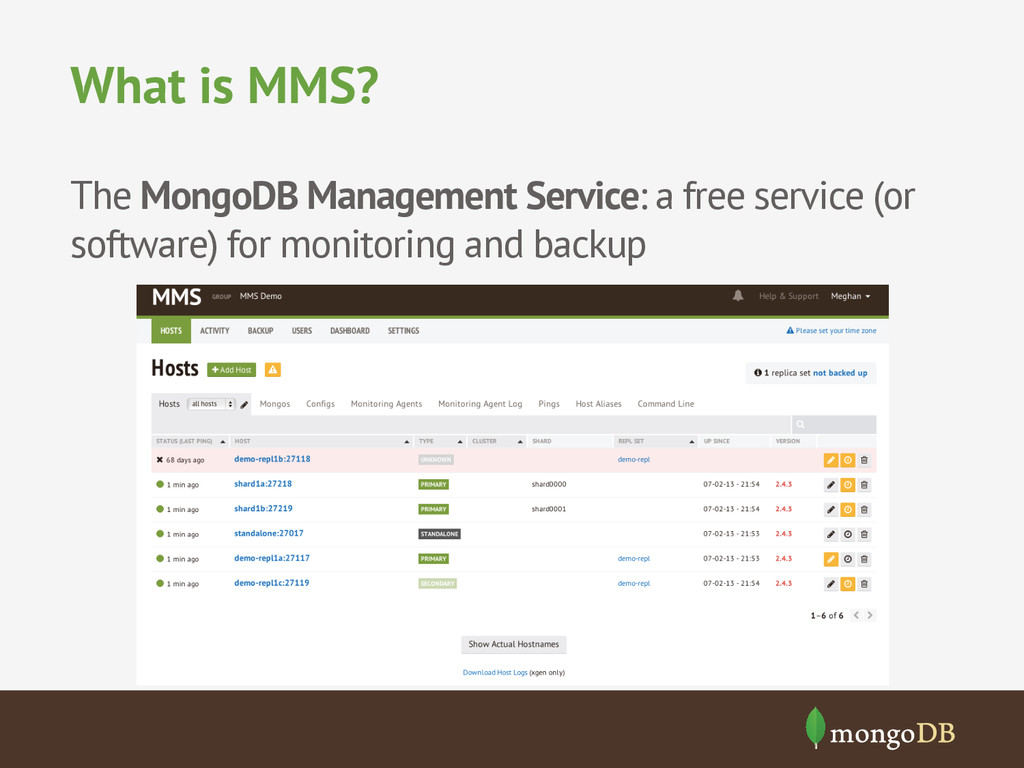
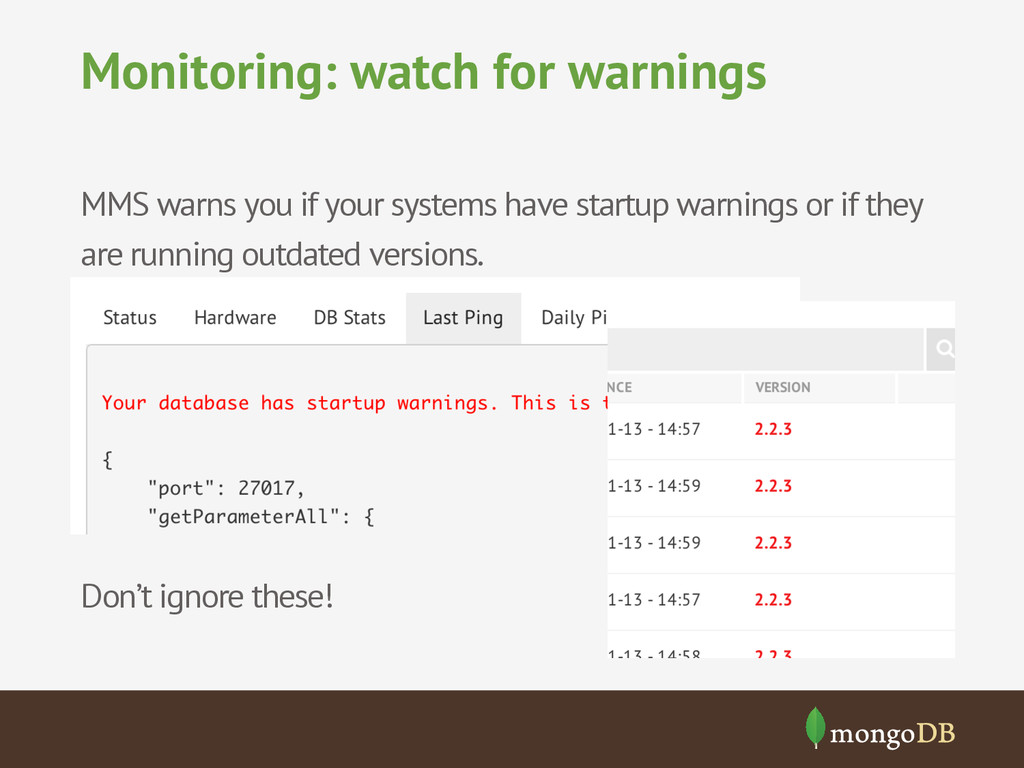
run multiple agents (1 primary) • Hosts: use CNAMEs, especially on AWS! • You can use a group per env (each needs an agent) • Connections are over SSL • On-Premise solution for those that don’t want to use the hosted service
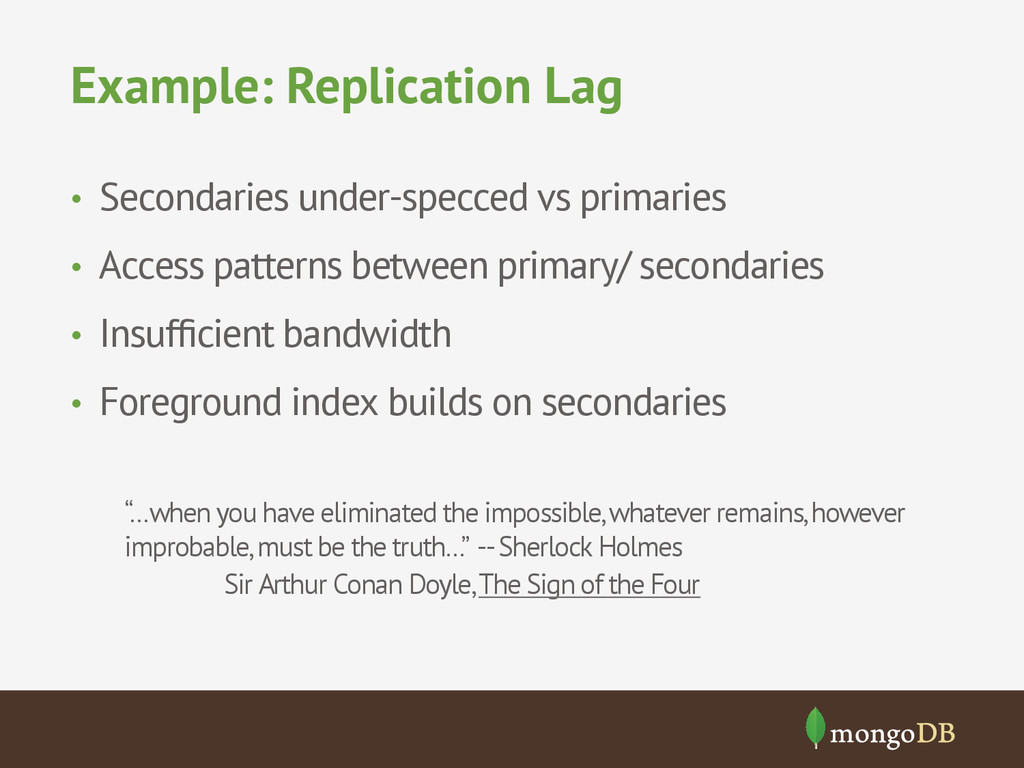
patterns between primary/ secondaries • Insufficient bandwidth • Foreground index builds on secondaries “…when you have eliminated the impossible, whatever remains, however improbable, must be the truth…” -- Sherlock Holmes Sir Arthur Conan Doyle, The Sign of the Four
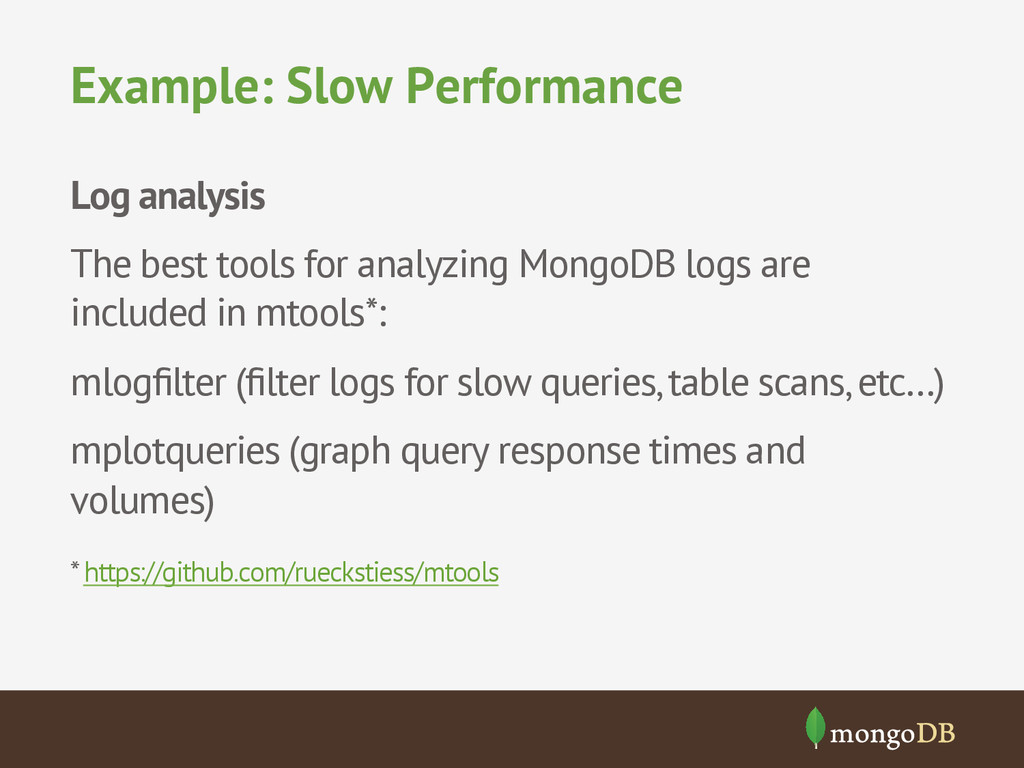
MongoDB logs are included in mtools*: mlogfilter (filter logs for slow queries, table scans, etc…) mplotqueries (graph query response times and volumes) * https://github.com/rueckstiess/mtools
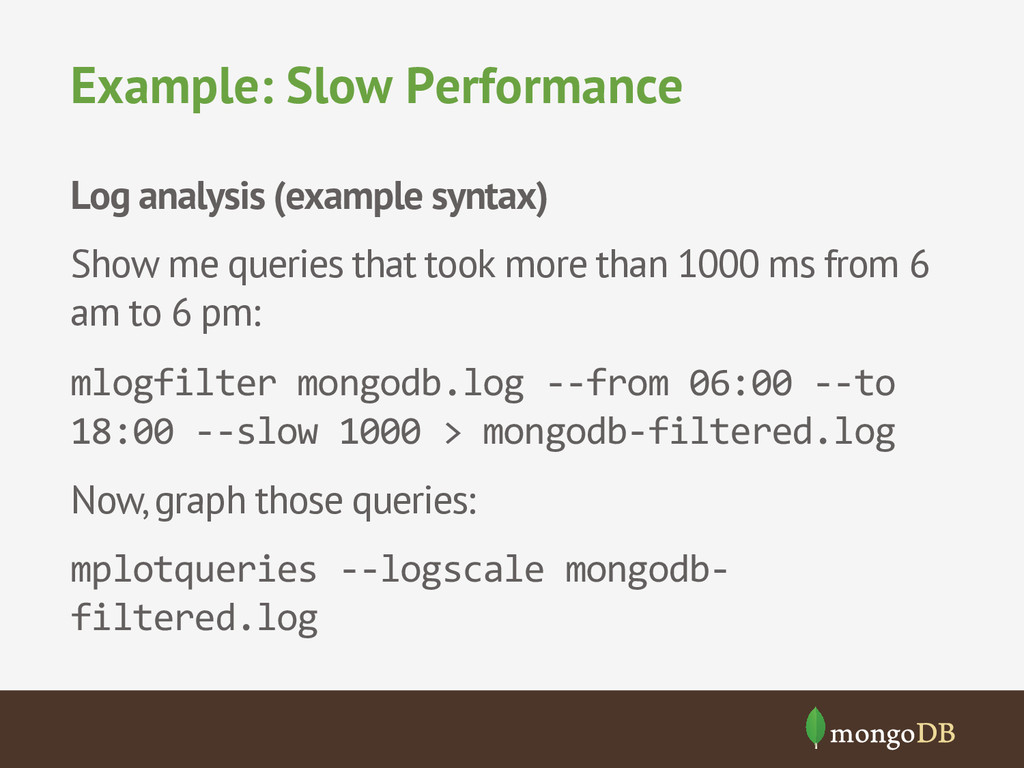
that took more than 1000 ms from 6 am to 6 pm: mlogfilter mongodb.log -‐-‐from 06:00 -‐-‐to 18:00 -‐-‐slow 1000 > mongodb-‐filtered.log Now, graph those queries: mplotqueries -‐-‐logscale mongodb-‐ filtered.log
query: { e: ”[id1]" } update: { $addToSet: { fr: ”[id2]" } } nscanned:1 nmoved:1 nupdated:1 keyUpdates:0 locks(micros) w:85145 11768ms Almost 12 seconds! This time, there’s “nmoved:1”, too. This means a document was moved on disk – it outgrew the space allocated for it.
![Example: Slow query Wed Jul 17 13:40:14 [conn28600] query x.y](https://files.speakerdeck.com/presentations/d454a2f095620131cd83465820109070/slide_29.jpg)
![Example: Slow update Wed Jul 17 14:11:59 [conn56541] update x.y](https://files.speakerdeck.com/presentations/d454a2f095620131cd83465820109070/slide_30.jpg)