to submit 1. Team Project Source code in Java. All classes in the default package, i.e., no package instruction used. Use only Java AWT, Java Swing Only one external library allowed: JFreeChart
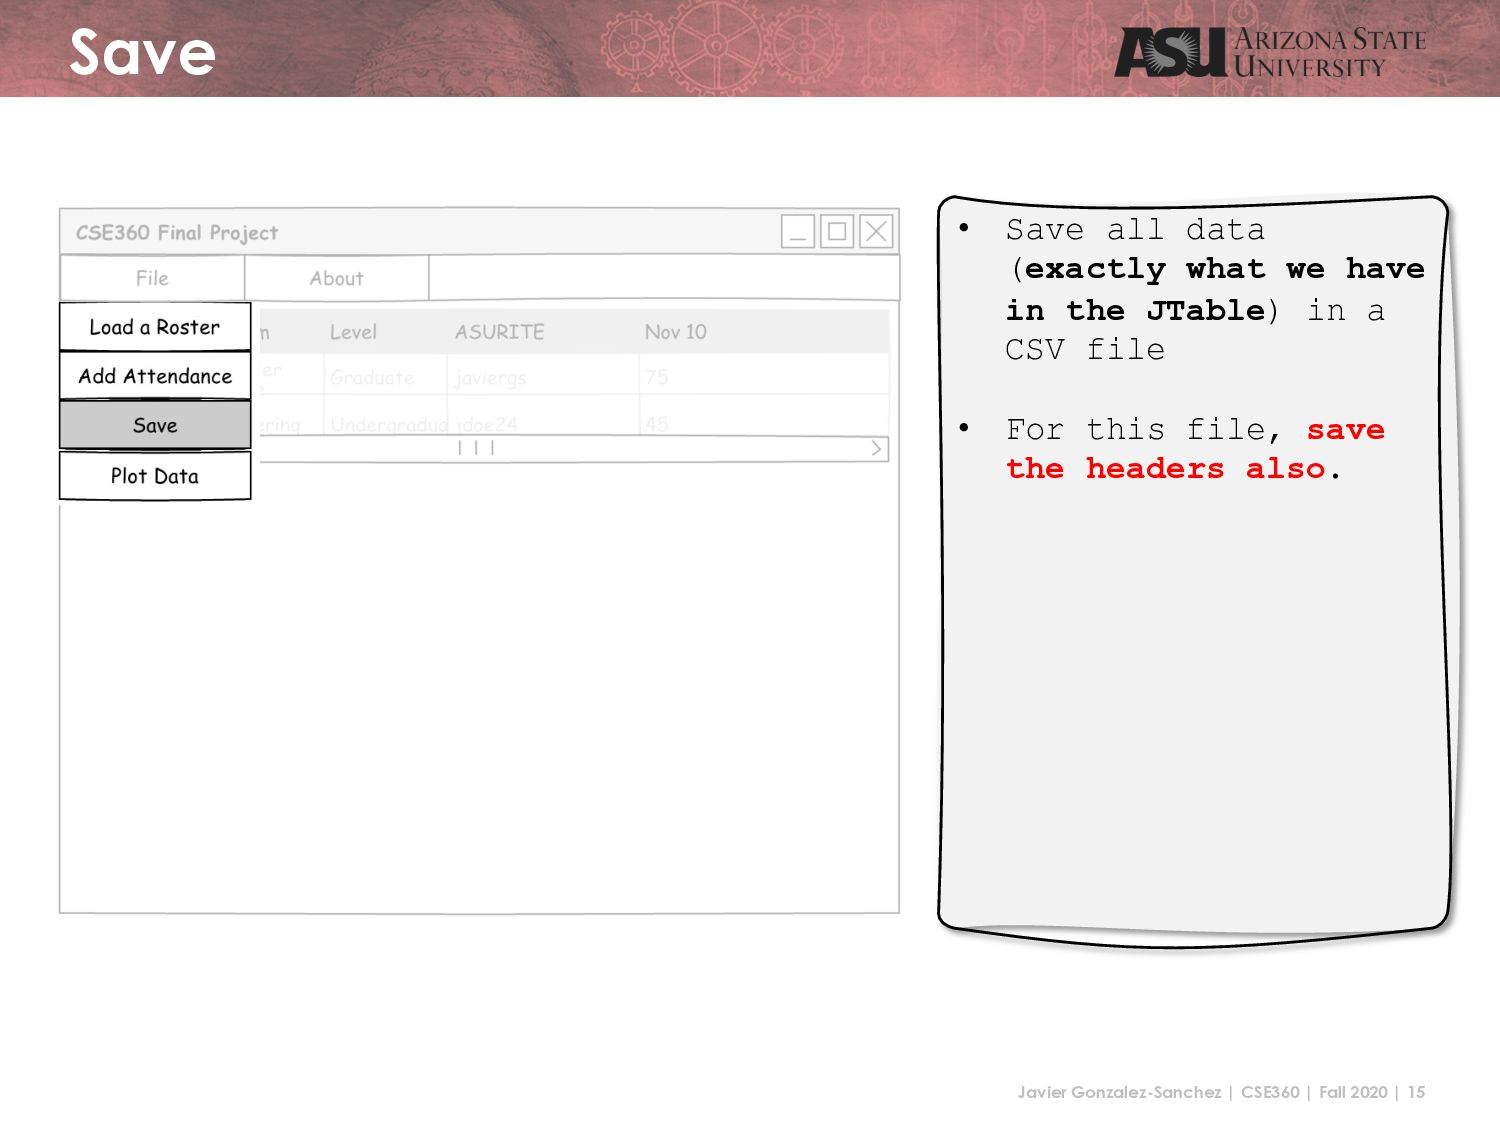
to submit 2. Project Report • Class diagram. It is not an adornment. It should match 100% with the source code: association, aggregation, composition, realization, generalization. • Screenshot(s) of your project running.
Talk with your team about expectations before start working. Review carefully if your team expectations match what you are able to / want to do. Including: getting an A+ vs I am ok with a C-, morning vs night people etc., etc., etc.
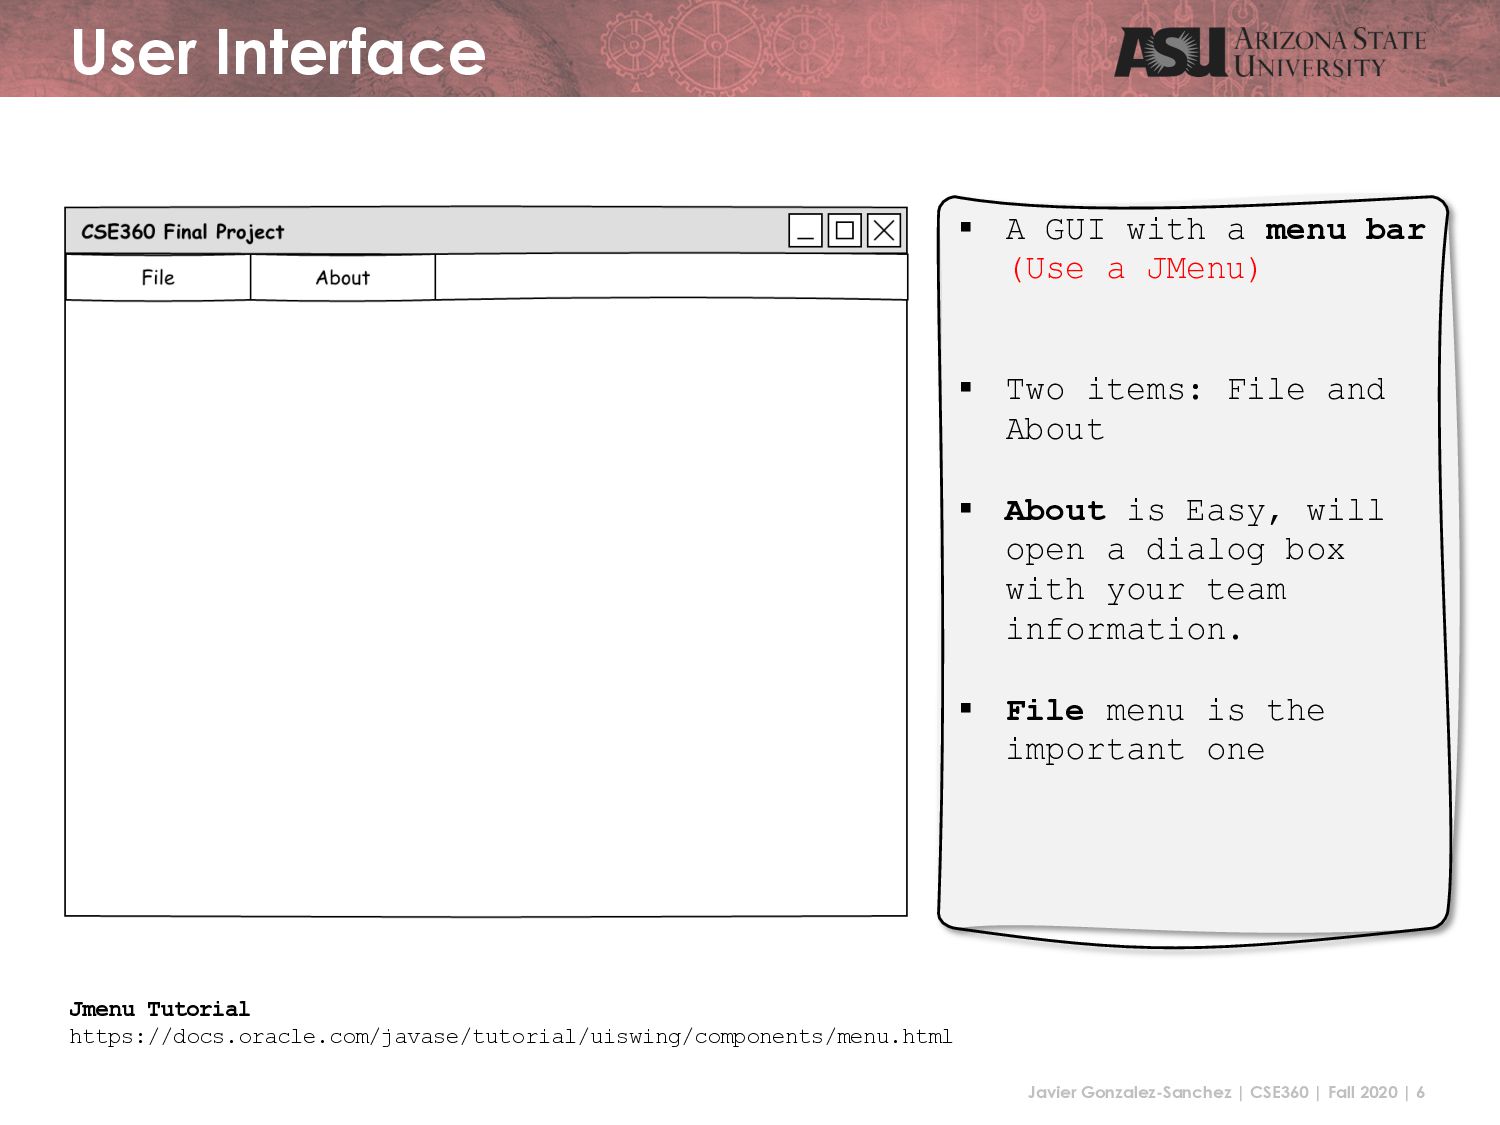
Interface § A GUI with a menu bar (Use a JMenu) § Two items: File and About § About is Easy, will open a dialog box with your team information. § File menu is the important one Jmenu Tutorial https://docs.oracle.com/javase/tutorial/uiswing/components/menu.html
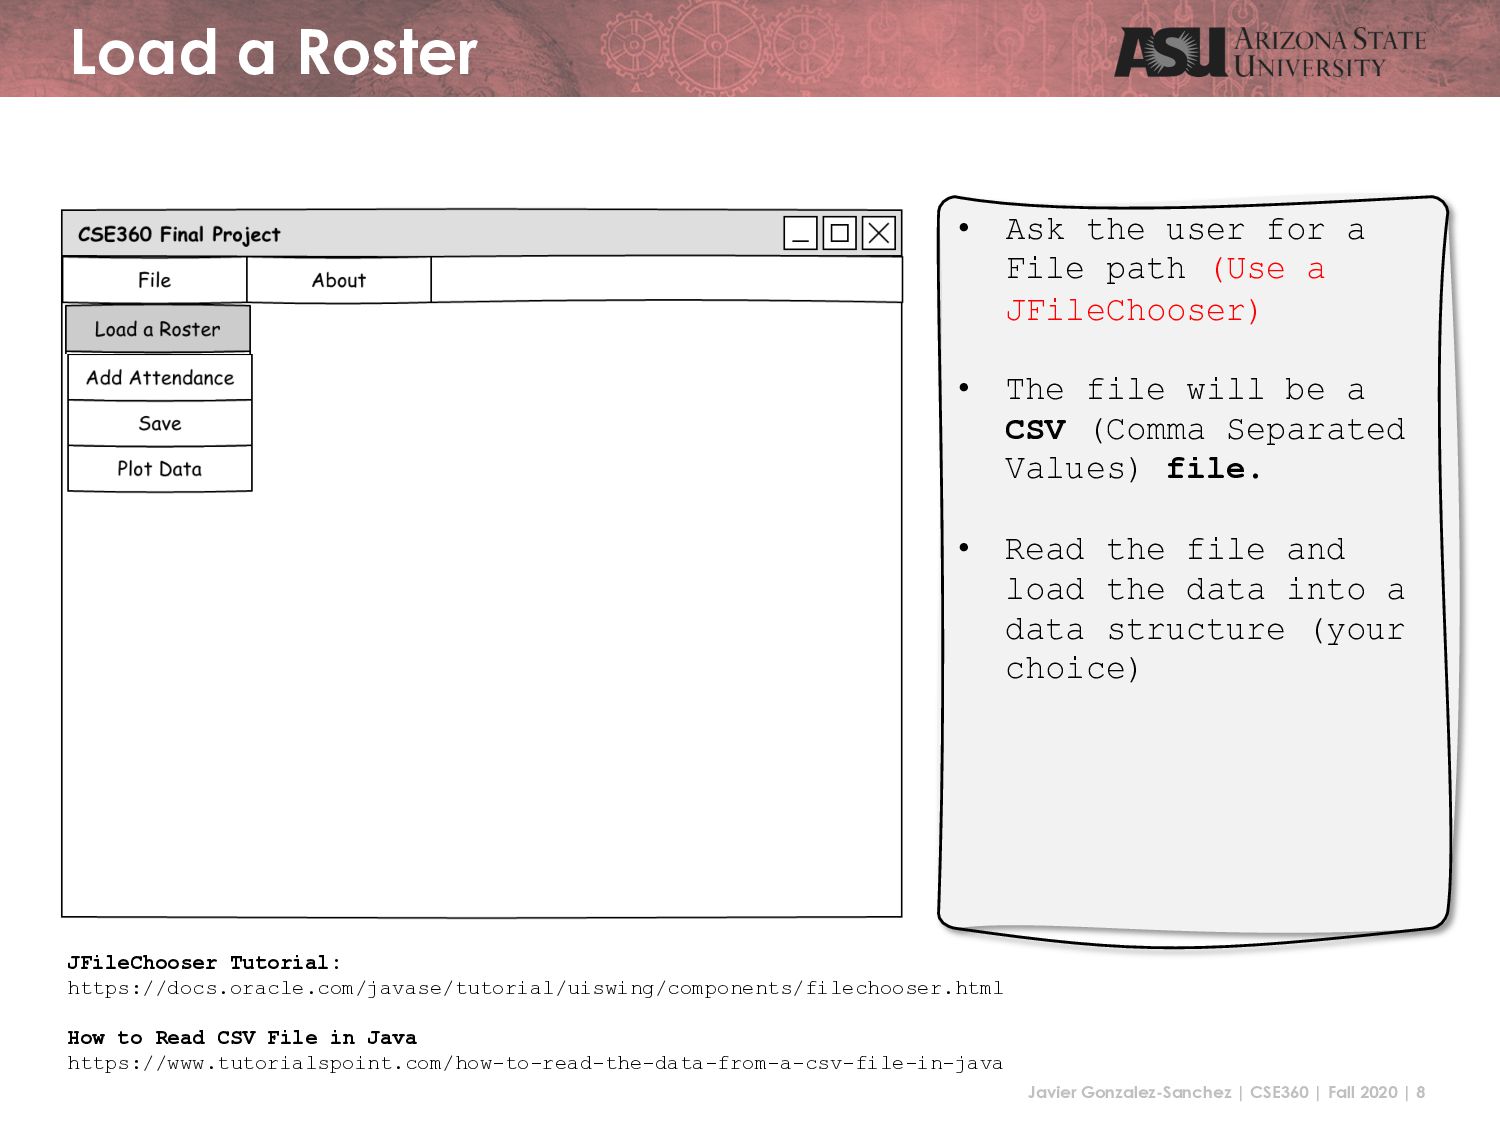
a Roster • Ask the user for a File path (Use a JFileChooser) • The file will be a CSV (Comma Separated Values) file. • Read the file and load the data into a data structure (your choice) JFileChooser Tutorial: https://docs.oracle.com/javase/tutorial/uiswing/components/filechooser.html How to Read CSV File in Java https://www.tutorialspoint.com/how-to-read-the-data-from-a-csv-file-in-java
a Roster • Once the data is loaded, visualize it on the screen using a Jtable • Add your JTable in a JScrollPane, you will need scrollbars, both horizontal and vertical Jtable Tutorial https://www.javatpoint.com/java-jtable Dinamically Updating a JTable https://stackoverflow.com/questions/24918884/dynamically-updating-jtable
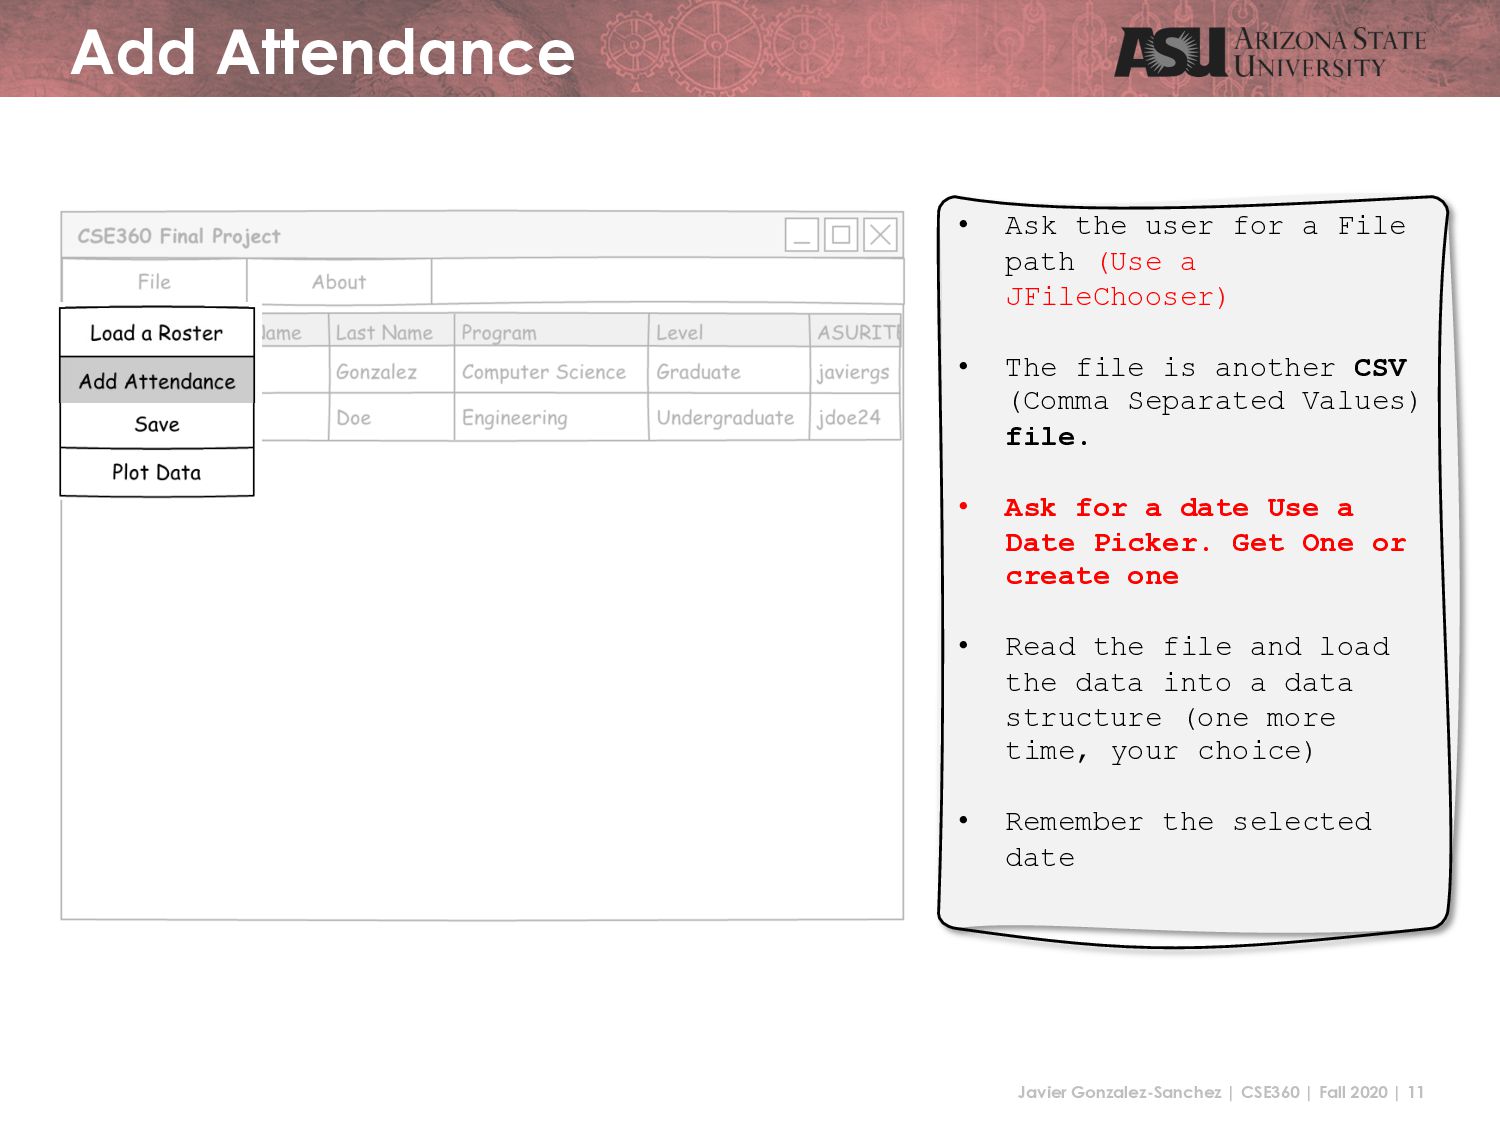
Attendance • Ask the user for a File path (Use a JFileChooser) • The file is another CSV (Comma Separated Values) file. • Ask for a date Use a Date Picker. Get One or create one • Read the file and load the data into a data structure (one more time, your choice) • Remember the selected date
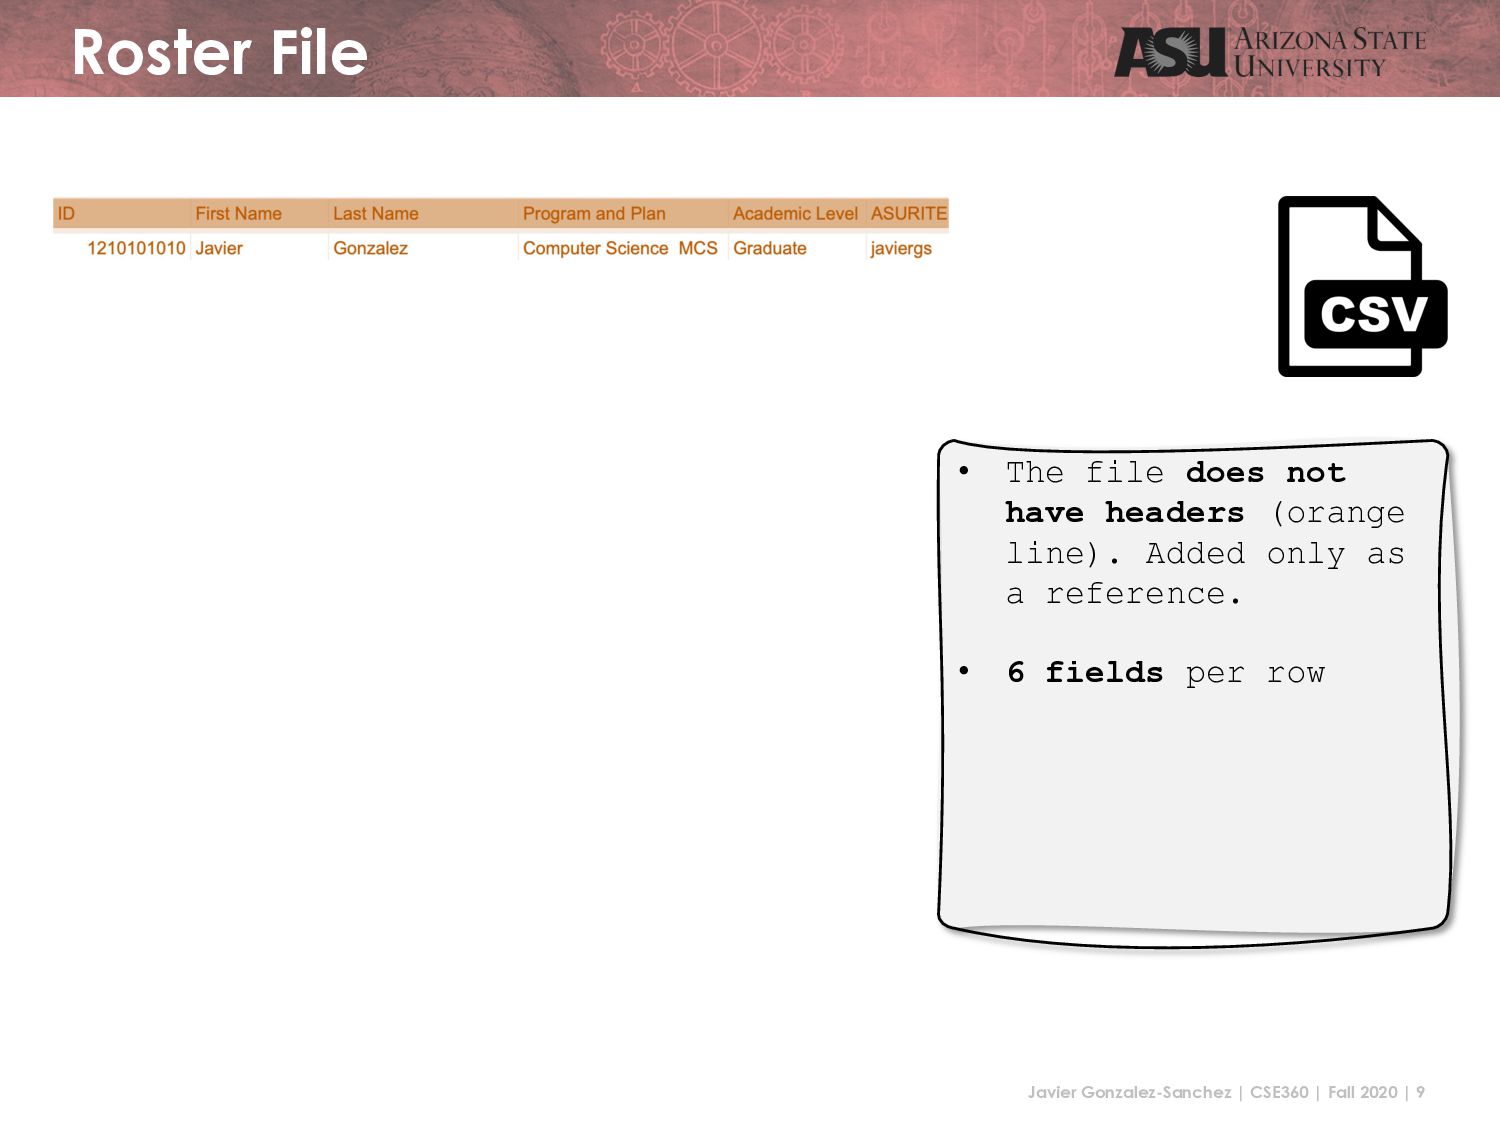
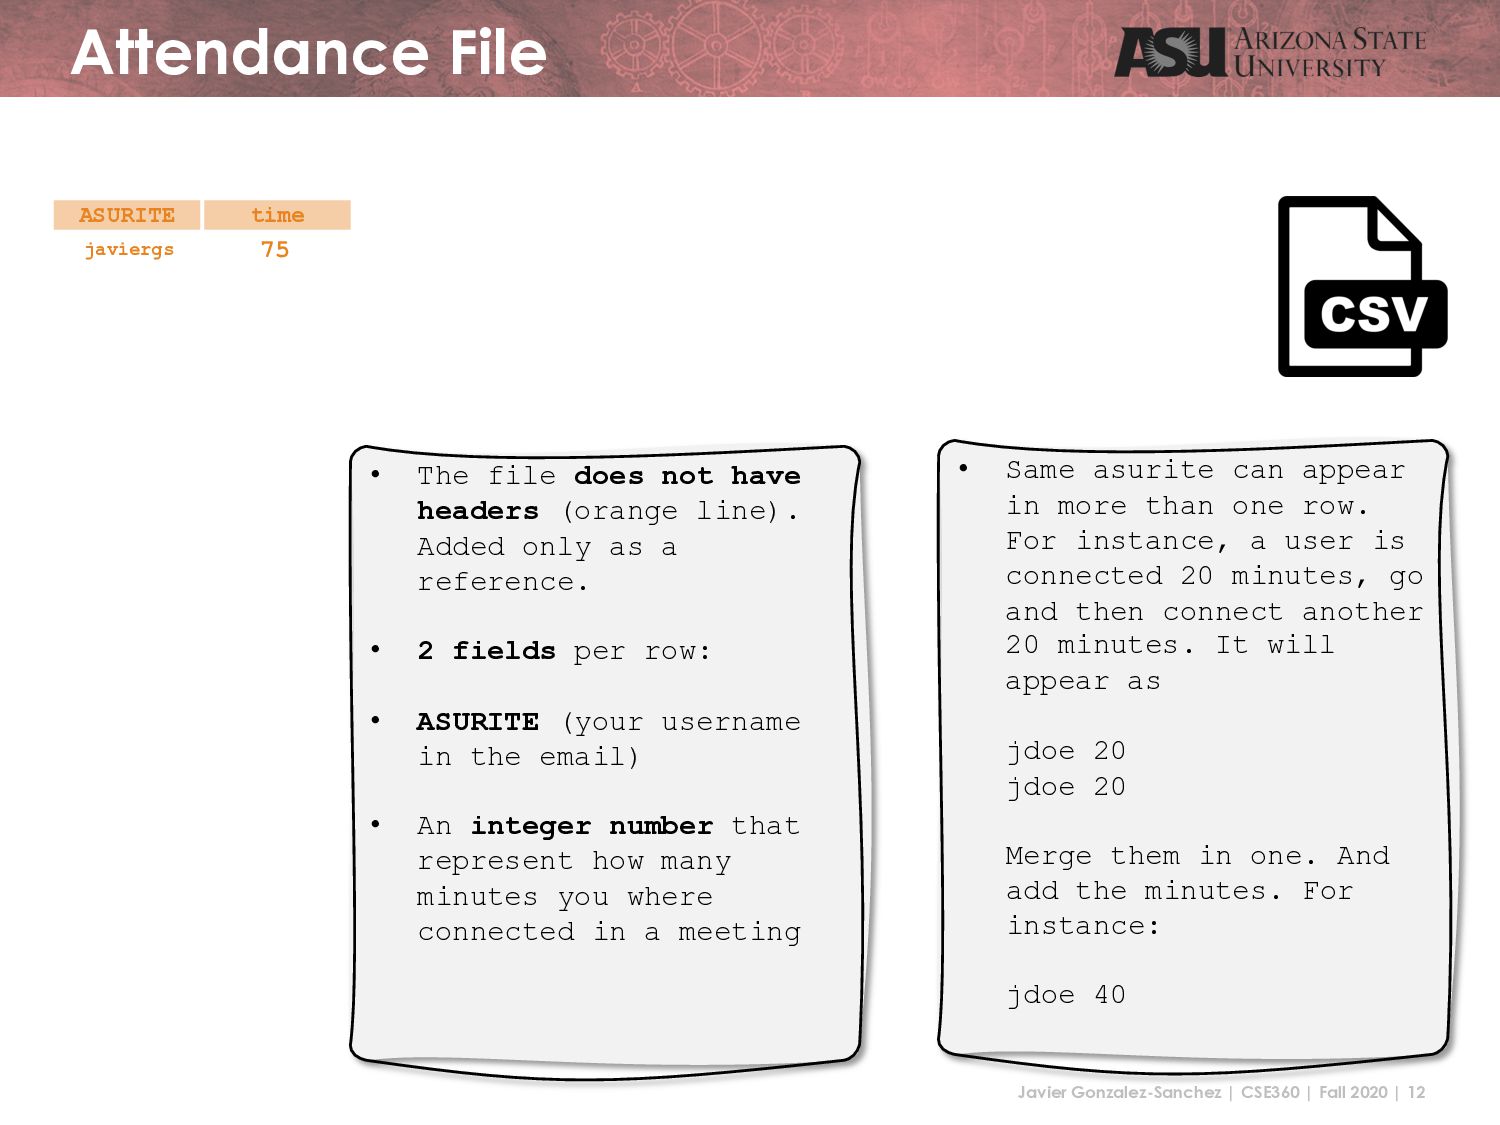
File • Same asurite can appear in more than one row. For instance, a user is connected 20 minutes, go and then connect another 20 minutes. It will appear as jdoe 20 jdoe 20 Merge them in one. And add the minutes. For instance: jdoe 40 75 time ASURITE javiergs • The file does not have headers (orange line). Added only as a reference. • 2 fields per row: • ASURITE (your username in the email) • An integer number that represent how many minutes you where connected in a meeting
+ Attendance • Using the asurite field as a reference, mix the roster data and the attendance data • Visualize the attendance data adding a column to the JTable. The header for the column is the date that the user provided • Any attendee that is not in the roster is ignored. But report it to the user. Use an option of JDialog
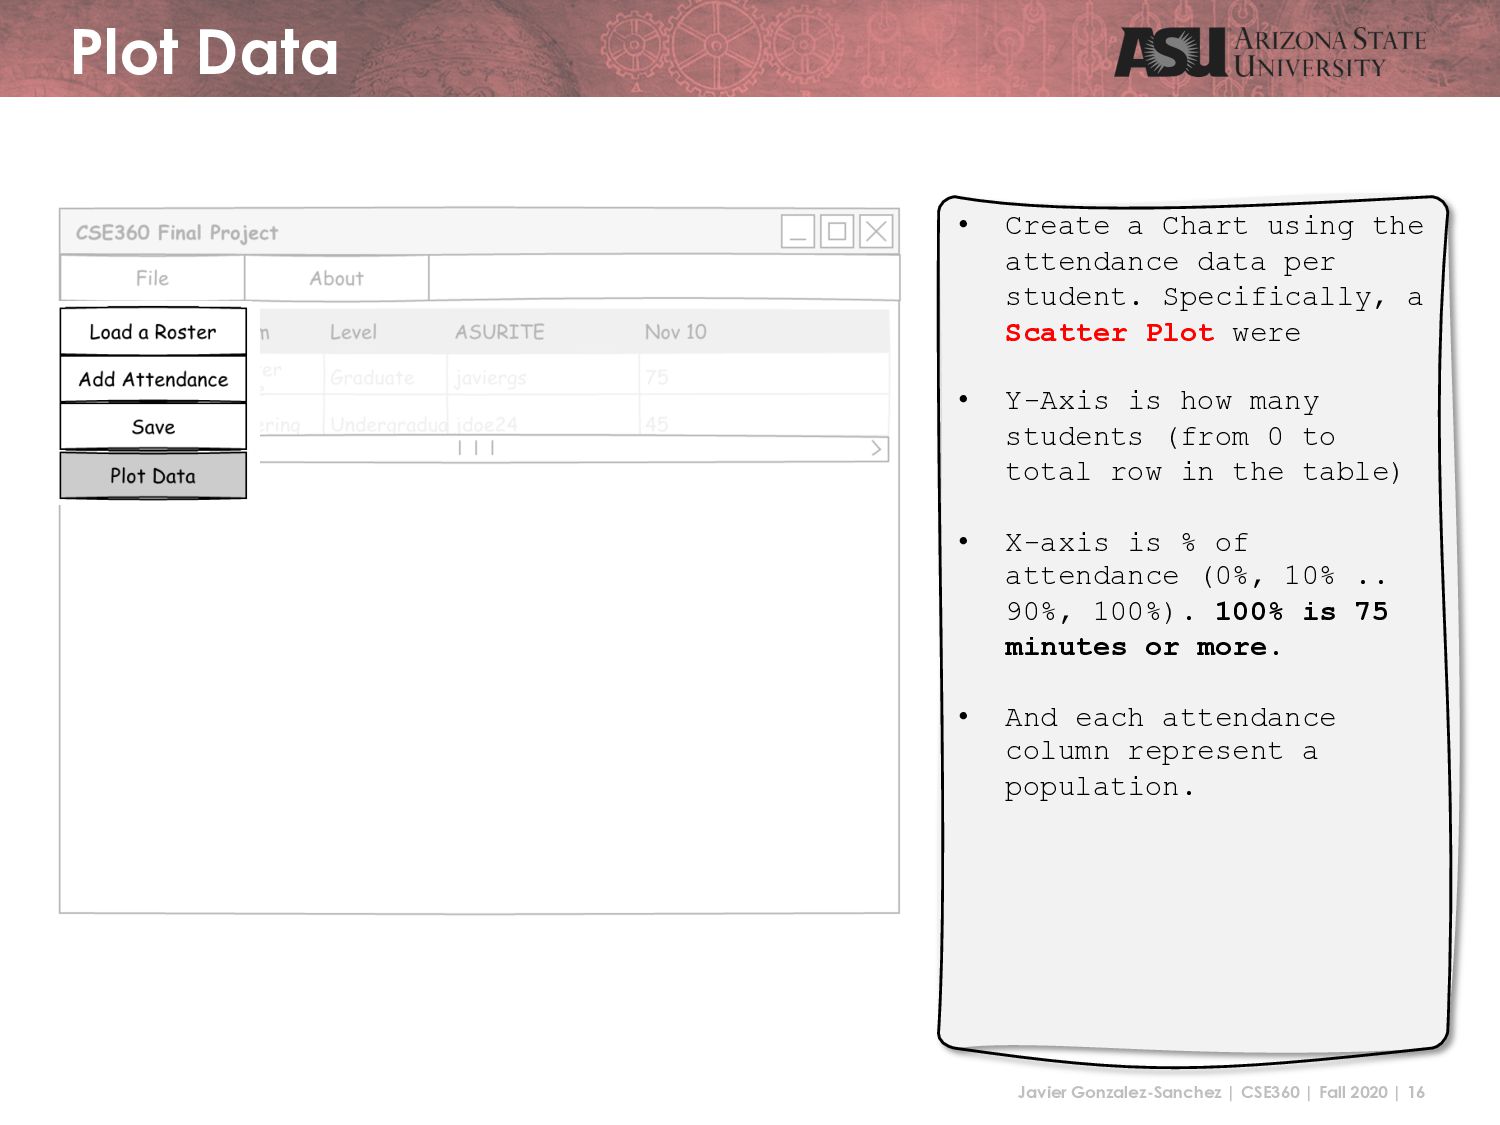
Data • Create a Chart using the attendance data per student. Specifically, a Scatter Plot were • Y-Axis is how many students (from 0 to total row in the table) • X-axis is % of attendance (0%, 10% .. 90%, 100%). 100% is 75 minutes or more. • And each attendance column represent a population.
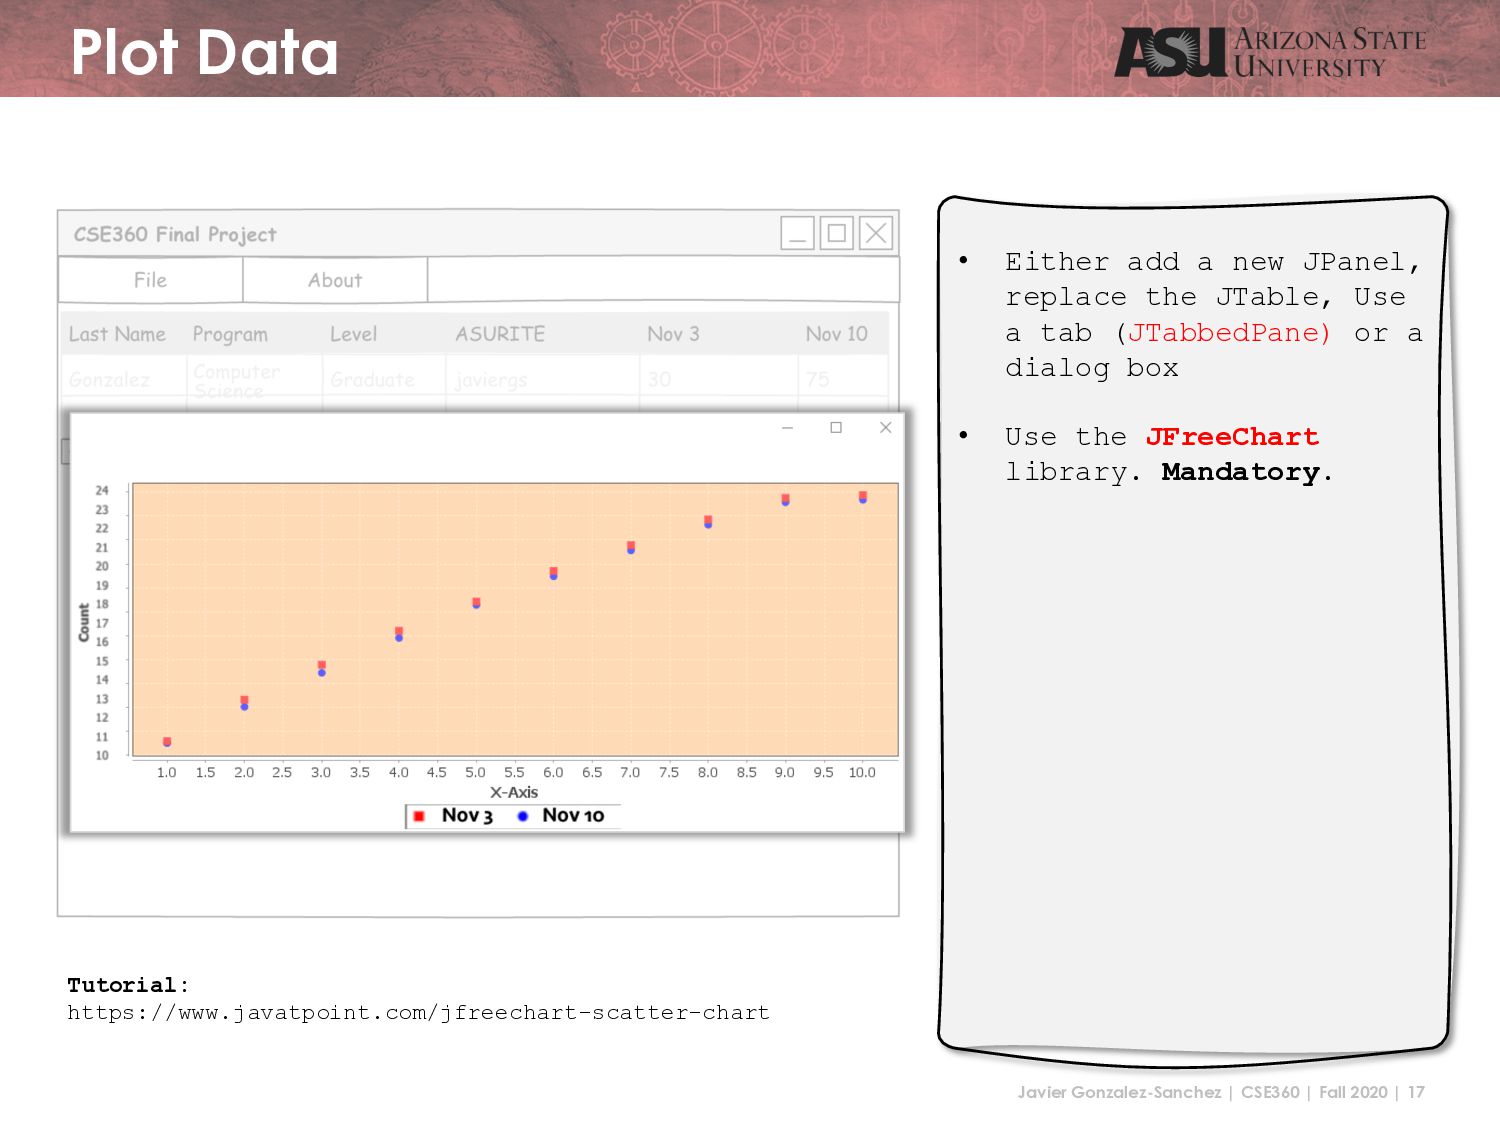
Data • Either add a new JPanel, replace the JTable, Use a tab (JTabbedPane) or a dialog box • Use the JFreeChart library. Mandatory. Tutorial: https://www.javatpoint.com/jfreechart-scatter-chart
![CSE360 – Introduction to Software Engineering Javier Gonzalez-Sanchez [email protected] Summer](https://files.speakerdeck.com/presentations/5bba0f14a5f04473acbb7e897360c7b4/slide_18.jpg)