Upgrade to Pro — share decks privately, control downloads, hide ads and more …

A Framework to Integrate Public, Dynamic Metrics into an OER Platform

jczetta
April 24, 2014

A Framework to Integrate Public, Dynamic Metrics into an OER Platform

This presentation was given at the Open Courseware Consortium (now Open Education Consortium) Global Conference 2014, in Ljubljana, Slovenia. Our abstract is below. The paper this presentation is based on can be found here: http://openpraxis.org/index.php/OpenPraxis/article/view/118

ABSTRACT:
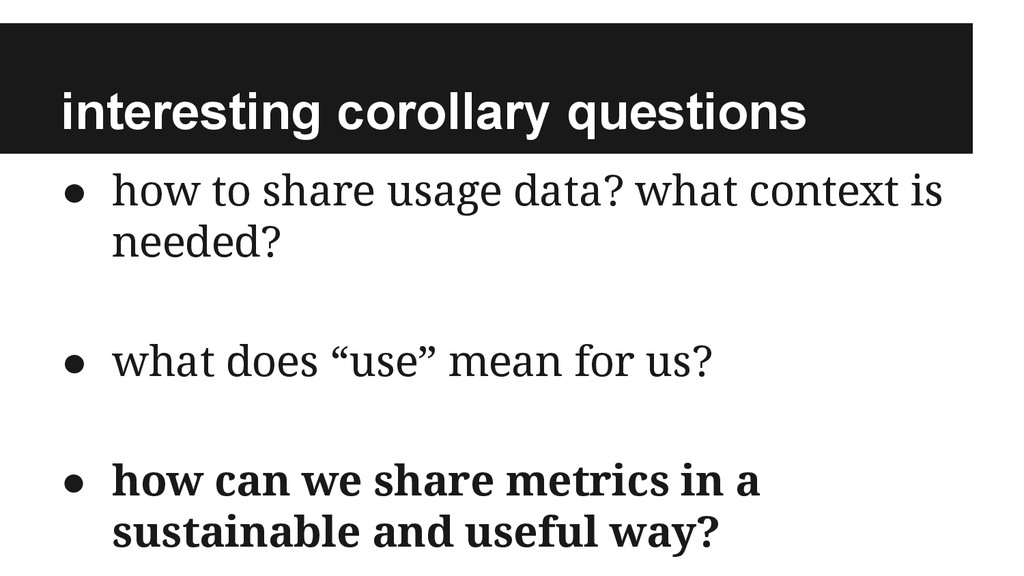
Metric-sharing is currency in relationships between OER-publishing-platforms and the faculty, staff, and students of universities and businesses who create OER. It is valuable to display metrics publicly and dynamically and in a structure that can isolate and aggregate usage data for different levels of granularity within an institution’s collection. Such open sharing of metrics can strengthen relationships with authors and may provide conveniently available evidence to justify the effort and expense of OER practices.

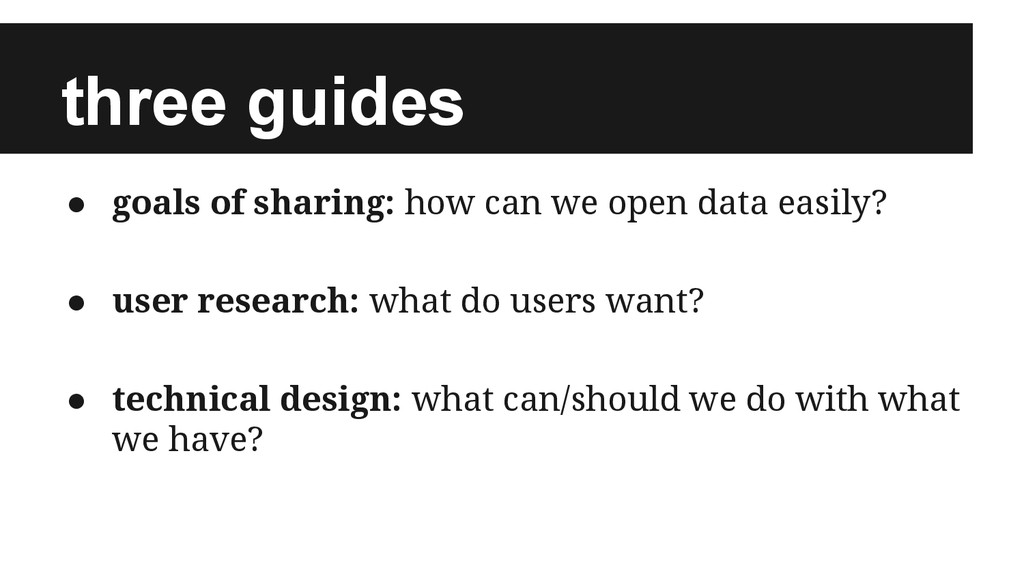
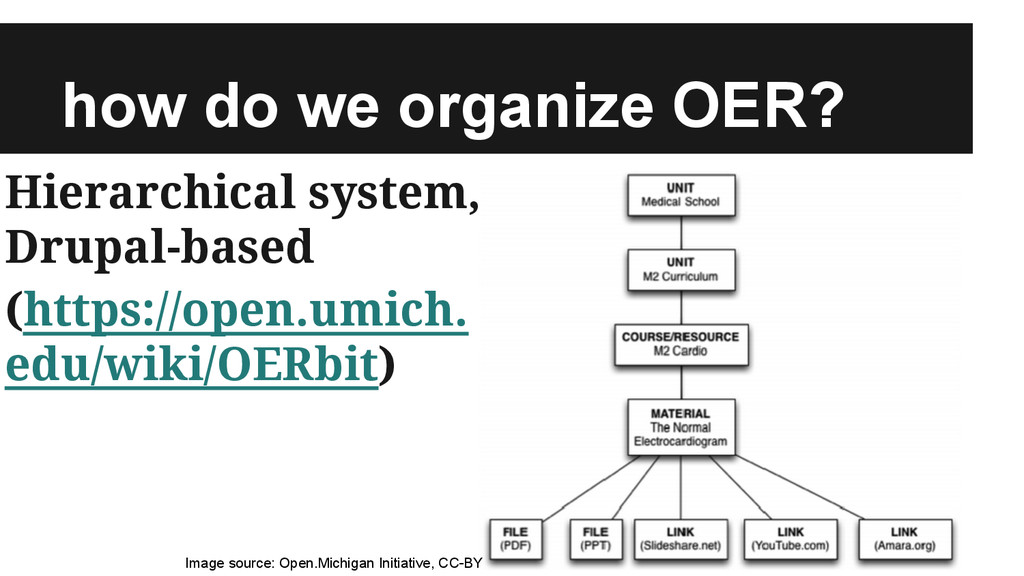
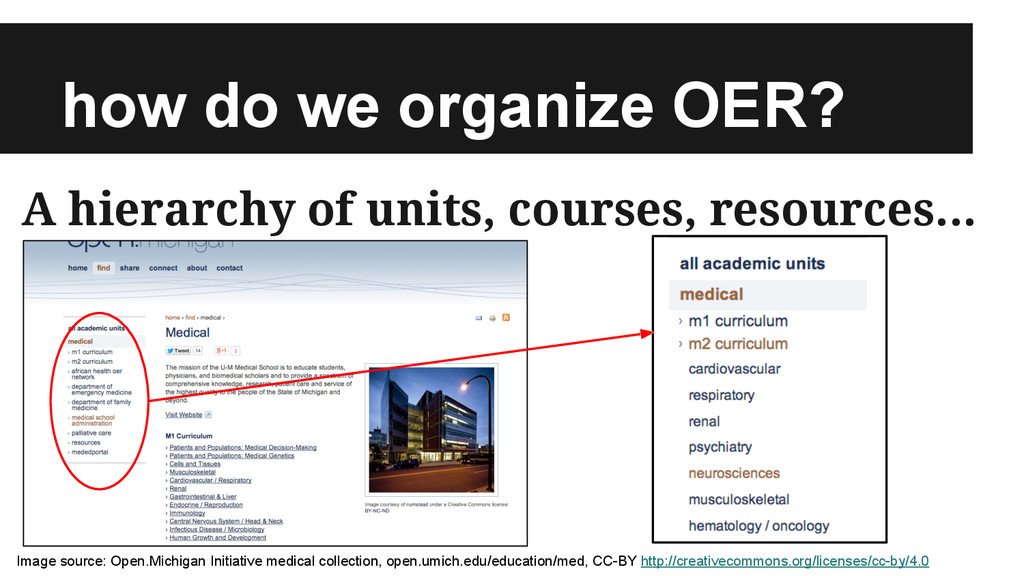
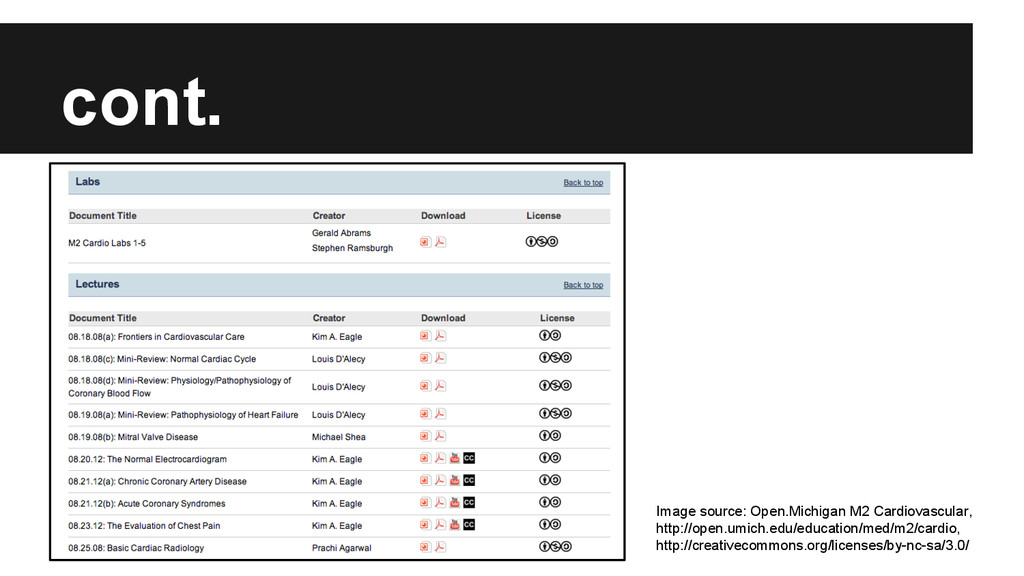
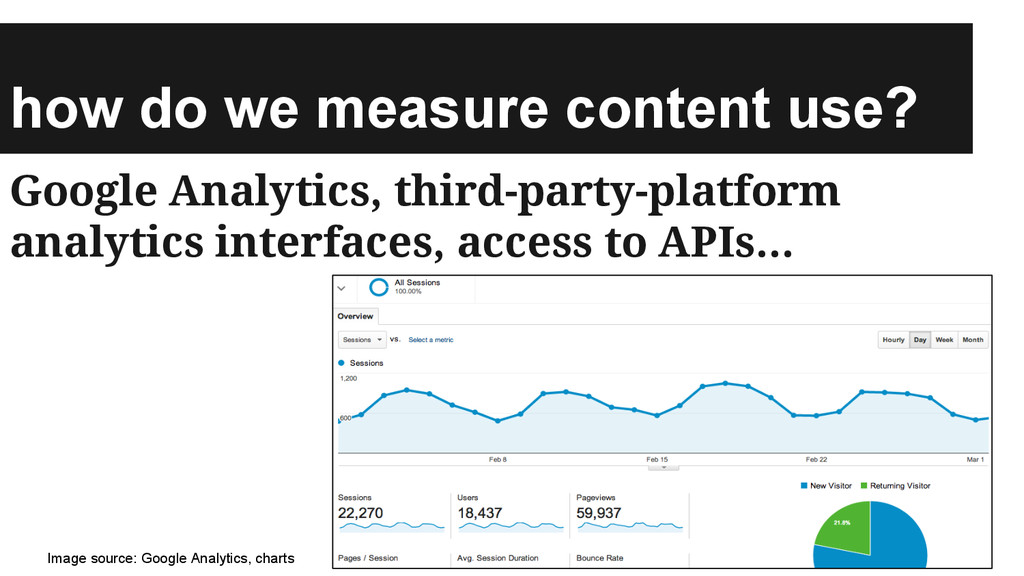
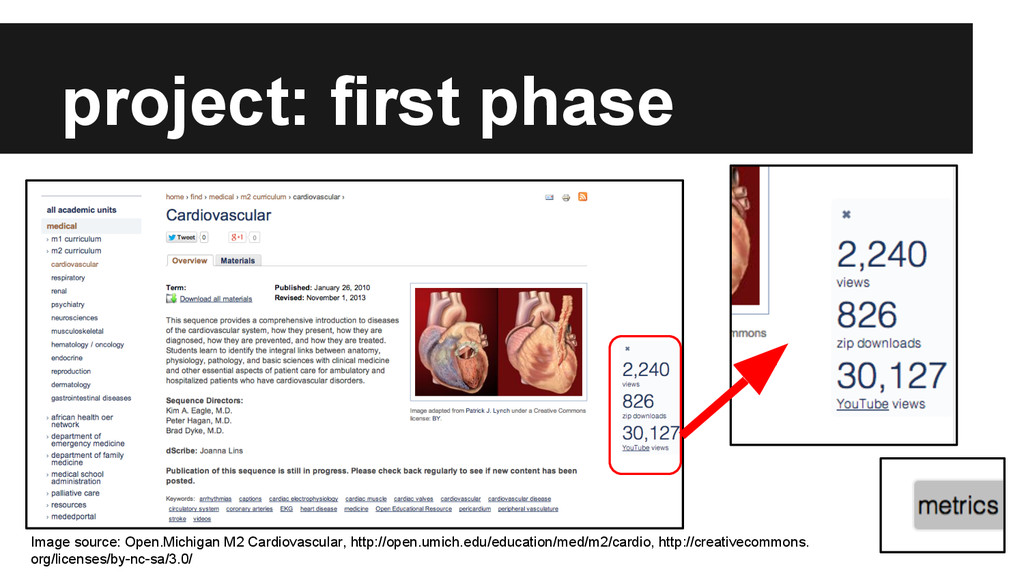
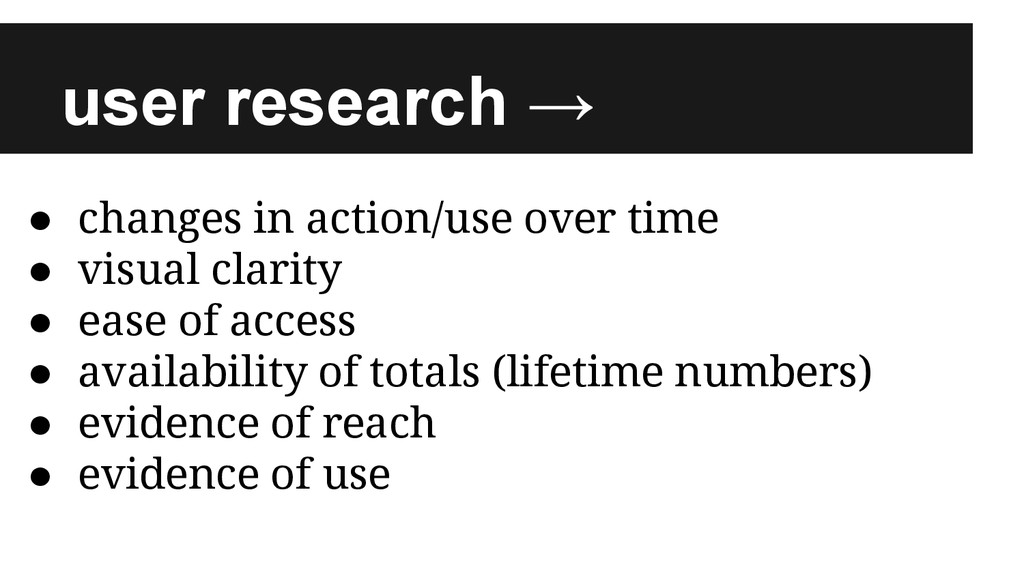
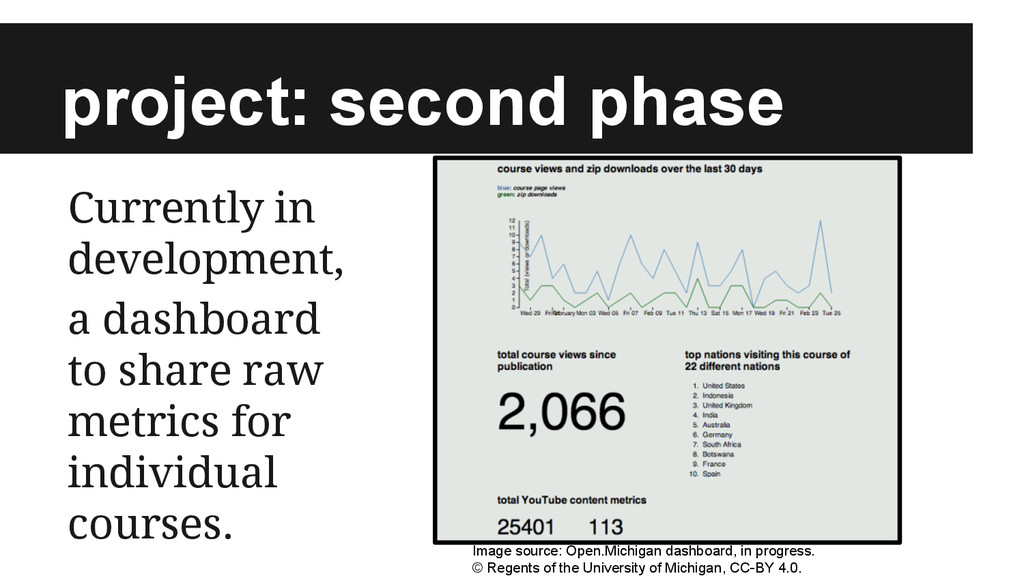
In this talk we discuss the first year of University of Michigan’s project to share its usage data for the OER on the Open.Michigan website in more useful, accessible, and timely ways for our authors and for the general public. First, we will review the process and results of our semi-structured interviews aimed to identify which metrics and indicators were of particular interest to our audience. Next, we will explain our stratified technical design, which consists of a customized open source content management system named OERbit with flexible hierarchies and a custom open source metrics plug-in that synthesizes metrics via application programmable interfaces (APIs) from content that is locally hosted as well as content that is referenced as external links. Lastly, we will discuss future directions for the project, both conceptually and technologically.

jczetta

April 24, 2014
Tweet

More Decks by jczetta

Other Decks in Education

Transcript

  1. A Framework to Integrate Public, Dynamic Metrics into an OER

    Platform Jaclyn Zetta Cohen, Kathleen Ludewig Omollo, Dave Malicke {jczetta, kludewig, dmalicke}@umich.edu Open.Michigan Initiative, University of Michigan Download slides: http://openmi.ch/ocwc-2014-metrics OCWC Global, April 2014 All content in this presentation unless otherwise noted is © 2014 Regents of the University of Michigan and licensed under a CC-BY license. http://creativecommons.org/licenses/by/4.0
  2. the dynamic metrics and analytics project ...was initiated with a

    goal of publicly sharing Open.Michigan usage data, identifying interesting patterns in OER use, updating displays of that data dynamically.
  3. a repository and referratory we host and help publish OER

    (http://open.umich.edu) we provide links to third-party platforms and services which host relevant OER
  4. three guides • goals of sharing: how can we open

    data easily? • user research: what do users want? • technical design: what can/should we do with what we have?
  5. interesting corollary questions • how to share usage data? what

    context is needed? • what does “use” mean for us? • how can we share metrics in a sustainable and useful way?
  6. how do we organize OER? A hierarchy of units, courses,

    resources... Image source: Open.Michigan Initiative medical collection, open.umich.edu/education/med, CC-BY http://creativecommons.org/licenses/cc-by/4.0
  7. how do we measure content use? Google Analytics, third-party-platform analytics

    interfaces, access to APIs... Image source: Google Analytics, charts
  8. together: technical architecture … informs information architecture. (e.g. Our hierarchical

    site structure allowed us to easily answer some individual questions with the first phrase release of this project.)
  9. user research → • changes in action/use over time •

    visual clarity • ease of access • availability of totals (lifetime numbers) • evidence of reach • evidence of use
  10. project: second phase Currently in development, a dashboard to share

    raw metrics for individual courses. Image source: Open.Michigan dashboard, in progress. © Regents of the University of Michigan, CC-BY 4.0.
  11. more conclusions • tech architecture informs information architecture • metrics

    can be used to justify costs of OER production, and serve to strengthen relationships • user research may lead to ‘better’ analytics • more to come!
  12. future project endeavors • more data sharing: SlideShare, Amara.org •

    continual development of visuals • movement toward increased analytics • increased data export options
  13. thanks! to all who provided assistance with and support for

    this project, especially: Kevin Coffman, Pieter Kleymeer, Susan Topol, Trisha Paul, Bob Riddle, Stephanie Dascola, Margaret Ann Murphy, Emily Puckett Rodgers, Pierre Clement, Michael Hess, Karen Kost; all interviewees and Open.Michigan Initiative collaborators