Upgrade to Pro — share decks privately, control downloads, hide ads and more …

Hypergraph reconstruction from network data

Hypergraph reconstruction from network data

Preprint: https://arxiv.org/abs/2008.04948
Talk at HONS2020: https://uzhdag.github.io/hons_web/program.html

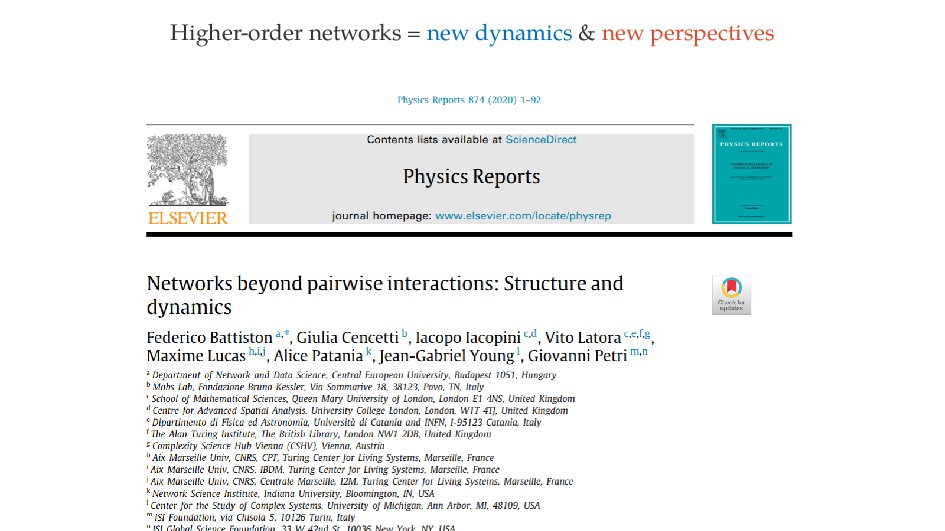
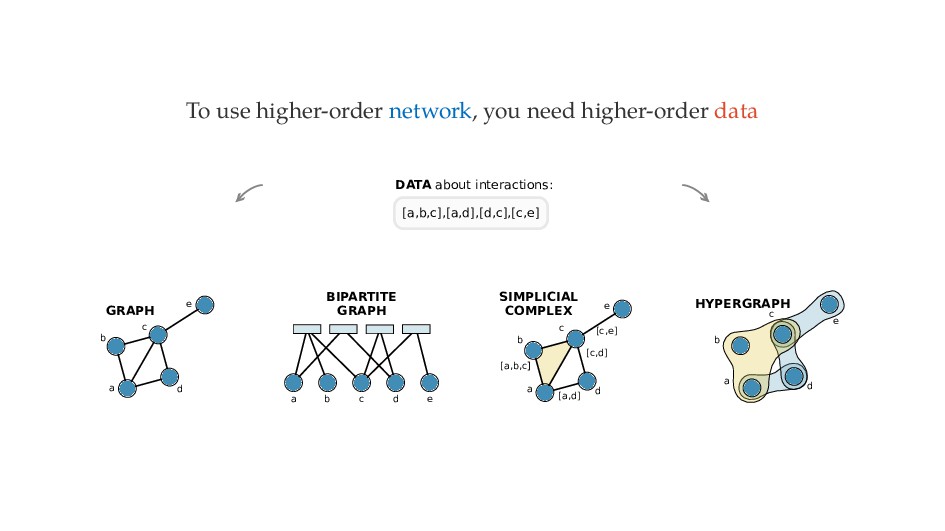
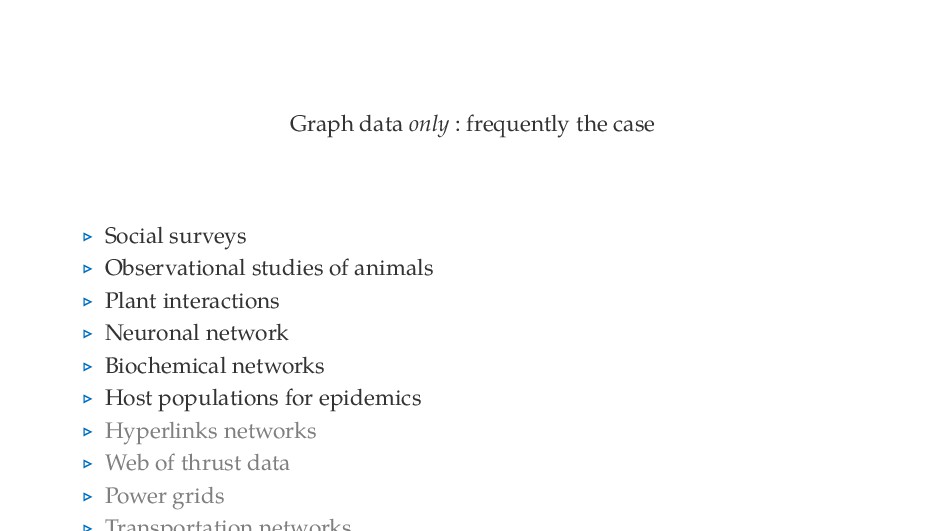
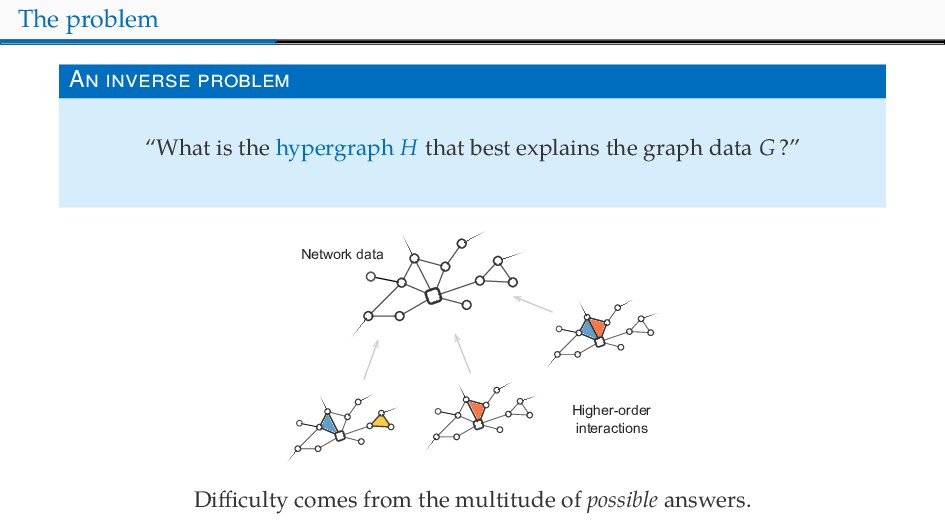
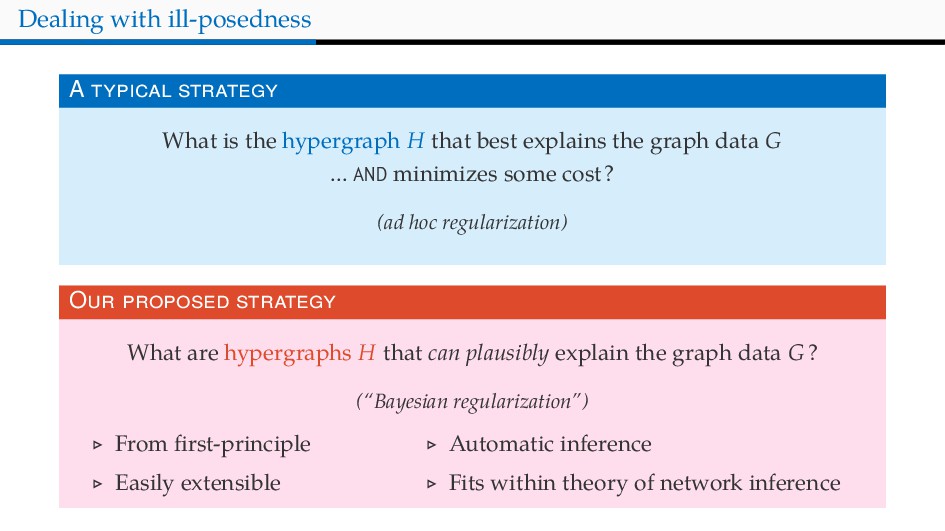
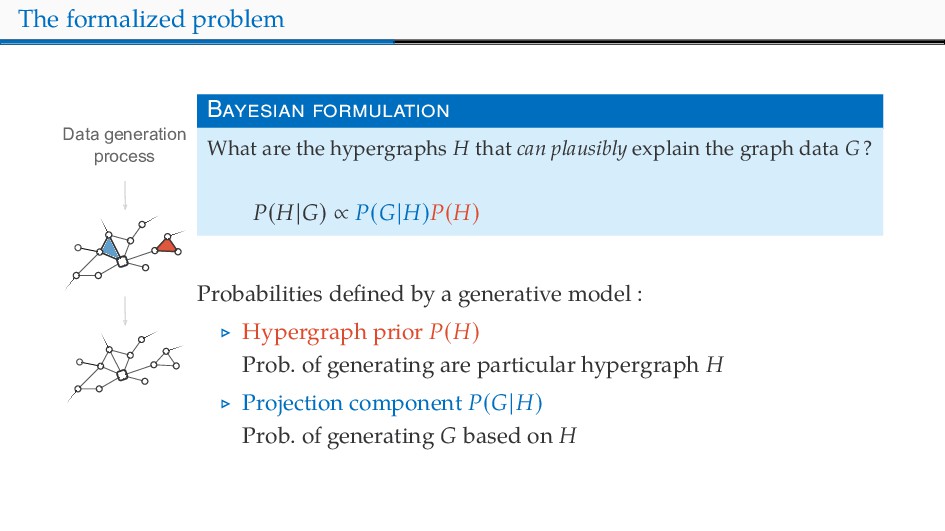
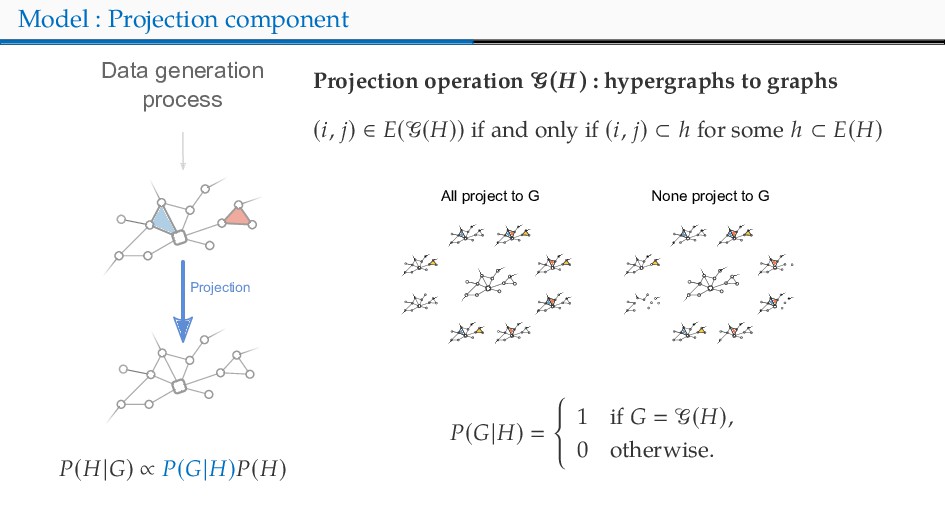
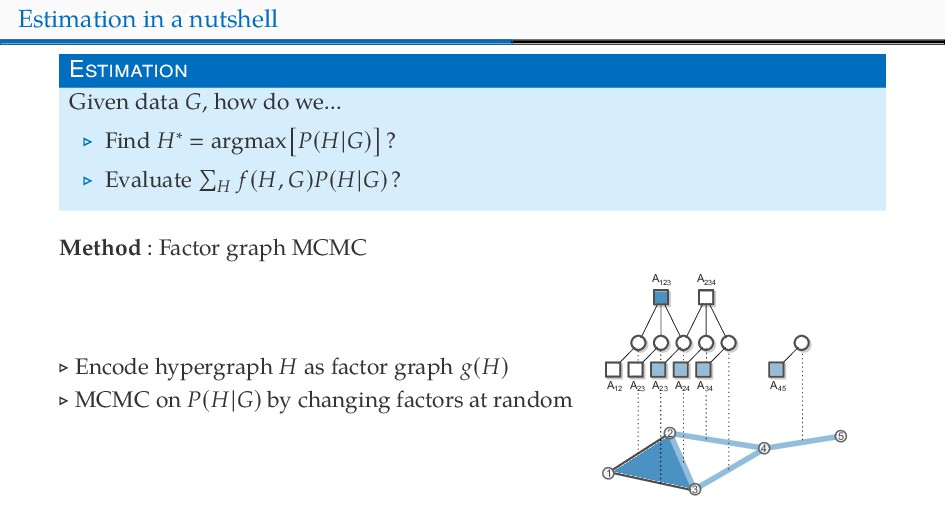
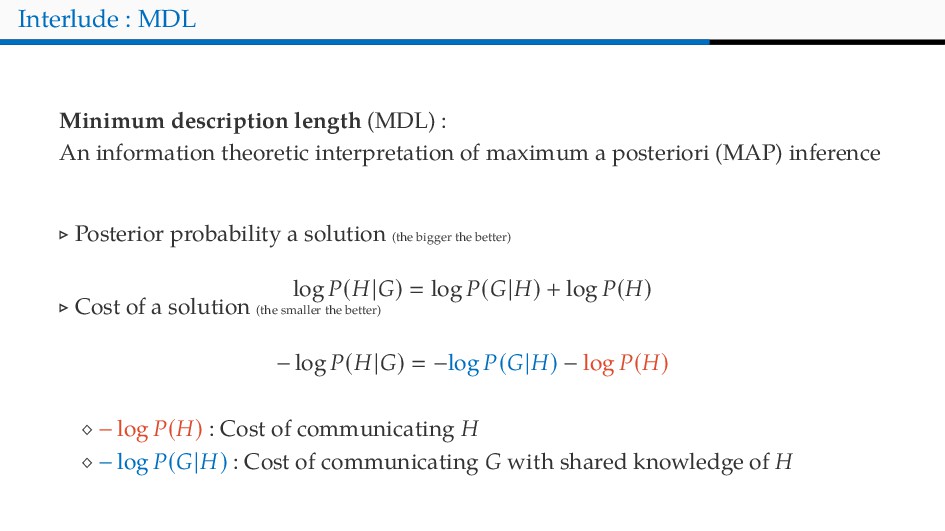
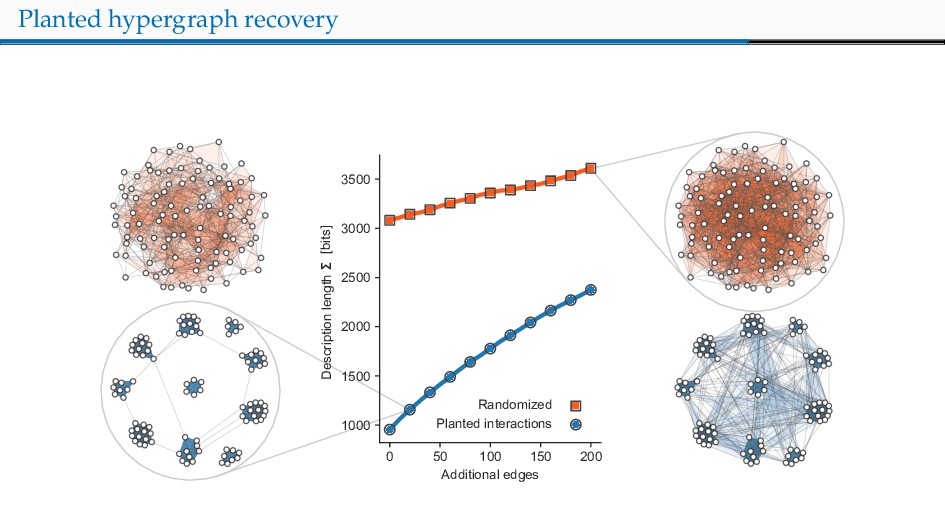
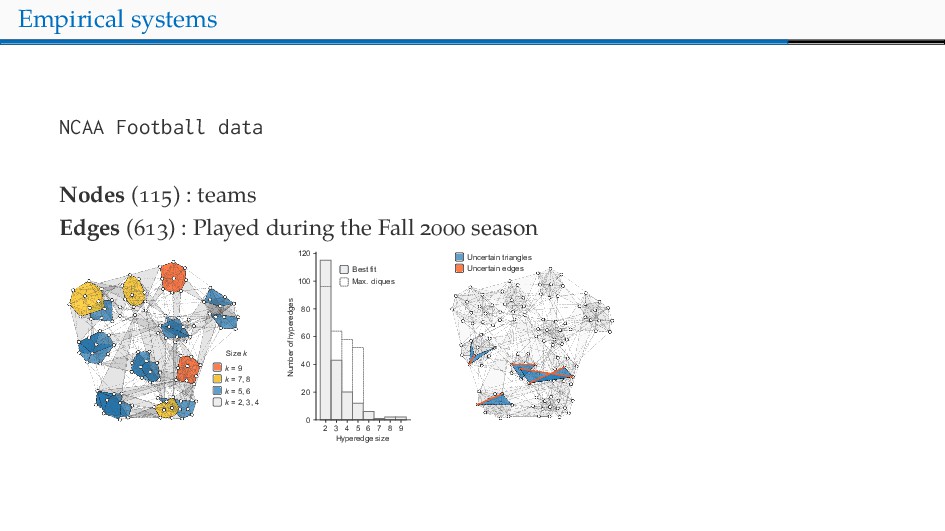
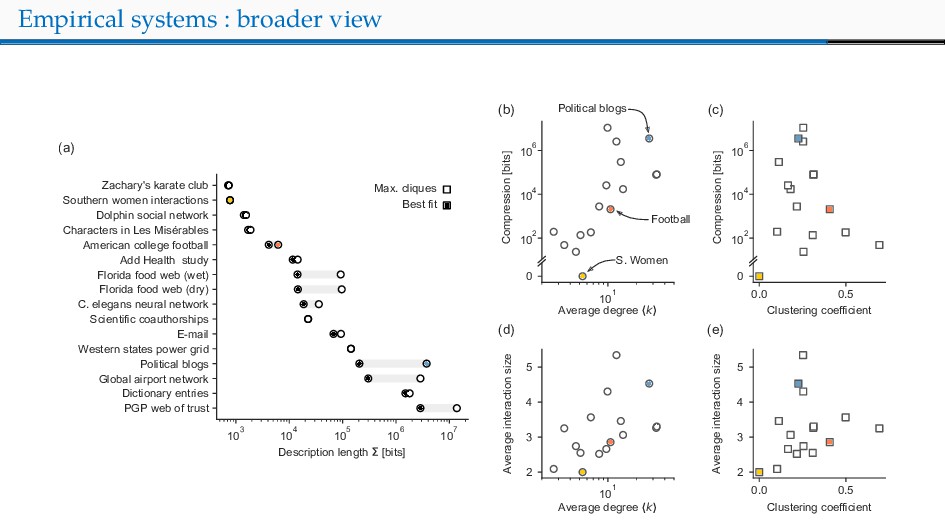
Networks can describe the structure of a wide variety of complex systems by specifying how pairs of nodes interact. This choice of representation is flexible, but not necessarily appropriate when joint interactions between groups of nodes are needed to explain empirical phenomena. Networks remain the de facto standard, however, as relational datasets often fail to include higher-order interactions. Here, we introduce a Bayesian approach to reconstruct these missing higher-order interactions, from pairwise network data. Our method is based on the principle of parsimony and only includes higher-order structures when there is sufficient statistical evidence for them.

Jean-Gabriel Young

September 17, 2020
Tweet

More Decks by Jean-Gabriel Young

Other Decks in Science

Transcript

  1. H HONS Jean-Gabriel Young Department of Computer Science, University of

    Vermont, Burlington, VT, USA jg-you.github.io @_jgyou [email protected] Joint work with Giovanni Petri and Tiago P. Peixoto arXiv:2008.04948
  2. To use higher-order network, you need higher-order data DATA about

    interactions: [a,b,c],[a,d],[d,c],[c,e] a b c e d [a,b,c] [a,d] [c,d] [c,e] ] SIMPLICIAL COMPLEX a b c e d HYPERGRAPH a b c d e BIPARTITE GRAPH GRAPH a b c e d
  3. Graph data only : frequently the case ⊲ Social surveys

    ⊲ Observational studies of animals ⊲ Plant interactions ⊲ Neuronal network ⊲ Biochemical networks ⊲ Host populations for epidemics ⊲ Hyperlinks networks ⊲ Web of thrust data ⊲ Power grids
  4. T

  5. The problem A “What is the hypergraph that best explains

    the graph data ?” Network data Higher-order interactions Difficulty comes from the multitude of possible answers.
  6. Dealing with ill-posedness A What is the hypergraph that best

    explains the graph data ... AND minimizes some cost? (ad hoc regularization) O What are hypergraphs that can plausibly explain the graph data ? (“Bayesian regularization”) ⊲ From first-principle ⊲ Easily extensible ⊲ Automatic inference ⊲ Fits within theory of network inference
  7. B

  8. The formalized problem Data generation process B What are the

    hypergraphs that can plausibly explain the graph data ? ( | ) ∝ ( | ) ( ) Probabilities defined by a generative model : ⊲ Hypergraph prior ( ) Prob. of generating are particular hypergraph ⊲ Projection component ( | ) Prob. of generating based on
  9. Model : Hypergraph prior Data generation process Prior ( |

    ) ∝ ( | ) ( ) Poisson Random Hypergraph Model (PRHM) R. W. Darling and J. R. Norris. Ann. Appl. Probab. ( ). Connect every sets of nodes of size = 2, 3, ..., with a Poisson number of hyperedge (i.i.d.) ( 1,.., | ) = 1,.., 1,.., ! − , ( | ) = =2 1,..., ( 1,.., | ) * We improve the fit with a hierarchical model ∼ Exp( ) and fixed empirically
  10. Model : Projection component Data generation process Projection ( |

    ) ∝ ( | ) ( ) Projection operation G( ) : hypergraphs to graphs ( , ) ∈ (G( )) if and only if ( , ) ⊂ ℎ for some ℎ ⊂ ( ) All project to G None project to G ( | ) = 1 if = G( ), 0 otherwise.
  11. Estimation in a nutshell E Given data , how do

    we... ⊲ Find ∗ = argmax ( | ) ? ⊲ Evaluate ( , ) ( | )? Method : Factor graph MCMC ⊲ Encode hypergraph as factor graph ( ) ⊲ MCMC on ( | ) by changing factors at random 1 2 3 4 5 A 12 A 23 A 23 A 24 A 34 A 123 A 234 A 45
  12. E

  13. Planted hypergraph recovery RQ : What happens when we feed

    a known hypergraph to the method? Generate Project as = G( ) Guess ∗
  14. Planted hypergraph recovery RQ : What happens when we feed

    a known hypergraph to the method? Generate +noise Project as = G( ) Guess ∗
  15. Planted hypergraph recovery RQ : What happens when we feed

    a known hypergraph to the method? Generate +noise Project as = G( ) +randomize Guess ∗
  16. Interlude : MDL Minimum description length (MDL) : An information

    theoretic interpretation of maximum a posteriori (MAP) inference ⊲ Posterior probability a solution (the bigger the better) log ( | ) = log ( | ) + log ( ) ⊲ Cost of a solution (the smaller the better) − log ( | ) = −log ( | ) − log ( ) − log ( ) : Cost of communicating − log ( | ) : Cost of communicating with shared knowledge of
  17. Planted hypergraph recovery 0 50 100 150 200 Additional edges

    1000 1500 2000 2500 3000 3500 Description length Randomized Planted interactions [bits]
  18. Empirical systems NCAA Footba data Nodes ( ) : teams

    Edges ( ) : Played during the Fall season k = 9 k = 7, 8 k = 5, 6 k = 2, 3, 4 Size k 2 3 4 5 6 7 8 9 Hyperedge size 0 20 40 60 80 100 120 Number of hyperedges Best fit Max. cliques Uncertain edges Uncertain triangles
  19. Empirical systems : broader view 0.0 0.5 Clustering coefficient 102

    104 106 Compression [bits] 101 Average degree k 102 104 106 Compression [bits] (a) (c) (b) (e) (d) Football 103 104 105 106 107 Description length [bits] PGP web of trust Dictionary entries Global airport network Political blogs Western states power grid E-mail Scientific coauthorships C. elegans neural network Florida food web (dry) Florida food web (wet) Add Health study American college football Characters in Les Misérables Dolphin social network Southern women interactions Zachary's karate club Max. cliques Best fit 0.0 0.5 Clustering coefficient 2 3 4 5 Average interaction size 0 0 101 Average degree k 2 3 4 5 Average interaction size Political blogs S. Women
  20. D

  21. Open problems U HON ? Insight : We can compress

    a handful of system as hypergraph Question : Systematic study I Insight : We can recover from Question : How useful is when predic- ting dynamics on ? On latent ? F Lesson : MCMC can be slow Question : Borrow from minimal clique cover algorithms? B PRHM Lesson : PRHM is not a realistic process Question : What is the impact of changing models?
  22. Take-home message ⊲ Networks : often pairwise P.O.V. on higher-order

    networks. ⊲ Can reconstruct these HONs, but it is an ill-posed problem. ⊲ We solved the problem with Bayesian reconstruction techniques. ⊲ Found higher-order interactions in empirical and synthetic data. ⊲ ∃ many open problems. ⊲ References : arXiv: . ⊲ Software : graph-too (graph-tool.skewed.de)