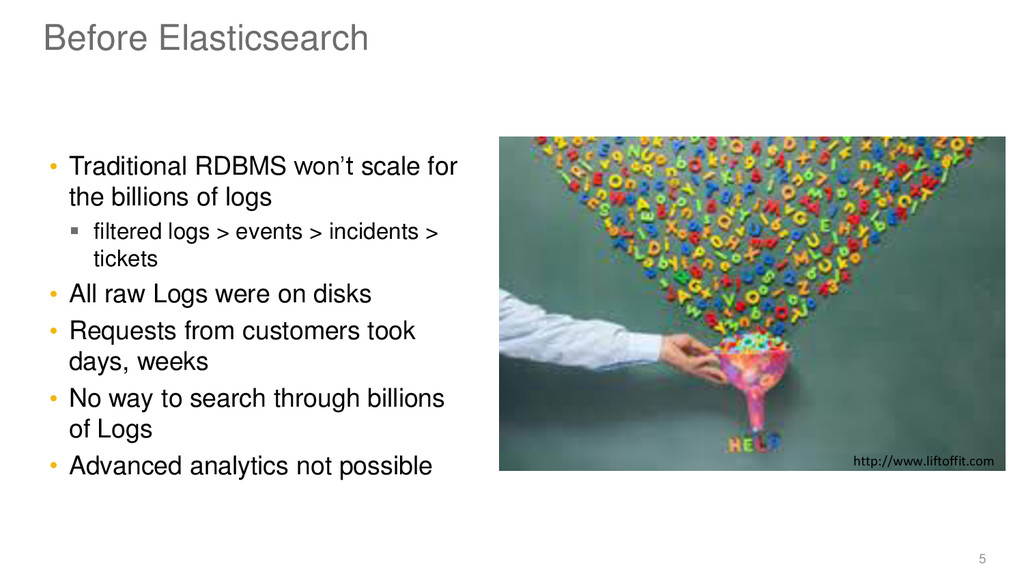
of logs filtered logs > events > incidents > tickets • All raw Logs were on disks • Requests from customers took days, weeks • No way to search through billions of Logs • Advanced analytics not possible 5 http://www.liftoffit.com
logs near real-time can search and download their logs through the Portal visualize/analyze using Kibana • Operations No more grep through disks • Opens up the data for all kind of Analytics and Monitoring Anomaly detection Real-time alerting Advanced monitoring 6
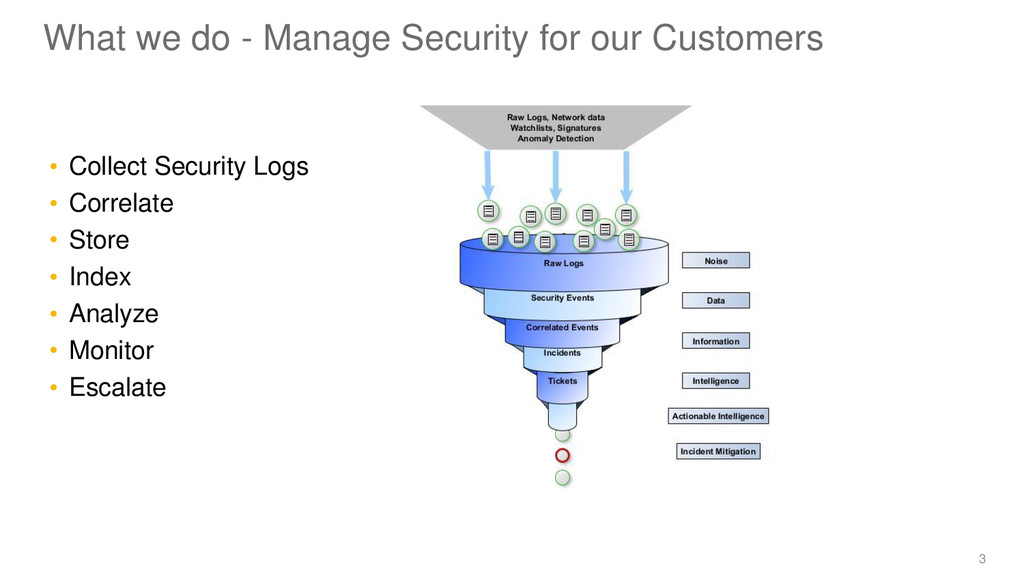
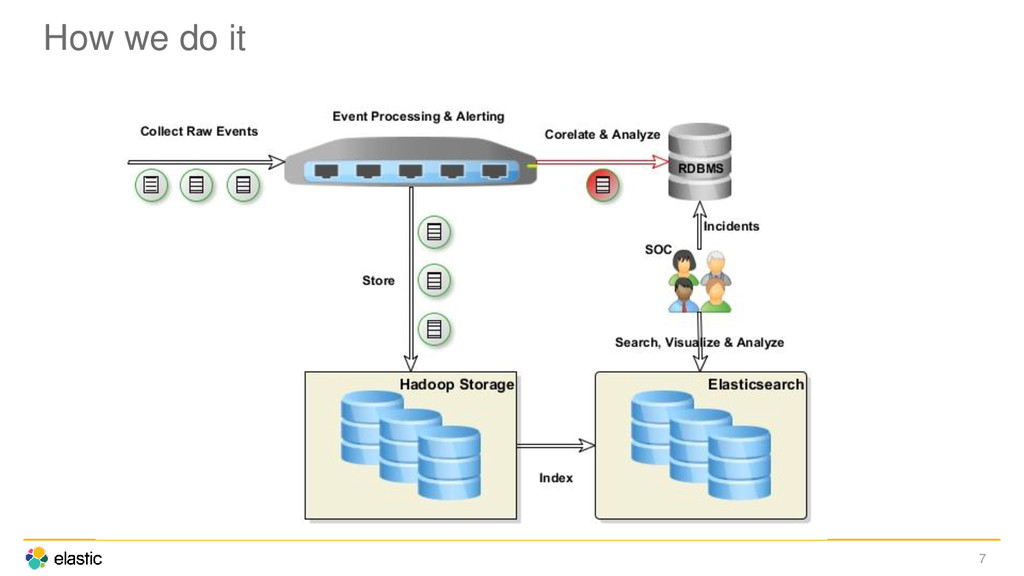
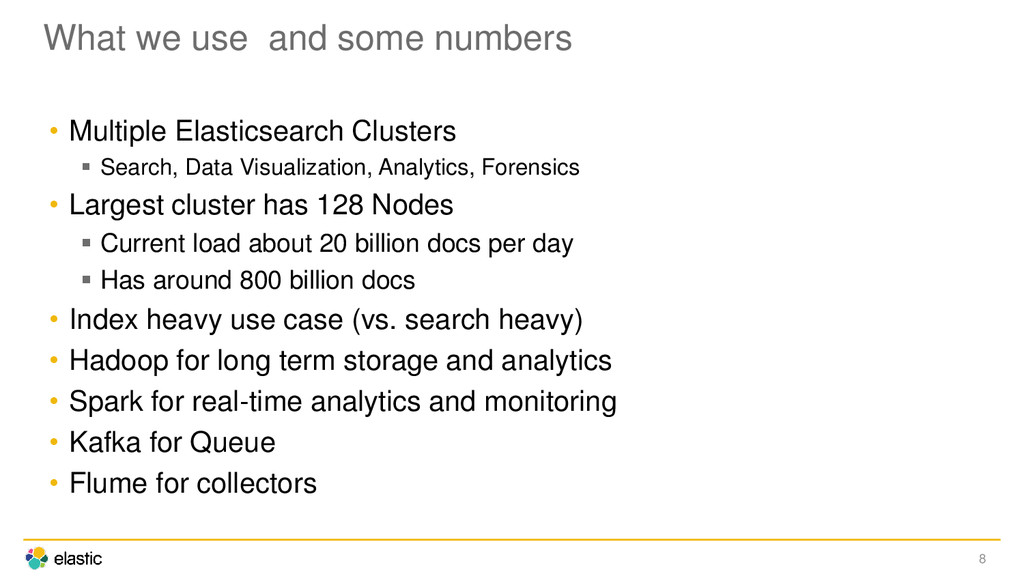
Search, Data Visualization, Analytics, Forensics • Largest cluster has 128 Nodes Current load about 20 billion docs per day Has around 800 billion docs • Index heavy use case (vs. search heavy) • Hadoop for long term storage and analytics • Spark for real-time analytics and monitoring • Kafka for Queue • Flume for collectors 8
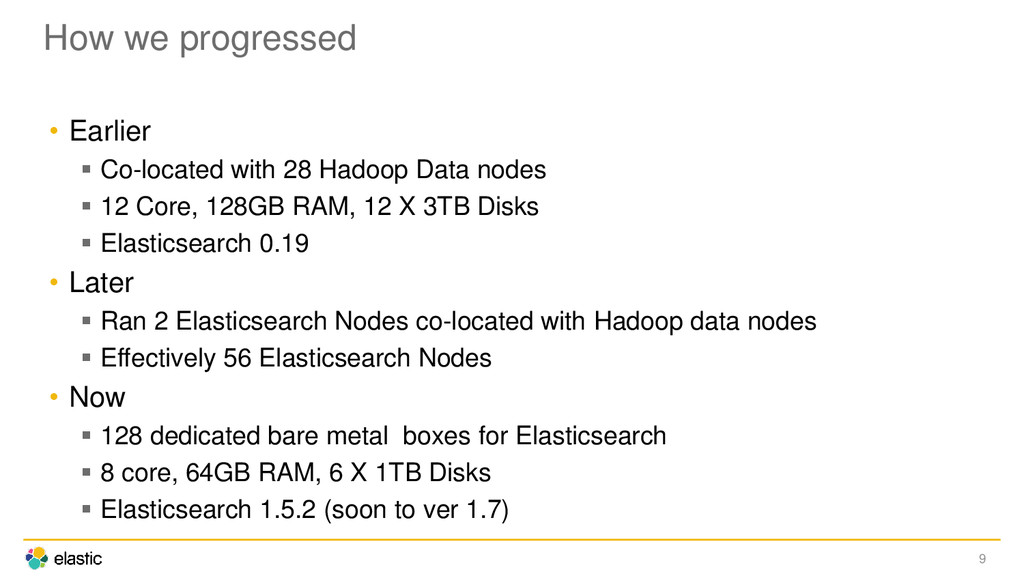
Data nodes 12 Core, 128GB RAM, 12 X 3TB Disks Elasticsearch 0.19 • Later Ran 2 Elasticsearch Nodes co-located with Hadoop data nodes Effectively 56 Elasticsearch Nodes • Now 128 dedicated bare metal boxes for Elasticsearch 8 core, 64GB RAM, 6 X 1TB Disks Elasticsearch 1.5.2 (soon to ver 1.7) 9
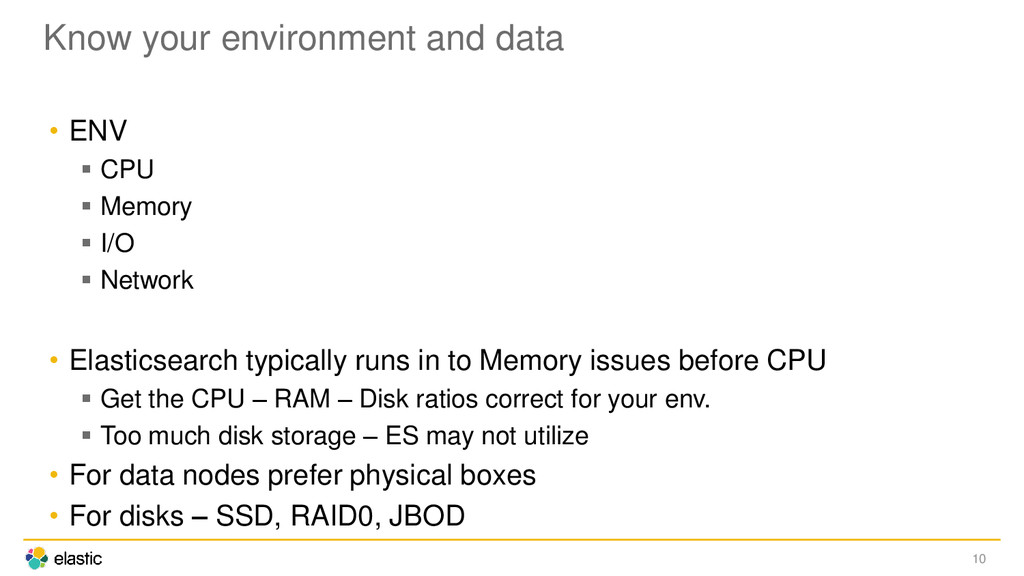
Memory I/O Network • Elasticsearch typically runs in to Memory issues before CPU Get the CPU – RAM – Disk ratios correct for your env. Too much disk storage – ES may not utilize • For data nodes prefer physical boxes • For disks – SSD, RAID0, JBOD 10
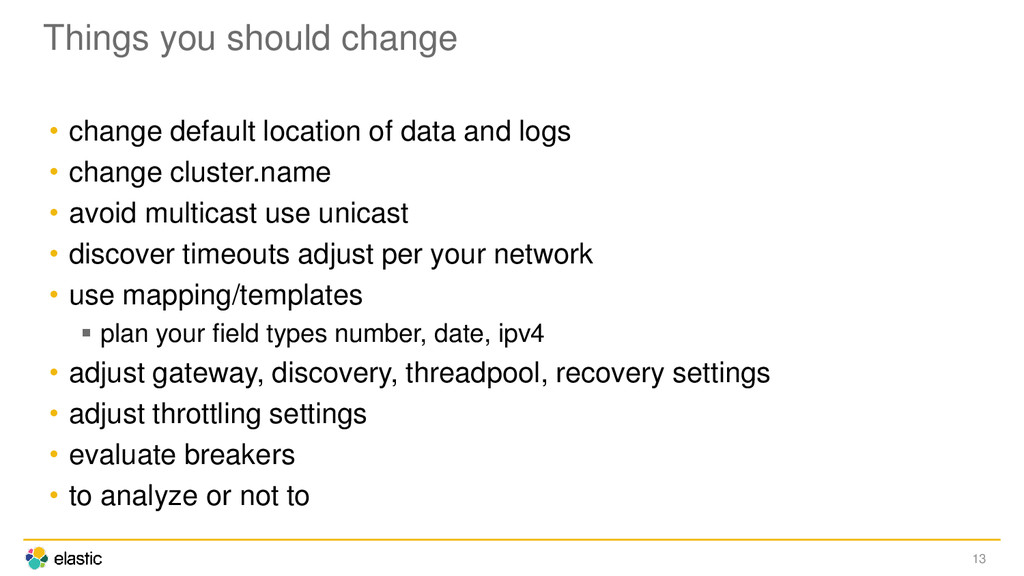
and logs • change cluster.name • avoid multicast use unicast • discover timeouts adjust per your network • use mapping/templates plan your field types number, date, ipv4 • adjust gateway, discovery, threadpool, recovery settings • adjust throttling settings • evaluate breakers • to analyze or not to 13
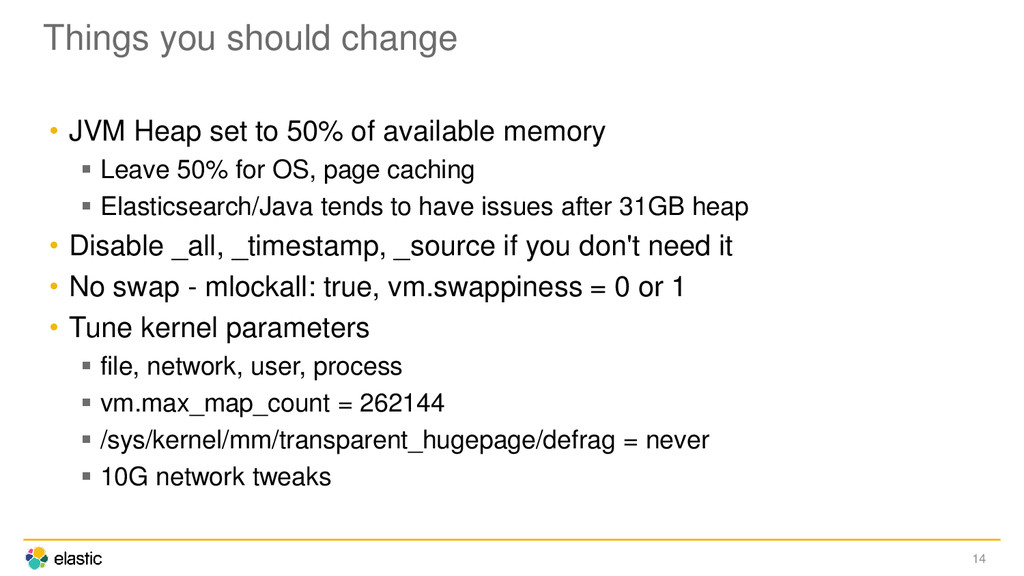
50% of available memory Leave 50% for OS, page caching Elasticsearch/Java tends to have issues after 31GB heap • Disable _all, _timestamp, _source if you don't need it • No swap - mlockall: true, vm.swappiness = 0 or 1 • Tune kernel parameters file, network, user, process vm.max_map_count = 262144 /sys/kernel/mm/transparent_hugepage/defrag = never 10G network tweaks
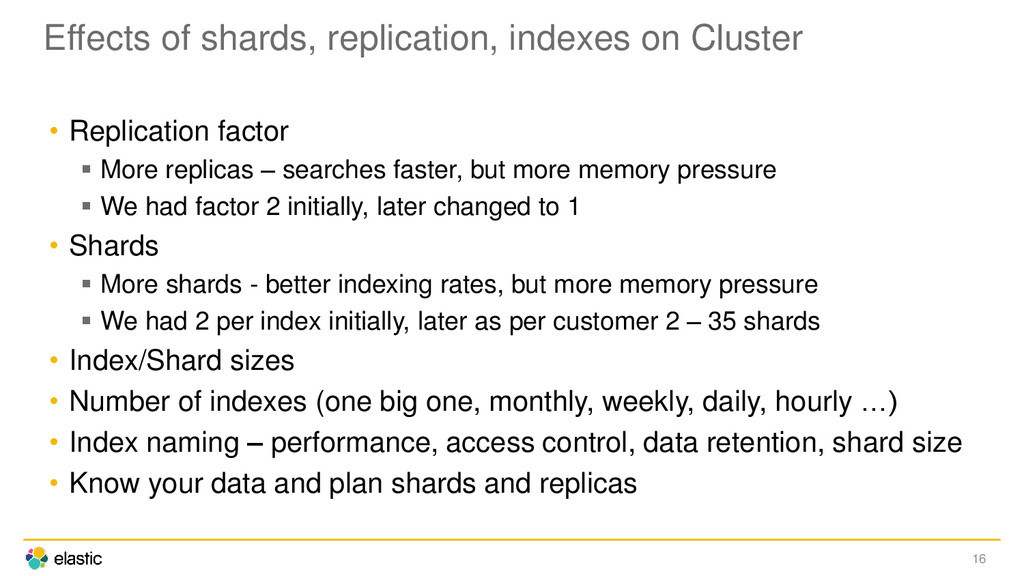
More replicas – searches faster, but more memory pressure We had factor 2 initially, later changed to 1 • Shards More shards - better indexing rates, but more memory pressure We had 2 per index initially, later as per customer 2 – 35 shards • Index/Shard sizes • Number of indexes (one big one, monthly, weekly, daily, hourly …) • Index naming – performance, access control, data retention, shard size • Know your data and plan shards and replicas 16
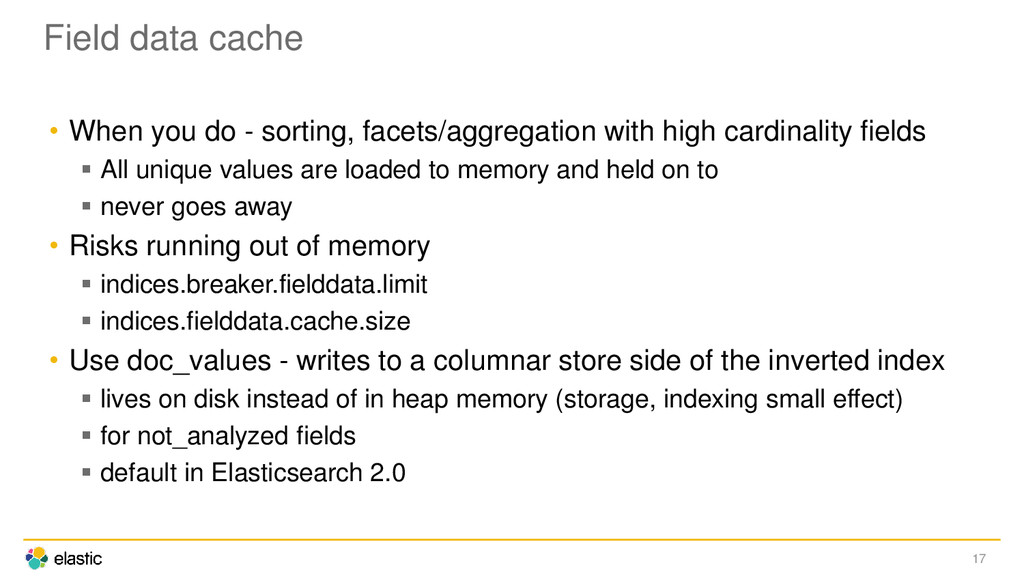
facets/aggregation with high cardinality fields All unique values are loaded to memory and held on to never goes away • Risks running out of memory indices.breaker.fielddata.limit indices.fielddata.cache.size • Use doc_values - writes to a columnar store side of the inverted index lives on disk instead of in heap memory (storage, indexing small effect) for not_analyzed fields default in Elasticsearch 2.0
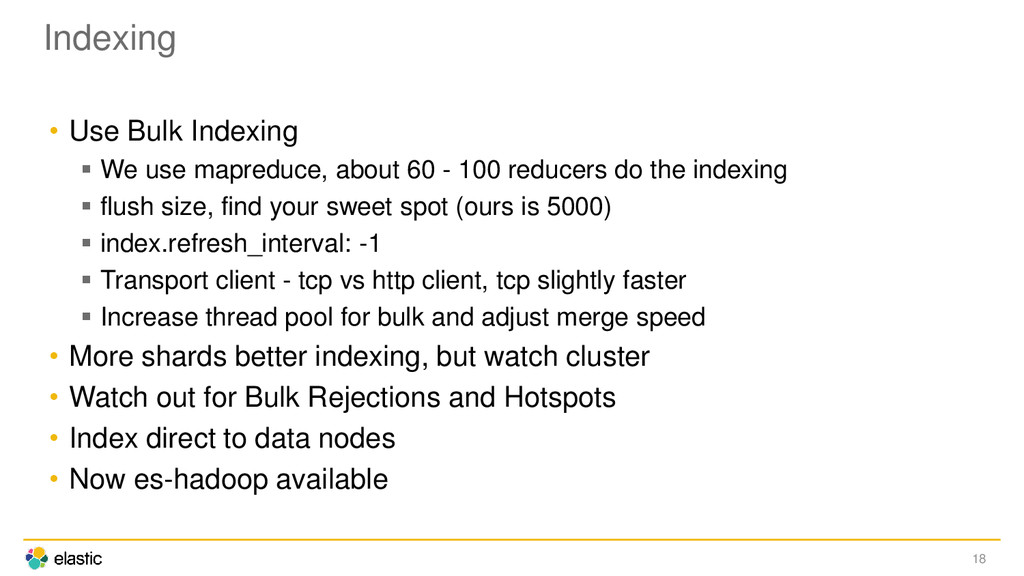
60 - 100 reducers do the indexing flush size, find your sweet spot (ours is 5000) index.refresh_interval: -1 Transport client - tcp vs http client, tcp slightly faster Increase thread pool for bulk and adjust merge speed • More shards better indexing, but watch cluster • Watch out for Bulk Rejections and Hotspots • Index direct to data nodes • Now es-hadoop available 18
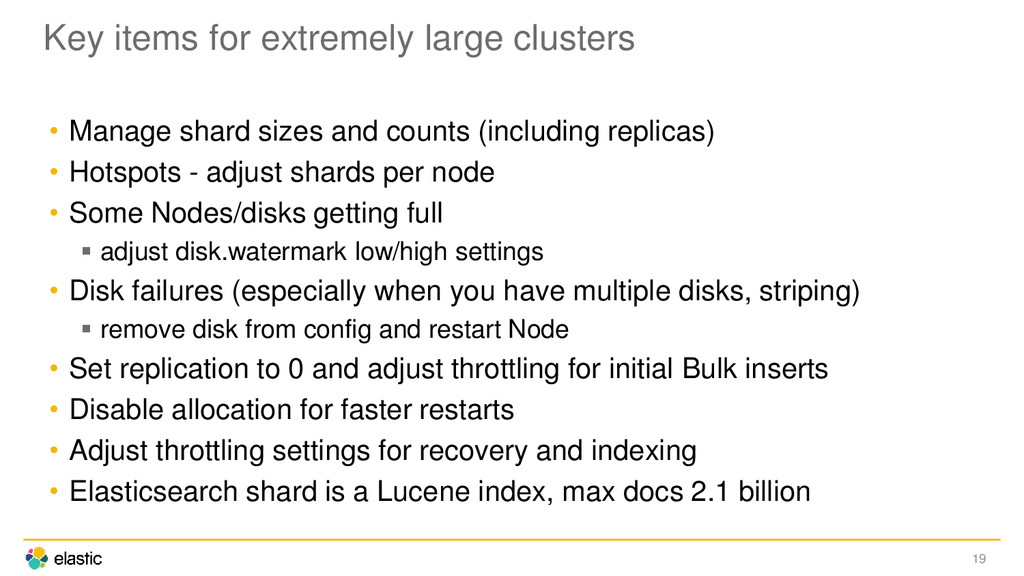
sizes and counts (including replicas) • Hotspots - adjust shards per node • Some Nodes/disks getting full adjust disk.watermark low/high settings • Disk failures (especially when you have multiple disks, striping) remove disk from config and restart Node • Set replication to 0 and adjust throttling for initial Bulk inserts • Disable allocation for faster restarts • Adjust throttling settings for recovery and indexing • Elasticsearch shard is a Lucene index, max docs 2.1 billion
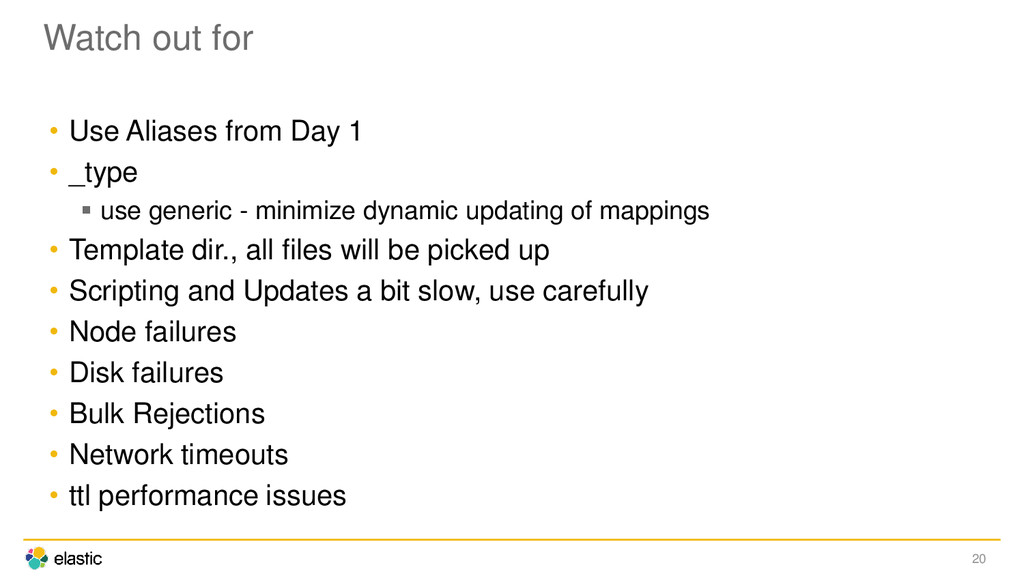
• _type use generic - minimize dynamic updating of mappings • Template dir., all files will be picked up • Scripting and Updates a bit slow, use carefully • Node failures • Disk failures • Bulk Rejections • Network timeouts • ttl performance issues
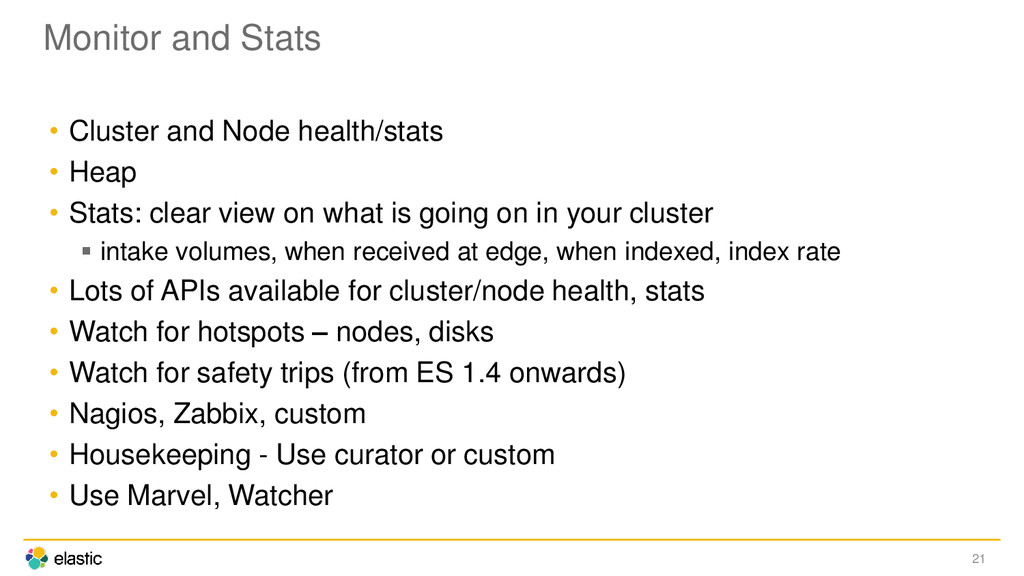
Heap • Stats: clear view on what is going on in your cluster intake volumes, when received at edge, when indexed, index rate • Lots of APIs available for cluster/node health, stats • Watch for hotspots – nodes, disks • Watch for safety trips (from ES 1.4 onwards) • Nagios, Zabbix, custom • Housekeeping - Use curator or custom • Use Marvel, Watcher
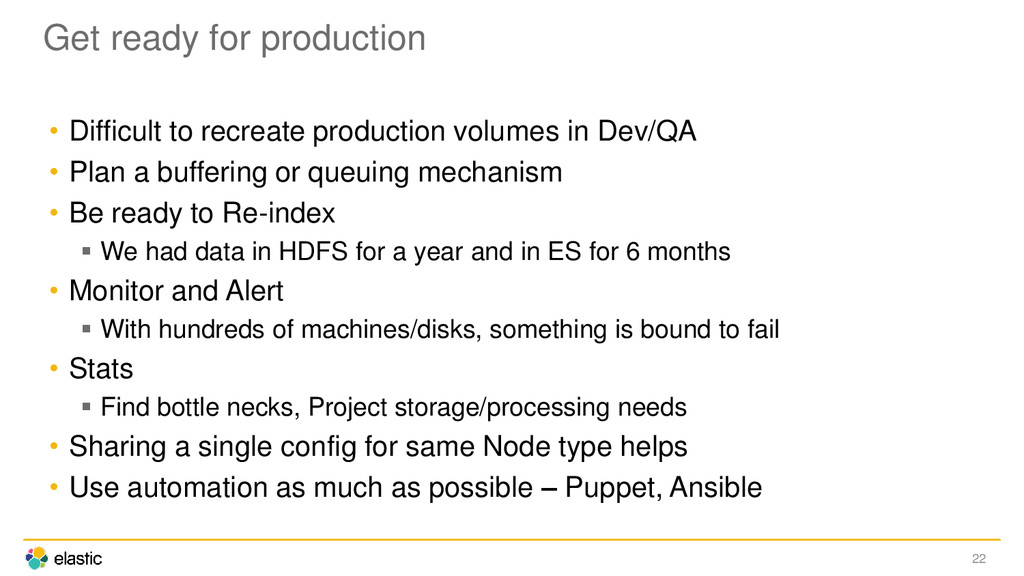
in Dev/QA • Plan a buffering or queuing mechanism • Be ready to Re-index We had data in HDFS for a year and in ES for 6 months • Monitor and Alert With hundreds of machines/disks, something is bound to fail • Stats Find bottle necks, Project storage/processing needs • Sharing a single config for same Node type helps • Use automation as much as possible – Puppet, Ansible 22
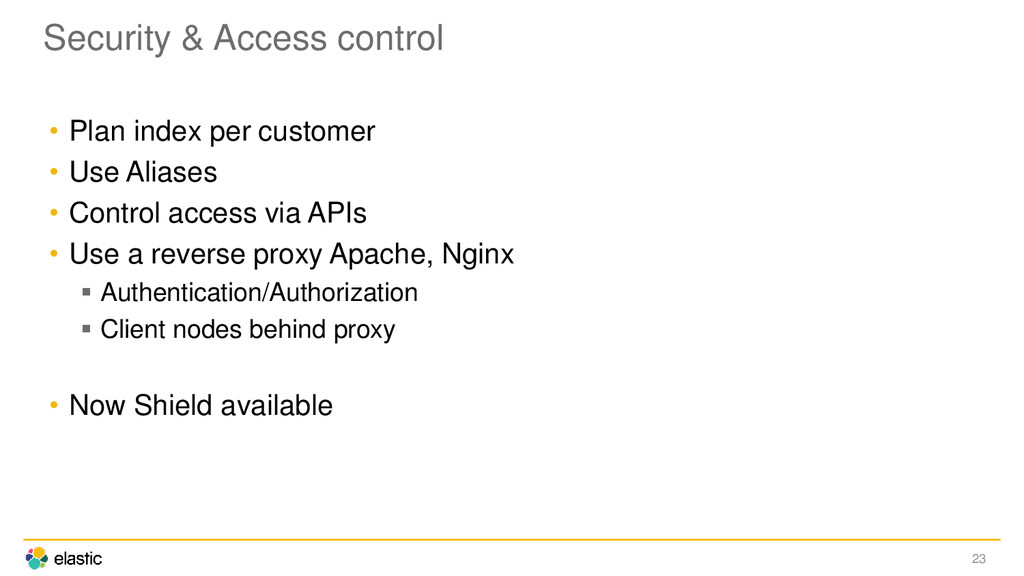
Use Aliases • Control access via APIs • Use a reverse proxy Apache, Nginx Authentication/Authorization Client nodes behind proxy • Now Shield available 23