Upgrade to Pro — share decks privately, control downloads, hide ads and more …

SixFifty's Story: Why Are UK Elections So Hard To Predict?

John Sandall
September 20, 2017

SixFifty's Story: Why Are UK Elections So Hard To Predict?

Presented at the Applied Data Engineering meetup, London, September 2017.

https://www.meetup.com/Applied-Data-Engineering-London/events/242957677/

---

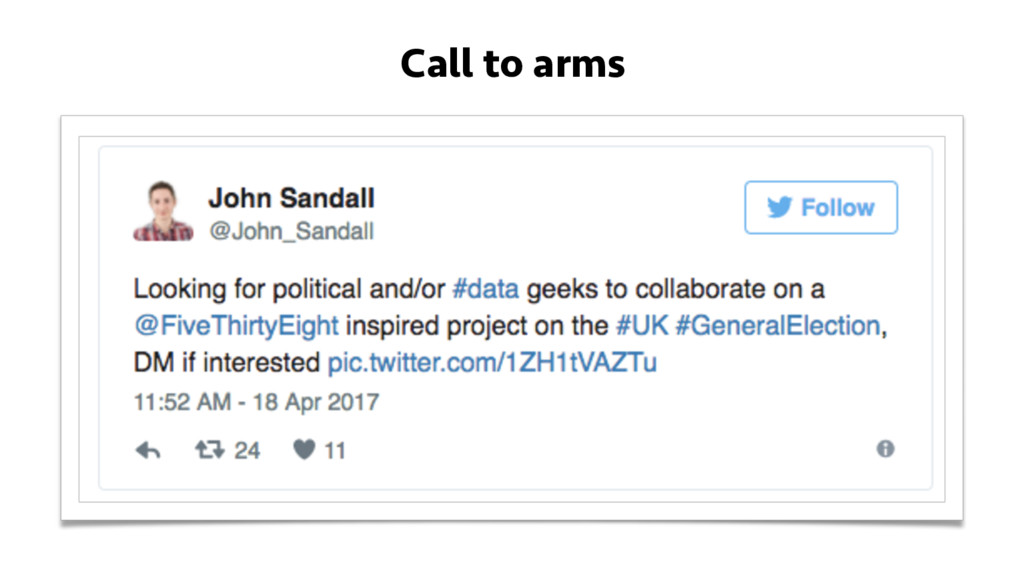
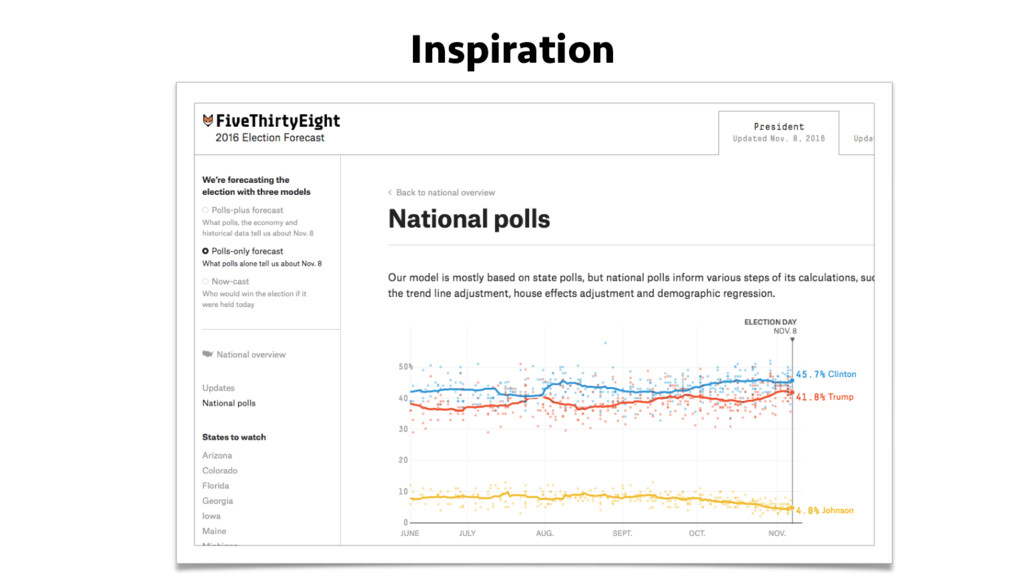
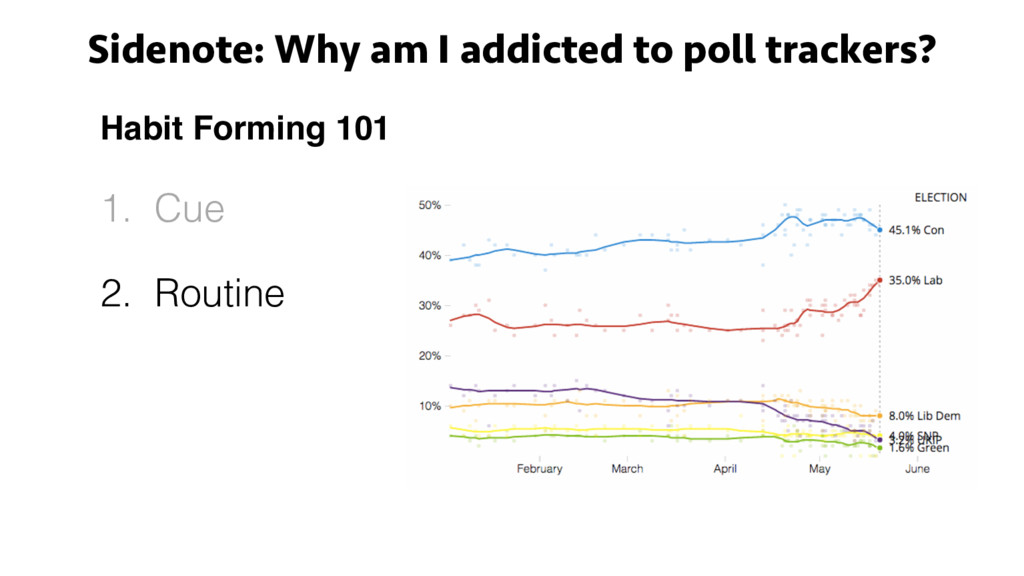
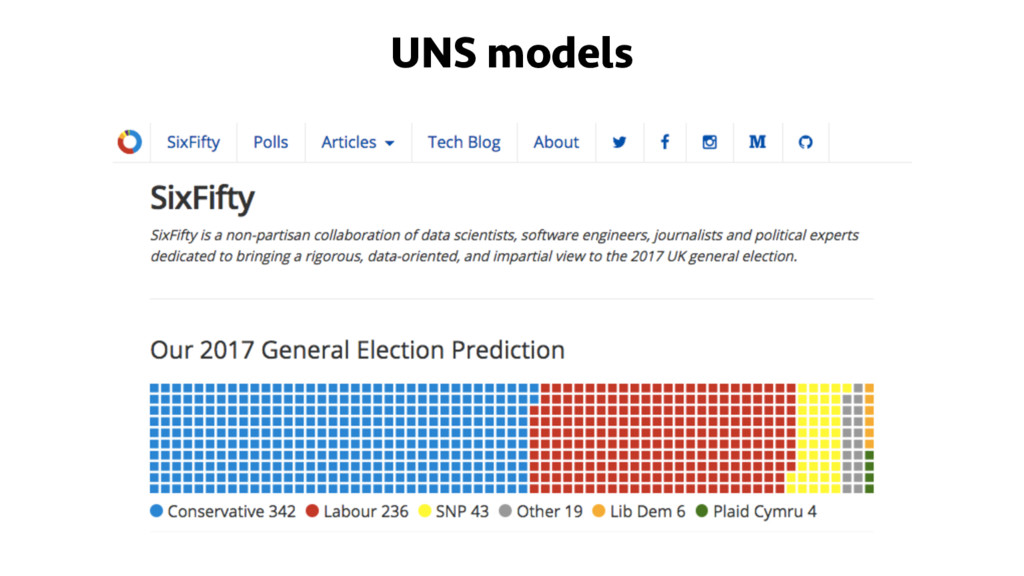
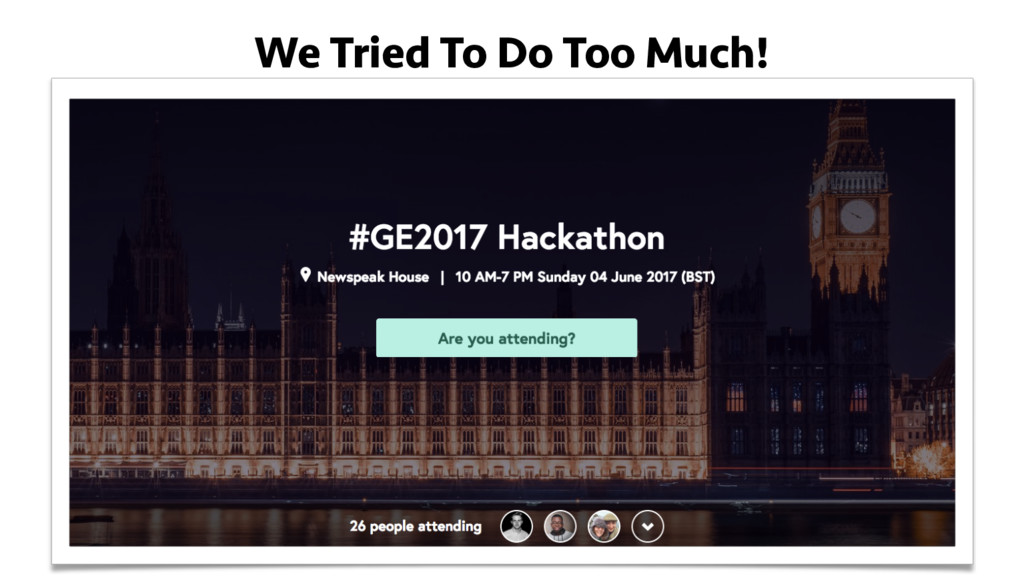
When Theresa May announced plans on April 18th for the UK to hold a general election it was met with much cynicism. However, as self-confessed psephologists (and huge fans of Nate Silver's FiveThirtyEight datablog), we instead were thrilled at the opportunity. SixFifty is a collaboration of data scientists, software engineers, data journalists and political operatives brought together within hours of the snap general election being announced.
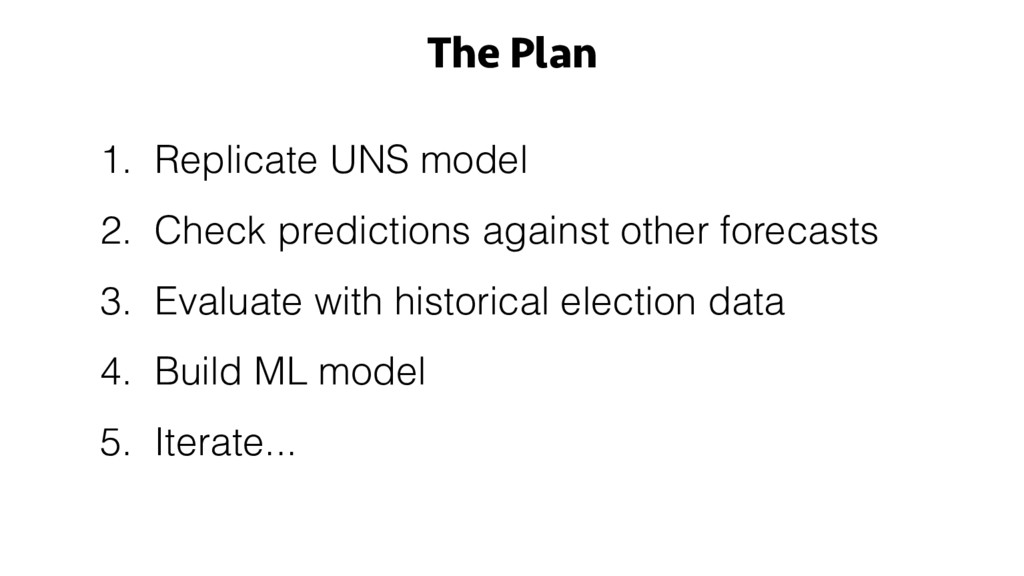
Our goals:

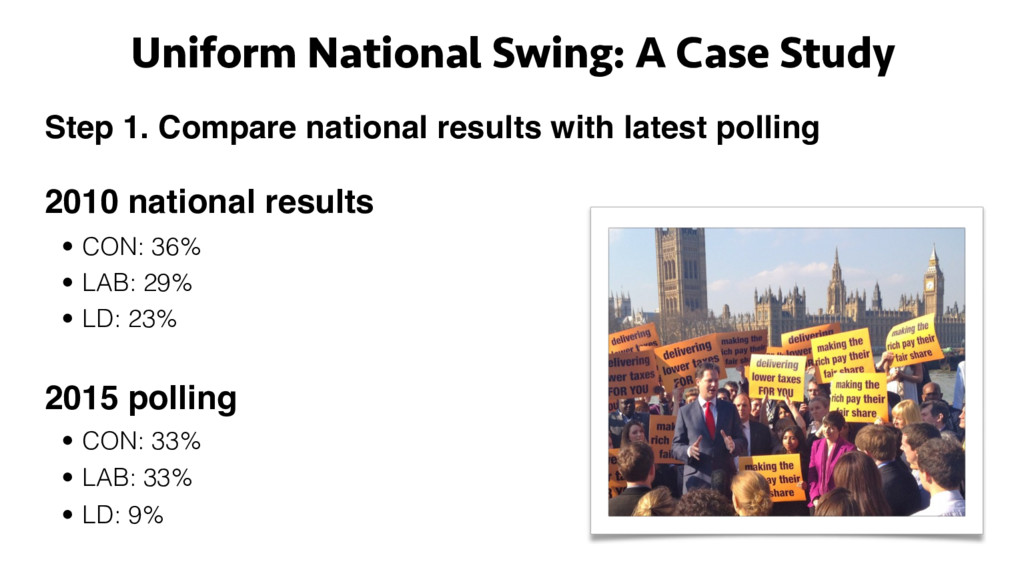
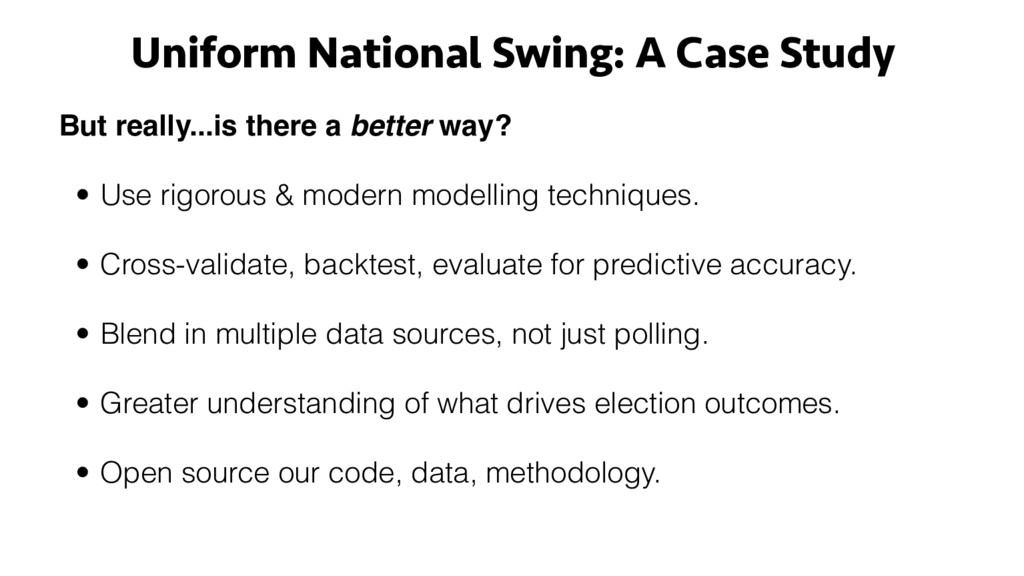
• Understand why forecasting elections in the UK using open data is notoriously difficult, and to see how far good statistical practice and modern machine learning methods can take us.

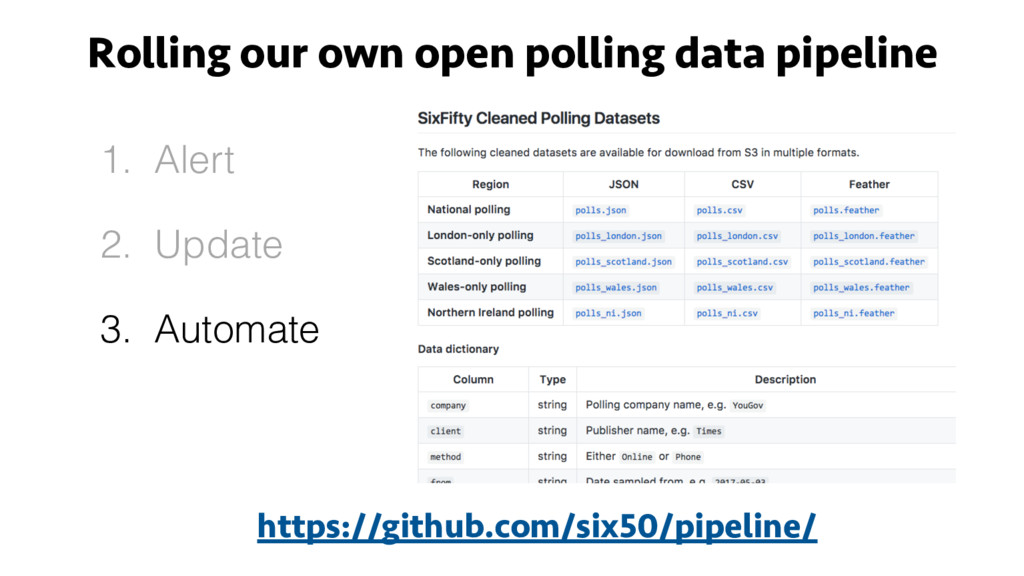
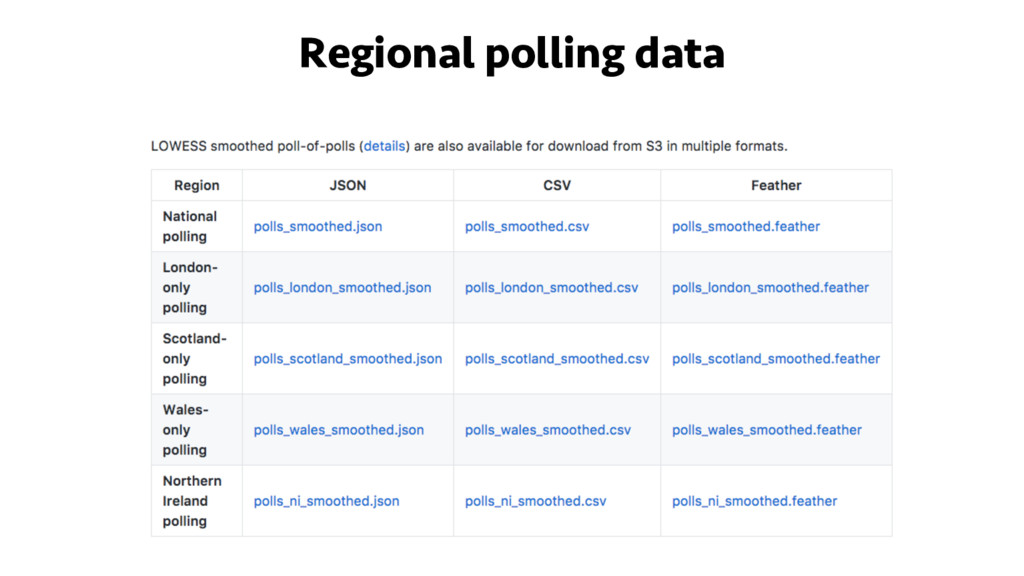
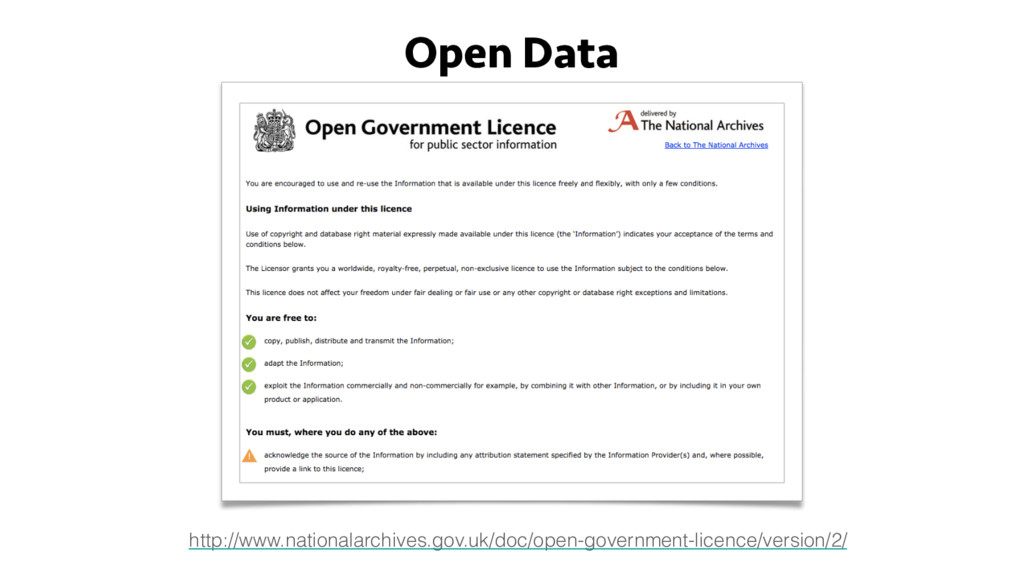
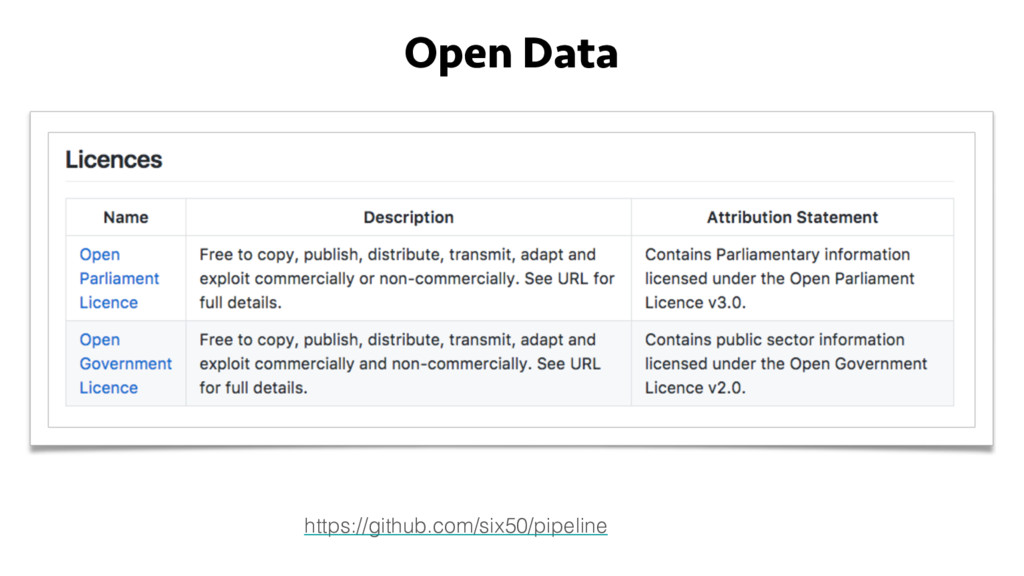
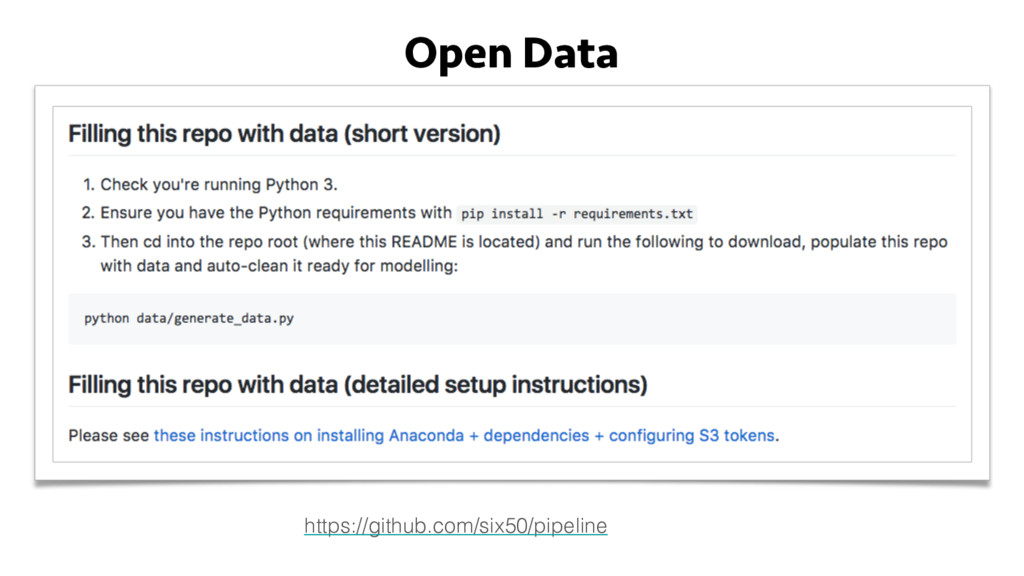
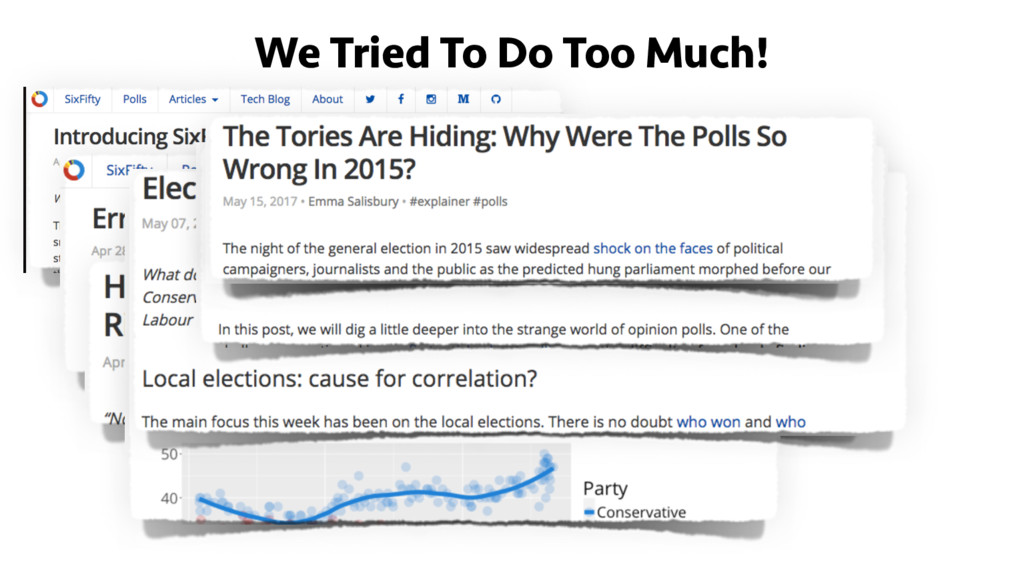
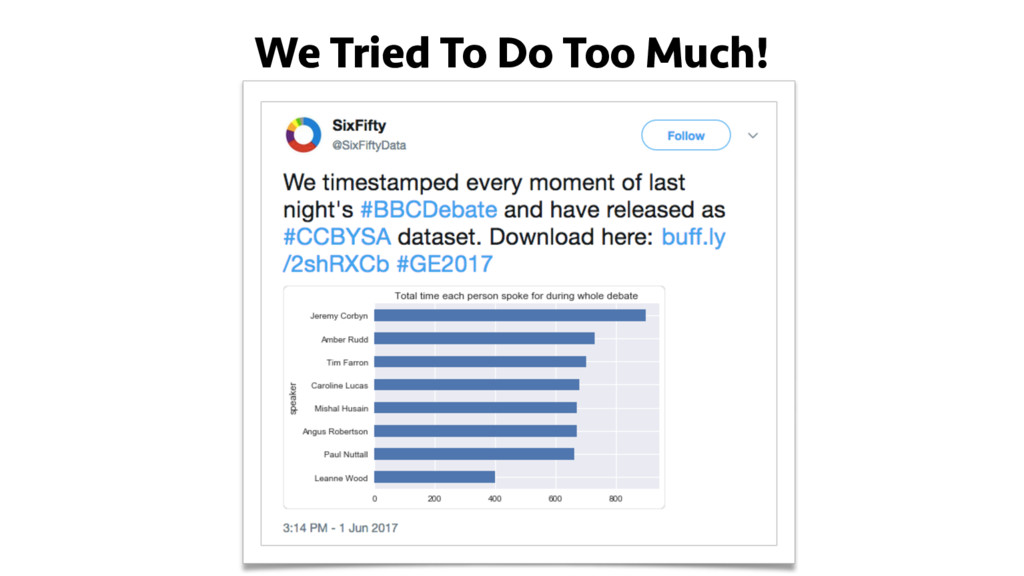
• Make political and demographic data more open and accessible by showcasing and releasing cleaned versions of the datasets we're using.

• We also hope that by communicating our methodology at a non-technical level we will contribute to improving statistical literacy, especially around concepts fundamental to elections, polling and open data.

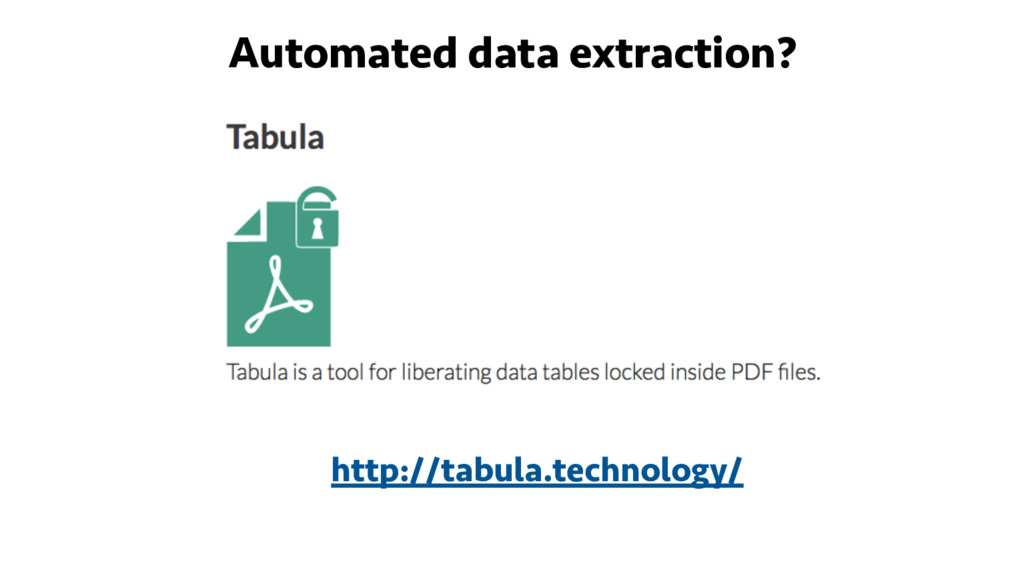
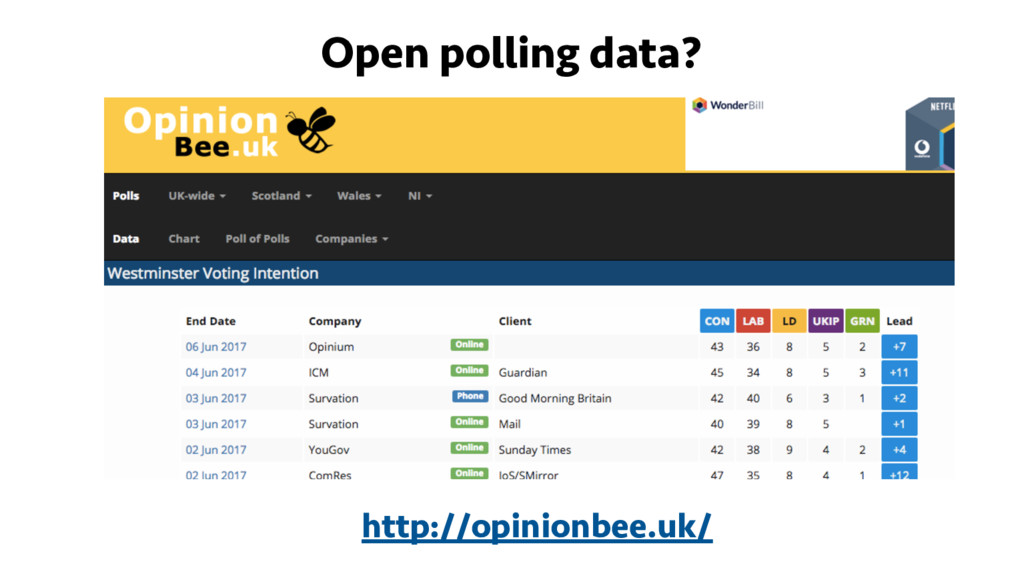
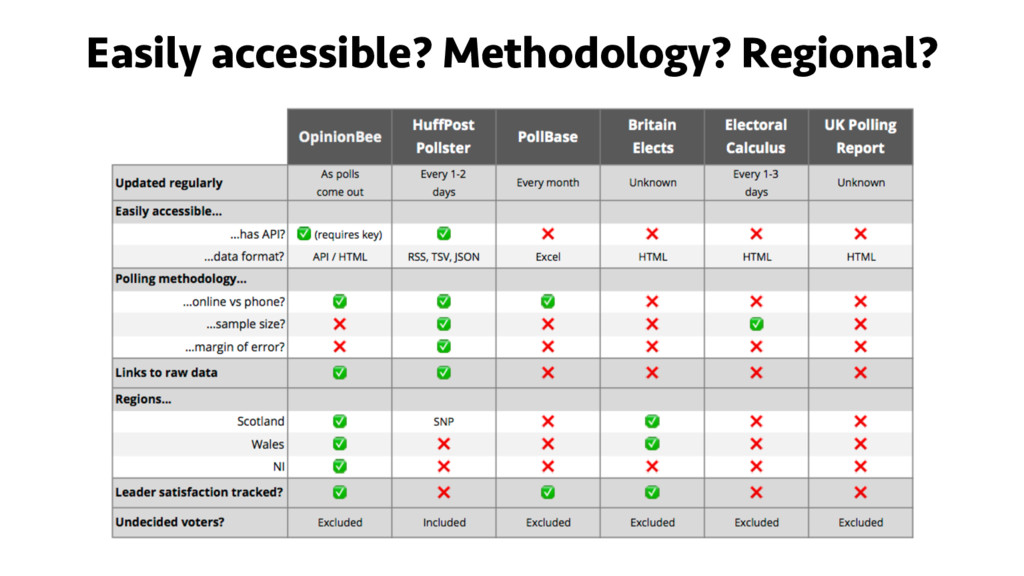
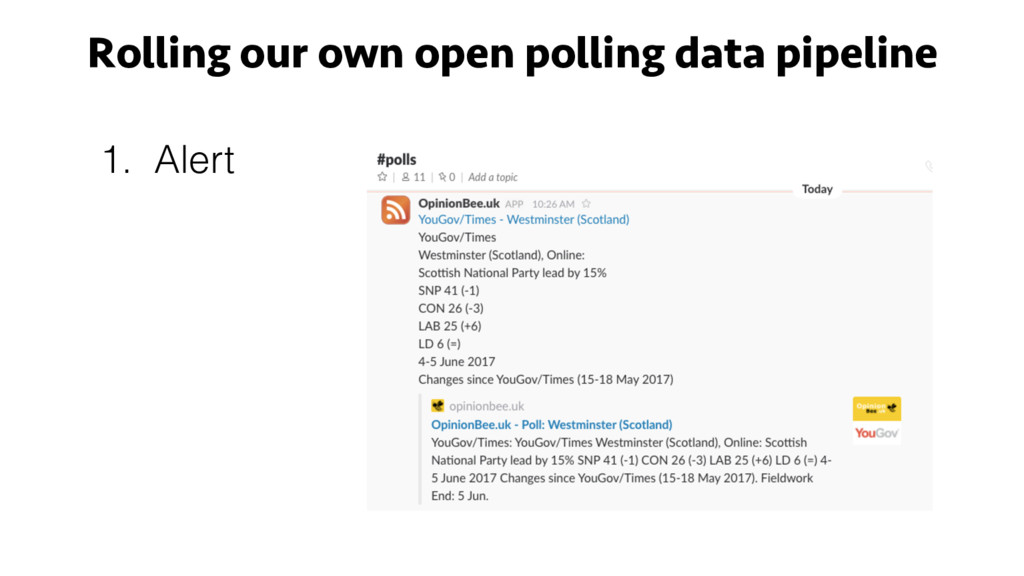
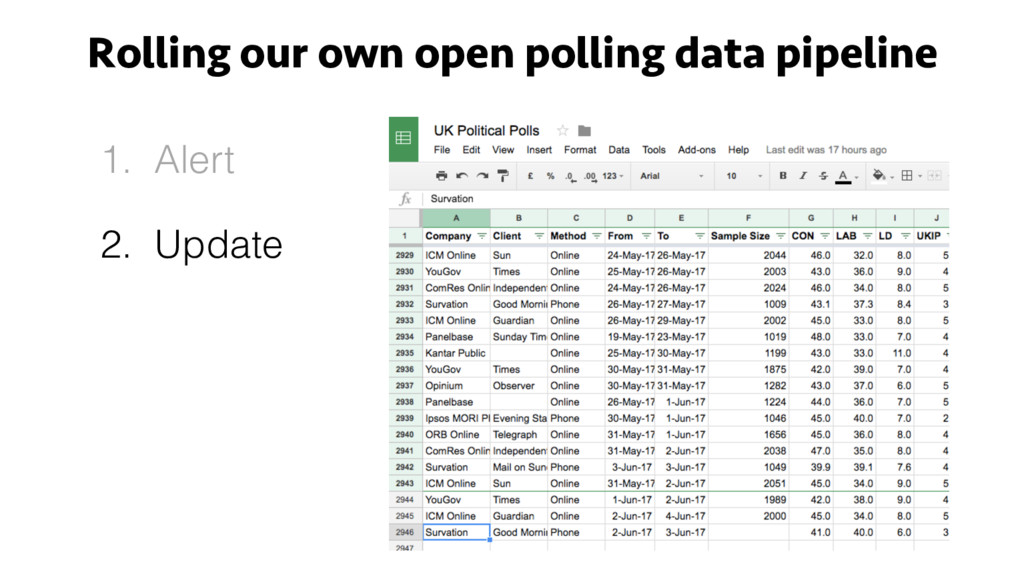
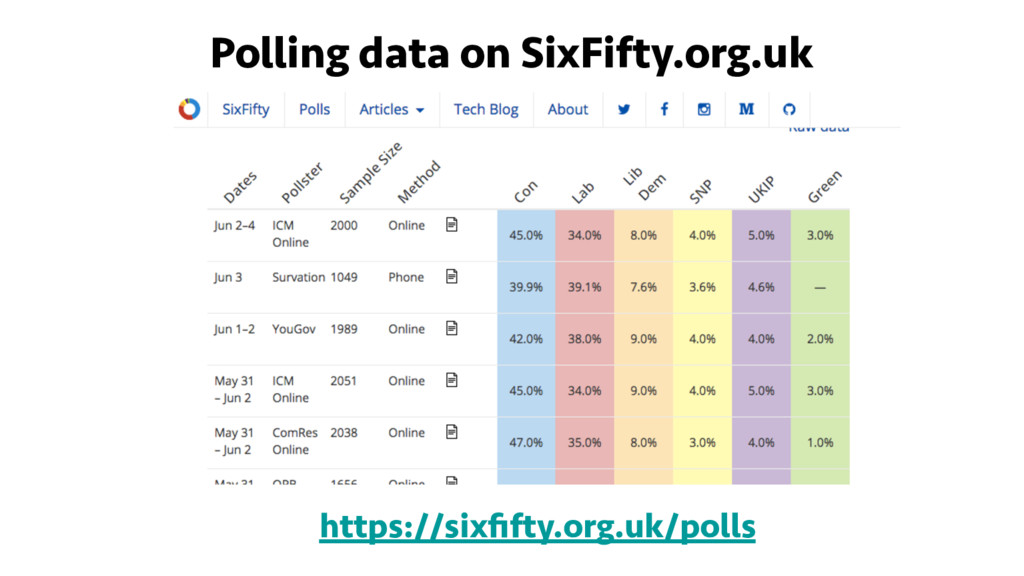
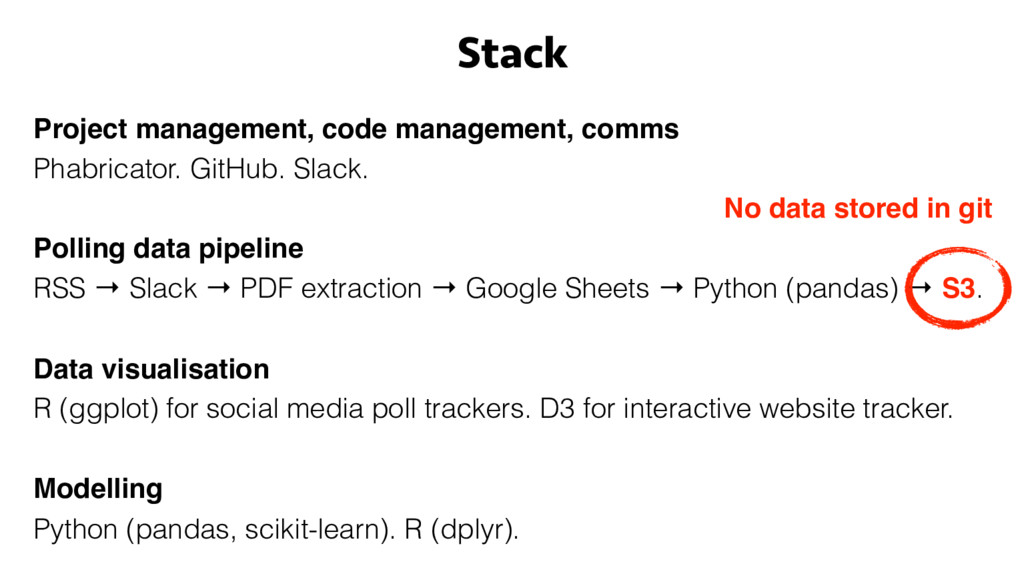
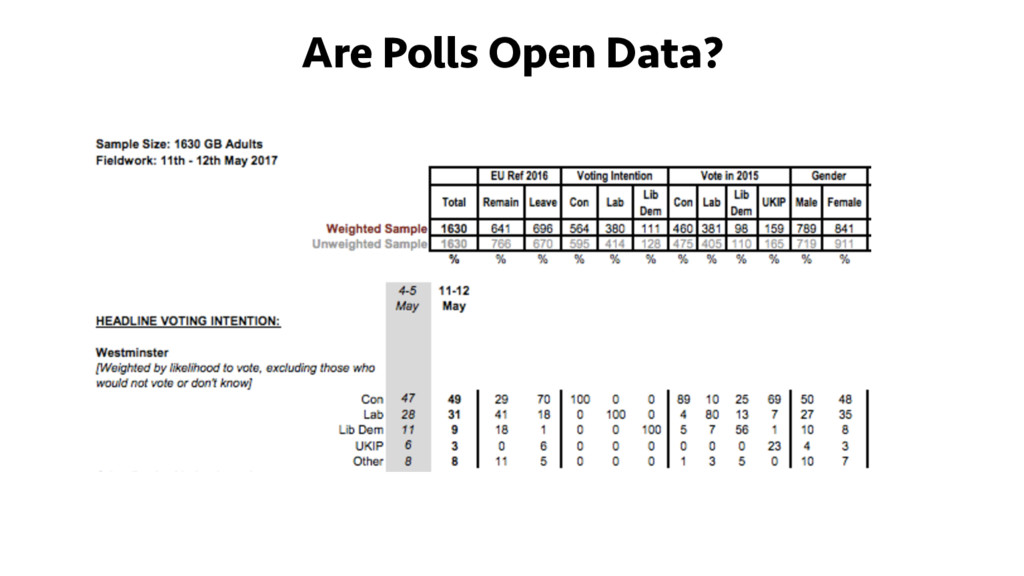
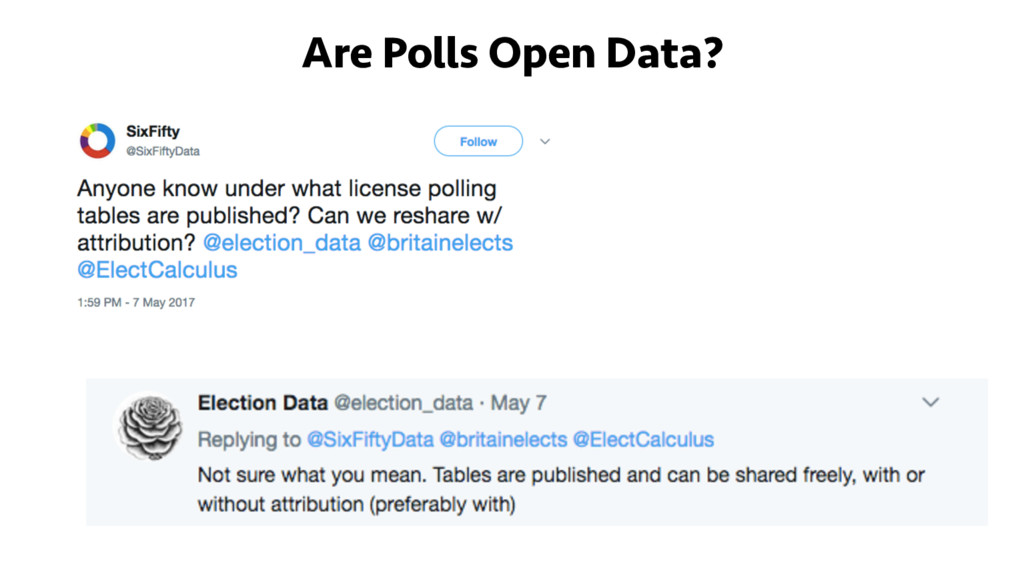
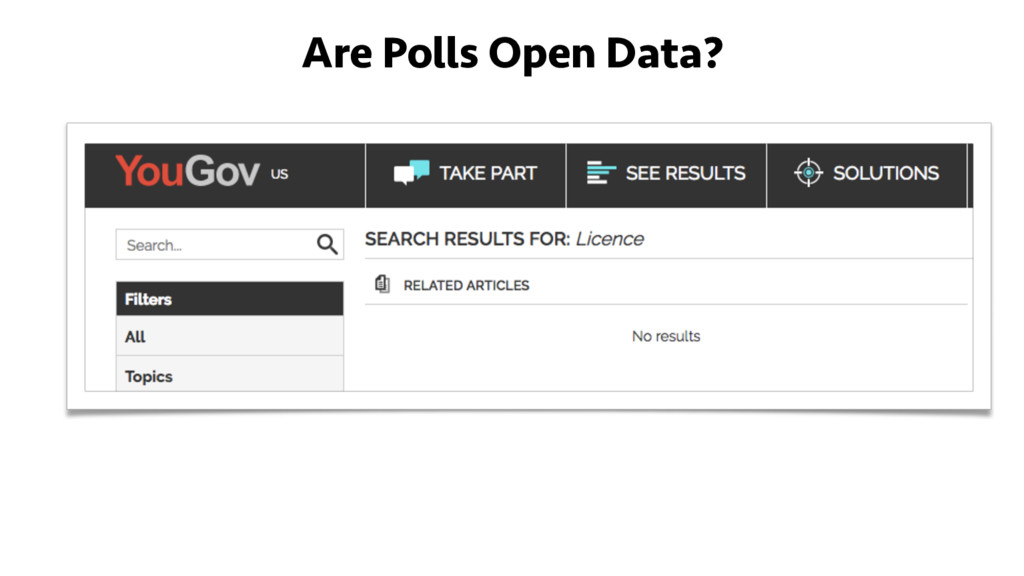
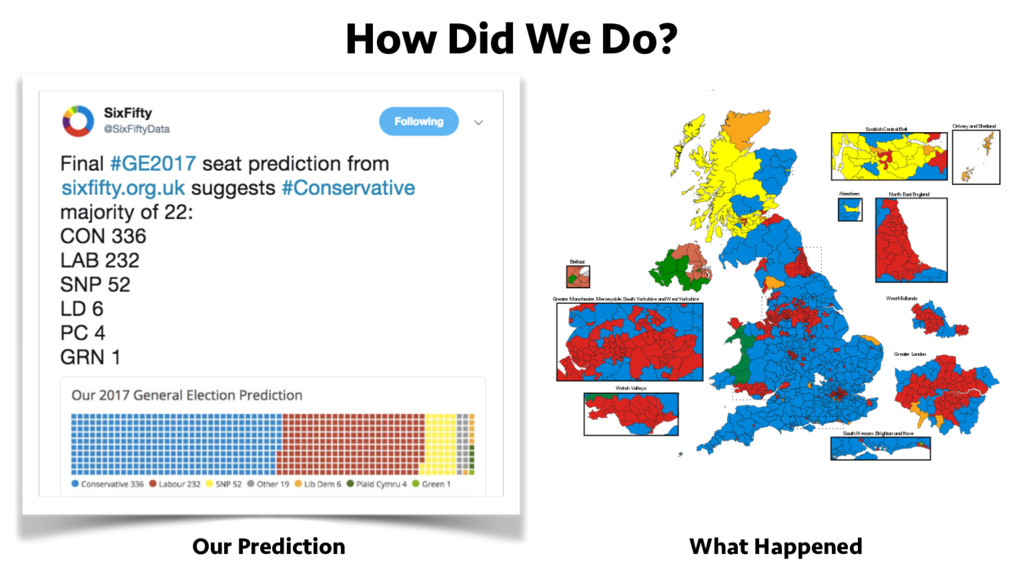
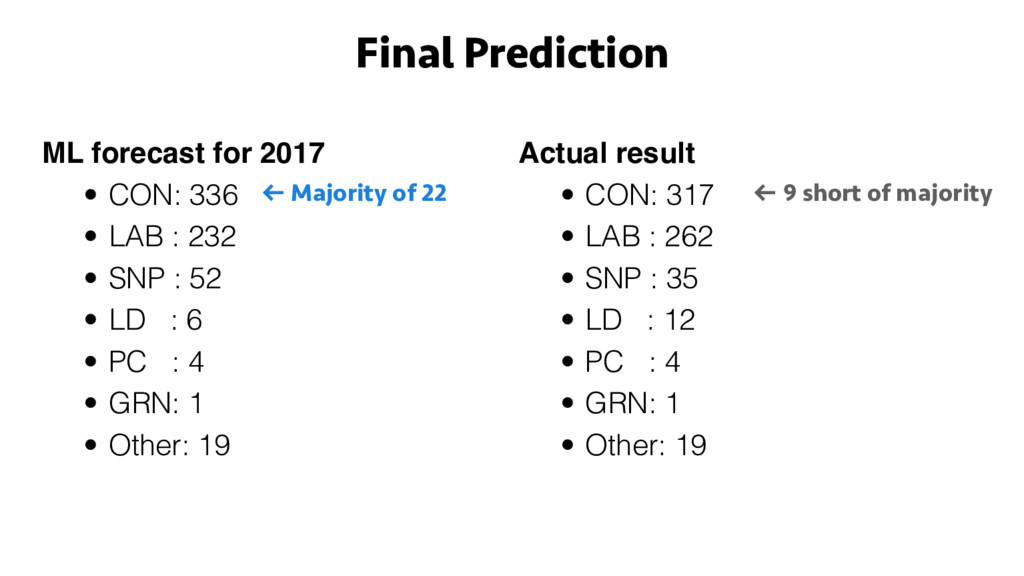
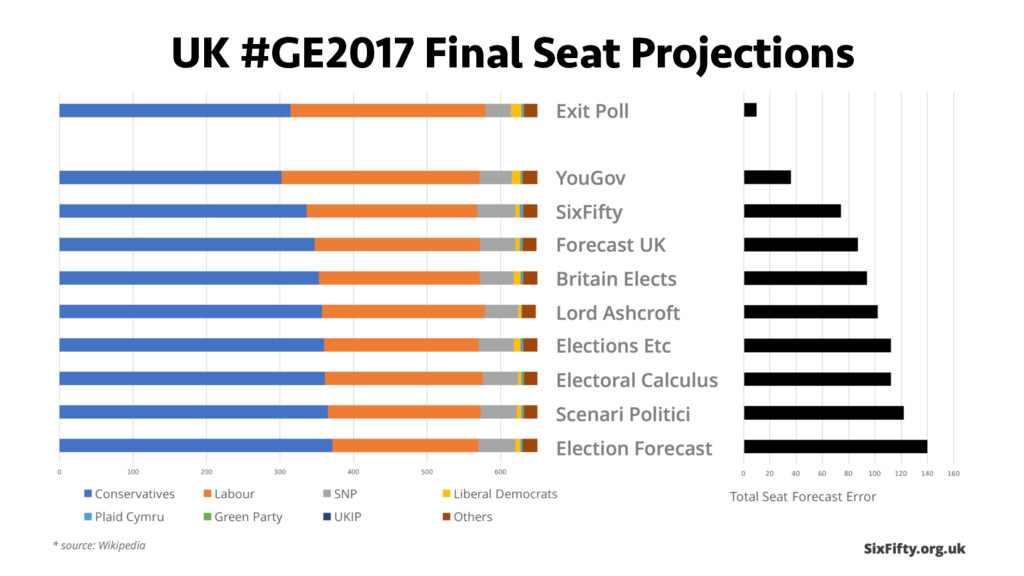
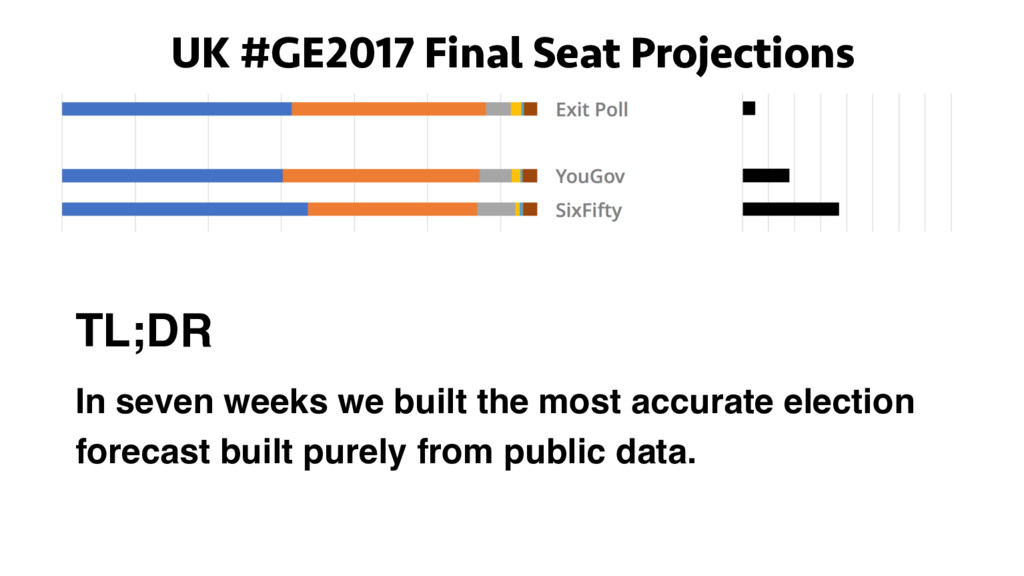
In this talk we will cover our approach to creating an open polling data pipeline, the challenges we faced especially around data provenance, the infrastructural design decisions made to remain lean under strict resource and time limitations, and the various technologies used to transform PDF polling tables into an election forecast more accurate than any other published prediction using open data.

John Sandall

September 20, 2017
Tweet

More Decks by John Sandall

Other Decks in Technology

Transcript

  1. BREAK INTO DATA SCIENCE
    SixFifty's Story:
    Why Are UK Elections So Hard To Predict?
    John Sandall
    20th September 2017
    @john_sandall
    @SixFiftyData

    View Slide

  2. BREAK INTO DATA SCIENCE
    18th April 2017

    View Slide

  3. WHAT IS DATA SCIENCE? Call to arms

    View Slide

  4. WHAT IS DATA SCIENCE?
    Inspiration

    View Slide

  5. WHAT IS DATA SCIENCE?
    Sidenote: Why am I addicted to poll trackers?
    Habit Forming 101
    1. Cue

    View Slide

  6. WHAT IS DATA SCIENCE?
    Sidenote: Why am I addicted to poll trackers?
    Habit Forming 101
    1. Cue
    2. Routine

    View Slide

  7. Sidenote: Why am I addicted to poll trackers?
    Habit Forming 101
    1. Cue
    2. Routine
    3. Reward
    "Predictable feedback loops don’t create desire" – Nir Eyal

    View Slide

  8. The UK has 650
    parliamentary
    constituencies.
    Why SixFifty?

    View Slide

  9. BREAK INTO DATA SCIENCE
    How To Forecast A
    General Election

    View Slide

  10. Uniform National Swing: A Case Study
    Welcome to Sheffield Hallam!
    2010 results for Sheffield Hallam
    • CON: 24%
    • LAB: 16%
    • LD: 53%
    MP: Nick Clegg.

    View Slide

  11. Step 1. Compare national results with latest polling
    2010 national results
    • CON: 36%
    • LAB: 29%
    • LD: 23%
    2015 polling
    • CON: 33%
    • LAB: 33%
    • LD: 9%
    Uniform National Swing: A Case Study

    View Slide

  12. Step 2. Calculate "uniform national swing" (i.e. uplift)
    2010 -> 2015 UNS
    • CON: -8%
    • LAB: +13%
    • LD: -62%
    Uniform National Swing: A Case Study

    View Slide

  13. Step 3. Apply UNS to each constituency
    2015 forecast for Sheffield Hallam
    • CON: 24% less 8% = 22%
    • LAB: 16% add 13% = 18%
    • LD: 53% less 62% = 20%
    Uniform National Swing: A Case Study

    View Slide

  14. Step 4. Forecast winner
    2015 forecast for Sheffield Hallam
    • CON: 22% • LAB: 18%
    • LD: 20%
    Uniform National Swing: A Case Study

    View Slide

  15. Step 5. So who won?
    2015 forecast for Sheffield Hallam
    • CON: 22% • LAB: 18%
    • LD: 20%
    2015 result for Sheffield Hallam
    • CON: 14%
    • LAB: 36%
    • LD: 40% Uniform National Swing: A Case Study

    View Slide

  16. Is there a better way?
    • Use regional polling where available.
    • Model out regional polls from national poll breakdowns.
    • Adjust each pollster for historical reliability or bias.
    • Adjust polls based on how they weight undecided voters.
    • Adjust based on current sentiments around polling accuracy.
    Uniform National Swing: A Case Study

    View Slide

  17. But really...is there a better way?
    • Use rigorous & modern modelling techniques.
    • Cross-validate, backtest, evaluate for predictive accuracy.
    • Blend in multiple data sources, not just polling.
    • Greater understanding of what drives election outcomes.
    • Open source our code, data, methodology.
    Uniform National Swing: A Case Study

    View Slide

  18. BREAK INTO DATA SCIENCE
    Polling 101

    View Slide

  19. Average forecast (left) vs actual results (right) for the 2015 general election
    What went wrong in 2015?

    View Slide

  20. • "Shy Tories"? Mostly a convenient myth.
    • "Lazy Labour"? Partially true.
    • Biased sampling? Definitely true.
    • Herding?
    What went wrong in 2015?

    View Slide

  21. What went wrong in 2015?

    View Slide

  22. • "Shy Tories"? Mostly a convenient myth.
    • "Lazy Labour"? Partially true.
    • Biased sampling? Definitely true.
    • Herding? Definitely true.
    One survey found that 75% of US adults don't trust surveys.
    What went wrong in 2015?

    View Slide

  23. BREAK INTO DATA SCIENCE
    Polling data

    View Slide

  24. What does polling data look like?

    View Slide

  25. Raw data contains:
    • Voting Intention (“Which party will you be voting for on June 8th?”)
    • Party leader satisfaction
    • Policy preferences (“Do you think tuition fees should be abolished?”)
    • Demographic background (location, gender, age, education, etc)
    • Voted during EU Referendum? Remain or Leave?
    • Voted during 2015 general election? Which party voted for?
    • Questions designed to gauge likelihood of voting

    View Slide

  26. Raw data looks like:

    View Slide

  27. Automated data extraction?
    http://tabula.technology/

    View Slide

  28. Open polling data?
    bit.ly/UKPoliticsDatasets

    View Slide

  29. Open polling data?
    http://opinionbee.uk/

    View Slide

  30. Easily accessible? Methodology? Regional?

    View Slide

  31. Rolling our own open polling data pipeline
    1. Alert

    View Slide

  32. Rolling our own open polling data pipeline
    1. Alert
    2. Update

    View Slide

  33. Rolling our own open polling data pipeline
    1. Alert
    2. Update
    3. Automate
    https://github.com/six50/pipeline/

    View Slide

  34. Regional polling data

    View Slide

  35. Regional polling data

    View Slide

  36. Regional polling data

    View Slide

  37. D3 poll tracker
    https://sixfifty.org.uk/polls

    View Slide

  38. Polling data on SixFifty.org.uk
    https://sixfifty.org.uk/polls

    View Slide

  39. BREAK INTO DATA SCIENCE
    Technology
    Stack

    View Slide

  40. Guiding Principles
    1. Serverless
    Extreme time constraints. DevOps skills needed elsewhere.
    2. Tech Agnostic
    Volunteers working ad-hoc need to plug-and-play.
    3. Ubiquitous Tech
    Stick to what most people know. No time to learn new tech. Stay lean.
    4. Self Organising
    Create an infrastructure for volunteers to work independently.

    View Slide

  41. Stack
    Project management, code management, comms
    Phabricator. GitHub. Slack.
    Polling data pipeline
    RSS → Slack → PDF extraction → Google Sheets → Python (pandas) → S3.
    Data visualisation
    R (ggplot) for social media poll trackers. D3 for interactive website tracker.
    Modelling
    Python (pandas, scikit-learn). R (dplyr).

    View Slide

  42. Project management, code management, comms
    Phabricator. GitHub. Slack.
    Polling data pipeline
    RSS → Slack → PDF extraction → Google Sheets → Python (pandas) → S3.
    Data visualisation
    R (ggplot) for social media poll trackers. D3 for interactive website tracker.
    Modelling
    Python (pandas, scikit-learn). R (dplyr).
    Stack
    No data stored in git

    View Slide

  43. Open Data
    http://www.nationalarchives.gov.uk/doc/open-government-licence/version/2/

    View Slide

  44. Open Data
    https://github.com/six50/pipeline

    View Slide

  45. Open Data
    https://github.com/six50/pipeline

    View Slide

  46. Are Polls Open Data?

    View Slide

  47. Are Polls Open Data?

    View Slide

  48. Are Polls Open Data?

    View Slide

  49. BREAK INTO DATA SCIENCE
    The SixFifty
    Forecast Model

    View Slide

  50. The Plan
    1. Replicate UNS model
    2. Check predictions against other forecasts
    3. Evaluate with historical election data
    4. Build ML model
    5. Iterate...

    View Slide

  51. UNS models
    National UNS forecast for 2017
    • CON: 337
    • LAB : 236
    • SNP : 47
    • LD : 6
    • PC : 5
    • Other: 19
    ← Majority of 24

    View Slide

  52. National UNS forecast for 2017
    • CON: 337
    • LAB : 236
    • SNP : 47
    • LD : 6
    • PC : 5
    • Other: 19
    Regional UNS forecast for 2017
    • CON: 342
    • LAB : 236
    • SNP : 43
    • LD : 6
    • PC : 4
    • Other: 19
    UNS models
    ← Majority of 24 ← Majority of 34

    View Slide

  53. Comparison With Other Forecasts
    Forecast Predicted Conservative Majority
    2015 result +10
    YouGov -24 (hung)
    SixFifty national UNS model +24
    New Statesman +24
    SixFifty regional UNS model +34
    Lord Ashcroft +64
    Elections Etc +66
    Electoral Calculus +66
    Election Forecast +82

    View Slide

  54. UNS models

    View Slide

  55. Model Evaluation
    1. Repeat for GE2010 -> GE2015
    2. Forecast GE2015 seat-by-seat
    3. Evaluate:
    • National Vote Share (MAE) = 2% error
    • National Seat Count (total) = 135 incorrectly called
    • Seat-by-seat Accuracy = 79% correctly called
    • Seat vote share MAE = 4.6% mean error / party / seat

    View Slide

  56. Build ML Model
    • Polling data only for 2010, 2015, 2017
    • CON / LAB / LD / UKIP / GRN only
    • Calculate and forecast using UNS => useful feature!
    • Features:
    • Region
    • Electorate (registered, total who voted, total votes cast)
    • Party
    • Previous election: total votes, vote share, won constituency?
    • Current election: poll vote share, swing
    • UNS forecast: vote share (%), predicted winner

    View Slide

  57. Build ML Model

    View Slide

  58. Build ML Model
    Evaluation
    • 5x5 cross-validation on GE2015 predictions from GE2010 data
    Models (scikit-learn)
    • Linear Regression (Simple, Lasso, Ridge)
    • Ensemble (Random Forest, Gradient Boosting, Extra Trees)
    • Neural net (MLPRegressor)
    Tune best default model (Gradient Boosted Trees)

    View Slide

  59. Build ML Model
    Tune best default model (Gradient Boosting)

    View Slide

  60. Seat vote share MAE
    • UNS model = 4.6% mean error / party / seat
    • GB model = 2.3% mean error / party / seat
    TL;DR – 50% reduction in average error per seat
    Evaluate ML Model

    View Slide

  61. Feature Importance

    View Slide

  62. Regional UNS forecast for 2017
    • CON: 342
    • LAB : 236
    • SNP : 43
    • LD : 6
    • PC : 4
    • GRN: 1
    • Other: 19
    ML forecast for 2017
    • CON: 336
    • LAB : 232
    • SNP : 52
    • LD : 6
    • PC : 4
    • GRN: 1
    • Other: 19
    Final Prediction
    ← Majority of 34 ← Majority of 22

    View Slide

  63. Comparison With Other Forecasts
    Forecast Predicted Conservative Majority
    YouGov -24 (hung)
    Final SixFifty ML model +22
    SixFifty national UNS model +24
    New Statesman +24
    SixFifty regional UNS model +34
    Lord Ashcroft +64
    Elections Etc +66
    Electoral Calculus +66
    Election Forecast +82

    View Slide

  64. Comparison With Other Forecasts
    https://www.thesun.co.uk/news/3686937/pollster-yougov-is-mocked-over-utter-tripe-poll-which-shows-theresa-may-losing-her-majority-in-election/

    View Slide

  65. Comparison With Other Forecasts
    https://www.thesun.co.uk/news/3686937/pollster-yougov-is-mocked-over-utter-tripe-poll-which-shows-theresa-may-losing-her-majority-in-election/

    View Slide

  66. Election Night!

    View Slide

  67. BREAK INTO DATA SCIENCE
    Reflection

    View Slide

  68. In seven weeks we...
    • Created a multitude of explainer articles and tech blogs
    • Built a best practice open data pipeline for polling data
    • Created multiple election forecasts using machine learning
    • Wrote scripts for scraping Twitter & tagging live TV
    • Ran an election data hackathon at Newspeak House
    • Lots of dead ends!
    We Tried To Do Too Much!

    View Slide

  69. We Tried To Do Too Much!

    View Slide

  70. We Tried To Do Too Much!

    View Slide

  71. We Tried To Do Too Much!

    View Slide

  72. BREAK INTO DATA SCIENCE
    How Did We Do?

    View Slide

  73. How Did We Do?
    Our Prediction What Happened

    View Slide

  74. ML forecast for 2017
    • CON: 336
    • LAB : 232
    • SNP : 52
    • LD : 6
    • PC : 4
    • GRN: 1
    • Other: 19
    Final Prediction
    ← Majority of 22
    Actual result
    • CON: 317
    • LAB : 262
    • SNP : 35
    • LD : 12
    • PC : 4
    • GRN: 1
    • Other: 19
    ← 9 short of majority

    View Slide

  75. UK #GE2017 Final Seat Projections

    View Slide

  76. TL;DR
    In seven weeks we built the most accurate election
    forecast built purely from public data.
    UK #GE2017 Final Seat Projections

    View Slide

  77. BREAK INTO DATA SCIENCE
    Next steps

    View Slide

  78. BREAK INTO DATA SCIENCE
    Thank You

    View Slide