Upgrade to Pro — share decks privately, control downloads, hide ads and more …

PyData - June 6th - Introducing SixFifty

PyData - June 6th - Introducing SixFifty

John Sandall on SixFifty's Story: Why Are UK Elections So Hard To Predict?

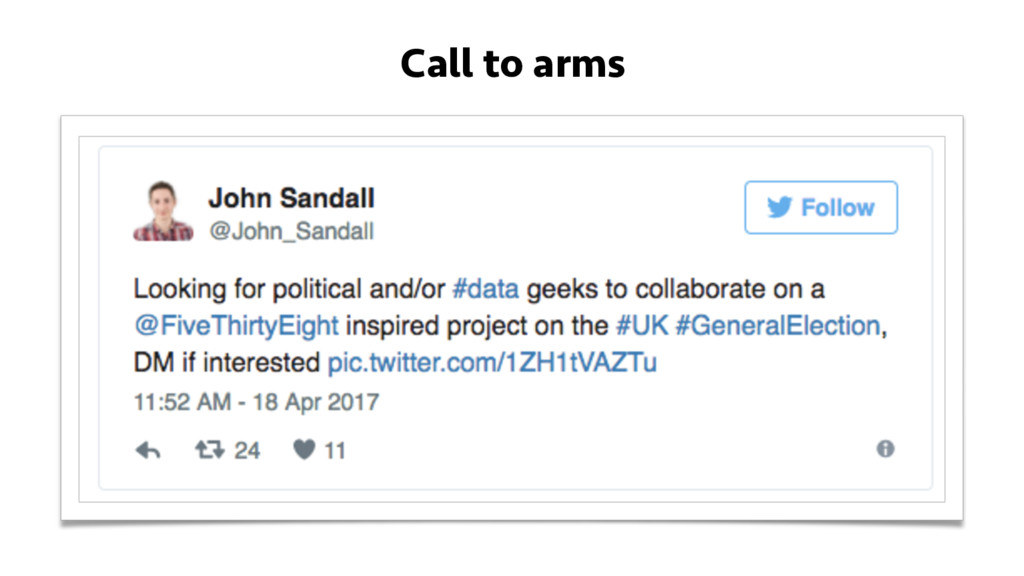
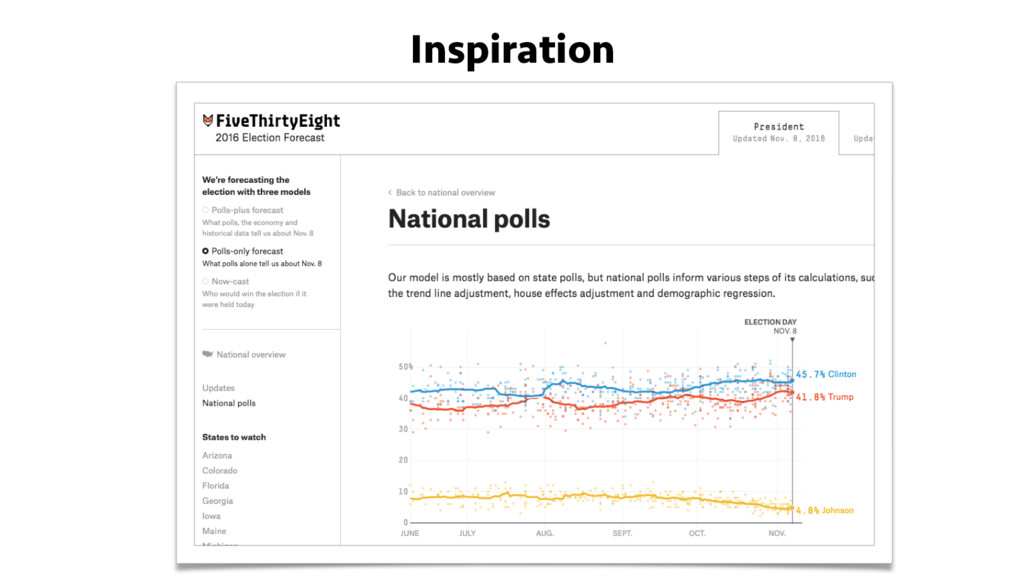
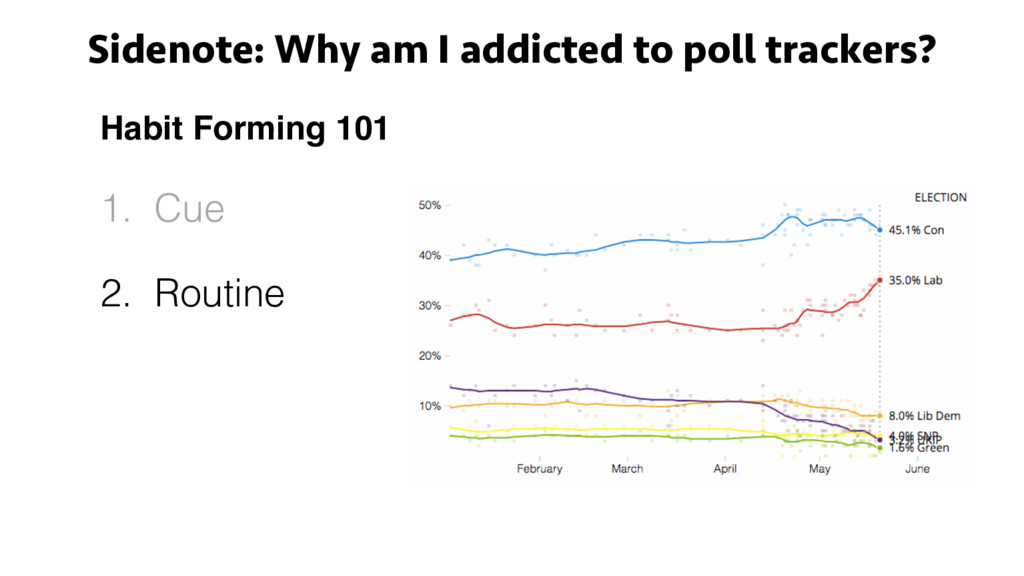
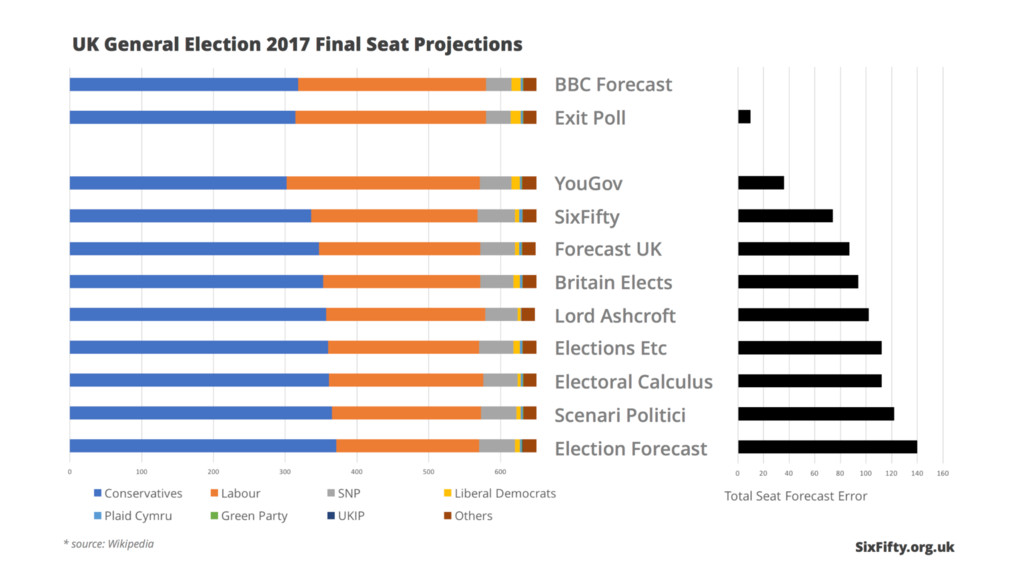
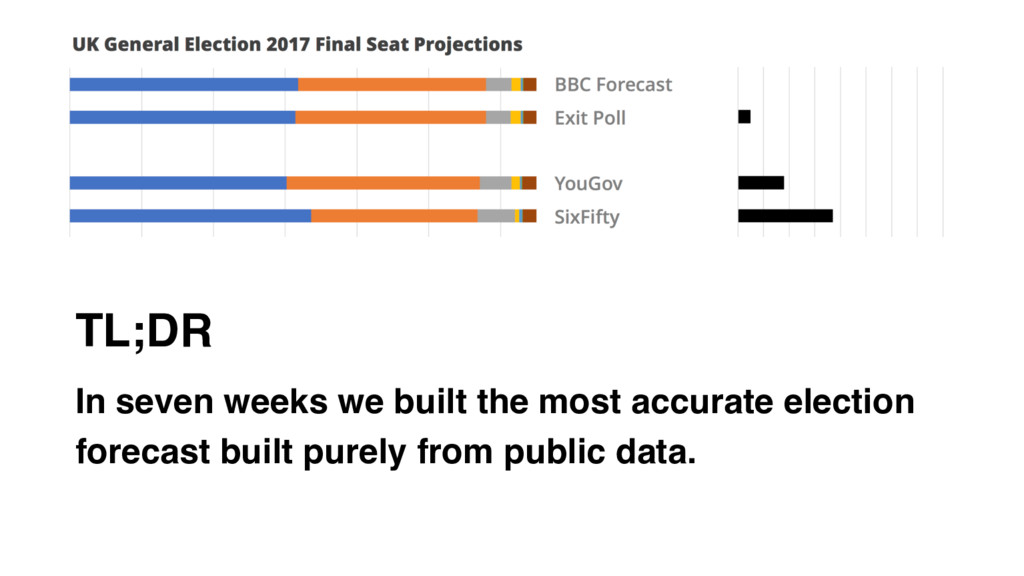
When Theresa May announced plans on April 18th for the UK to hold a general election it was met with much cynicism. However, as self-confessed psephologists (and huge fans of Nate Silver's FiveThirtyEight datablog), we instead were thrilled at the opportunity. SixFifty is a collaboration of data scientists, software engineers, data journalists and political operatives brought together within hours of the snap general election being announced. Our goals:

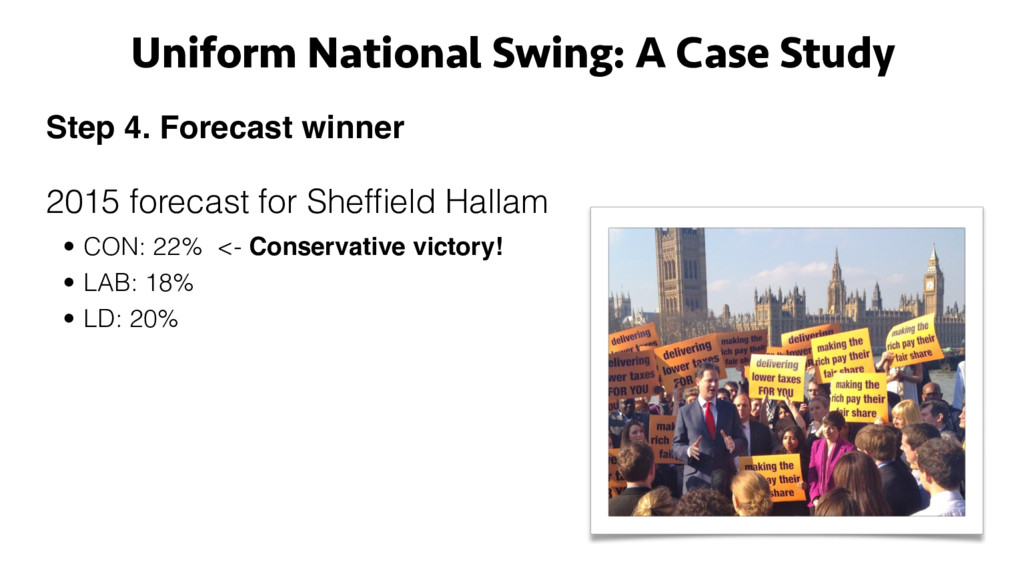
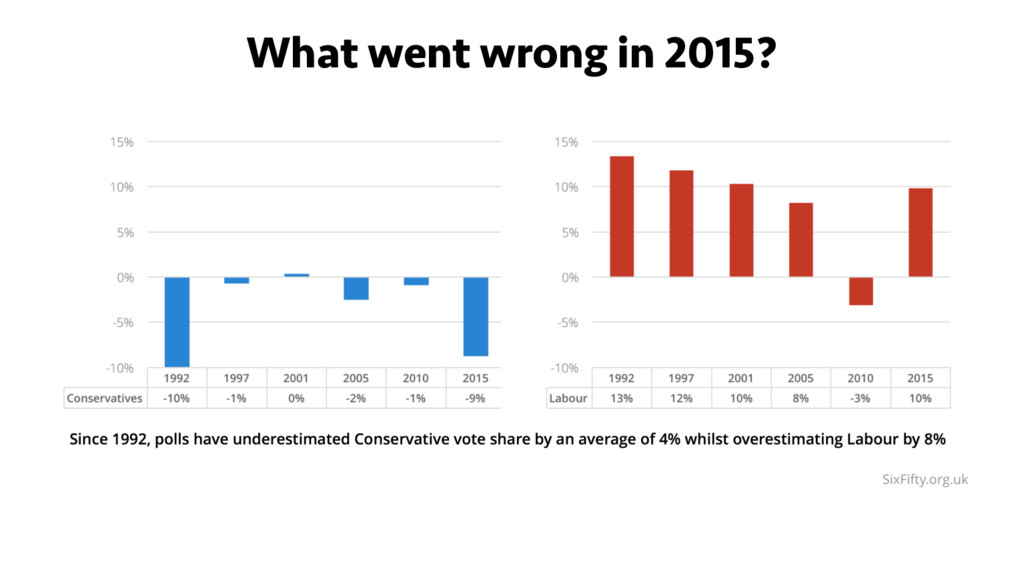
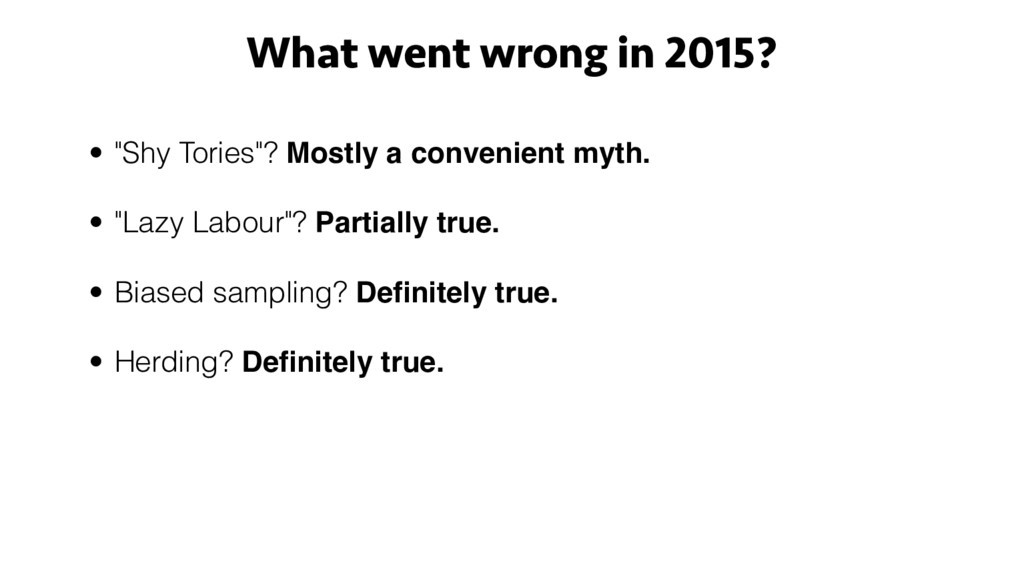
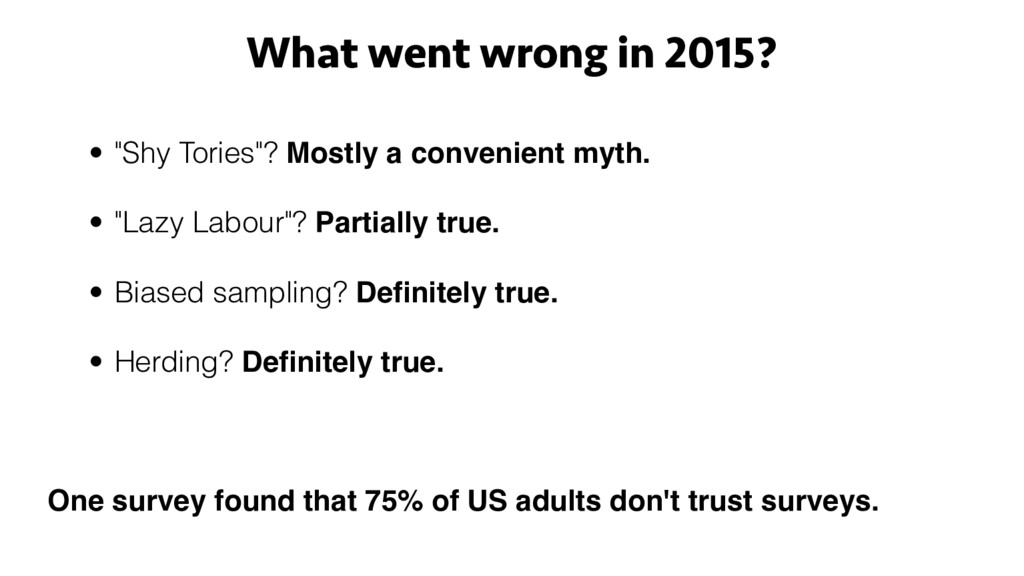
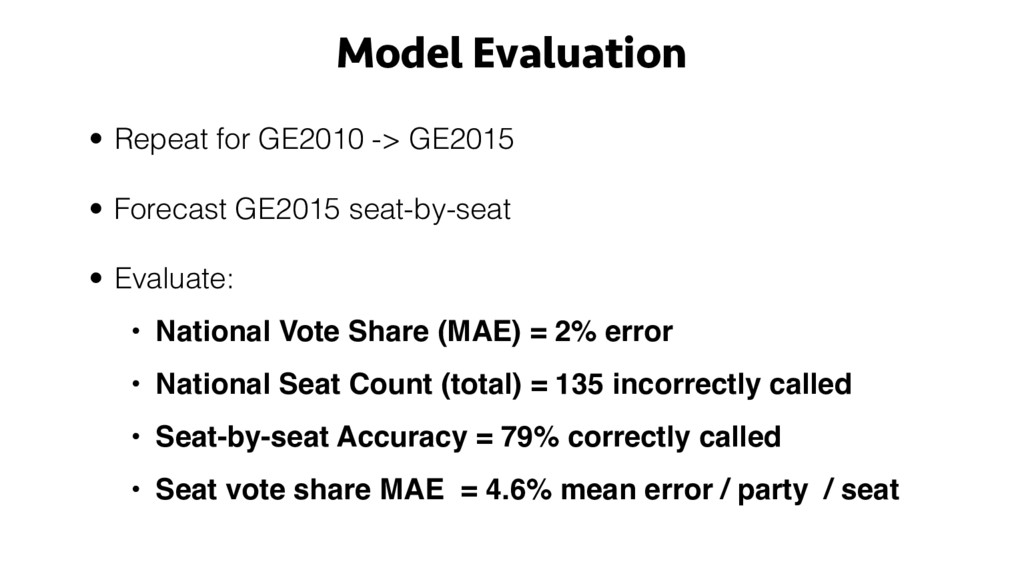
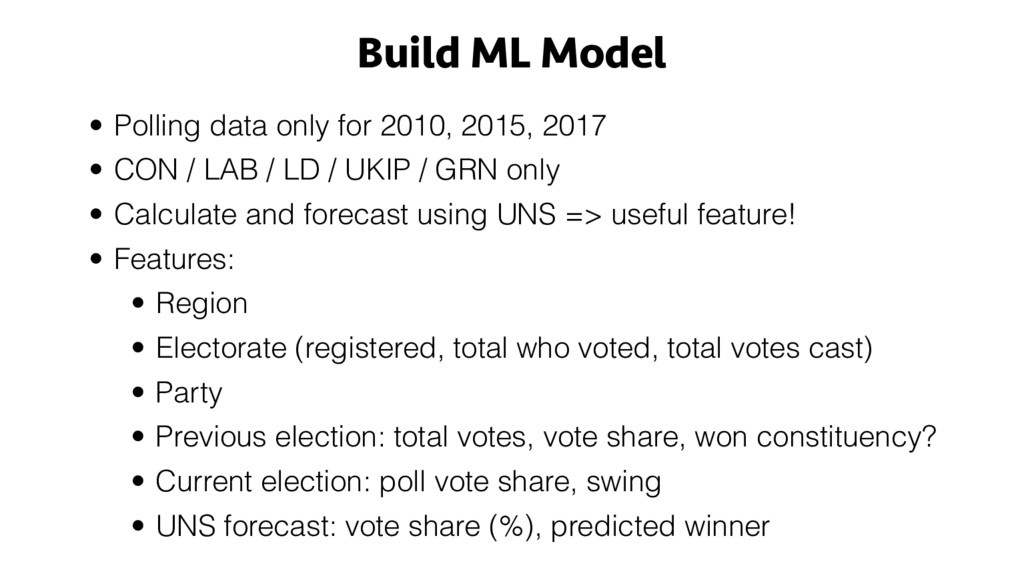
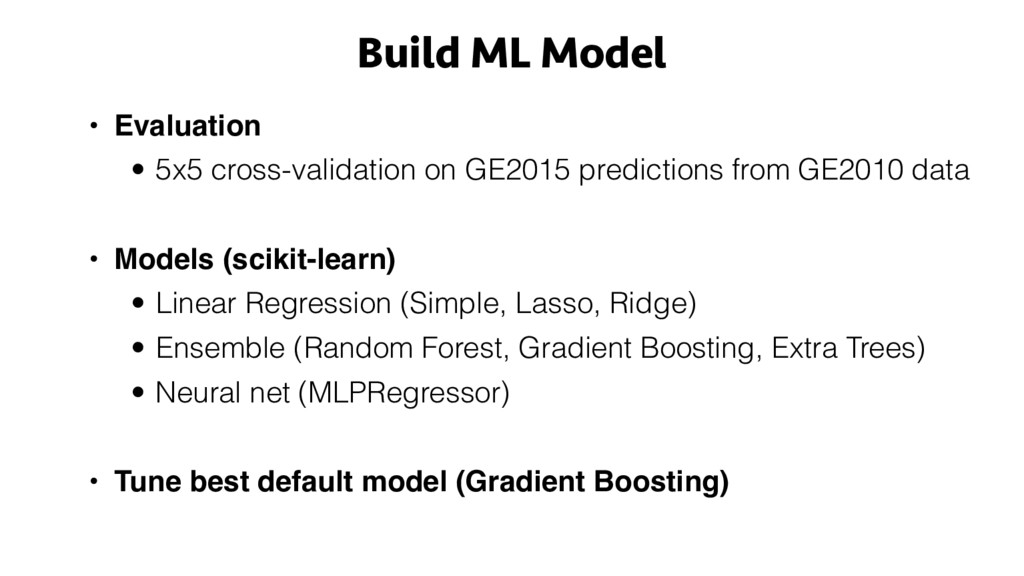
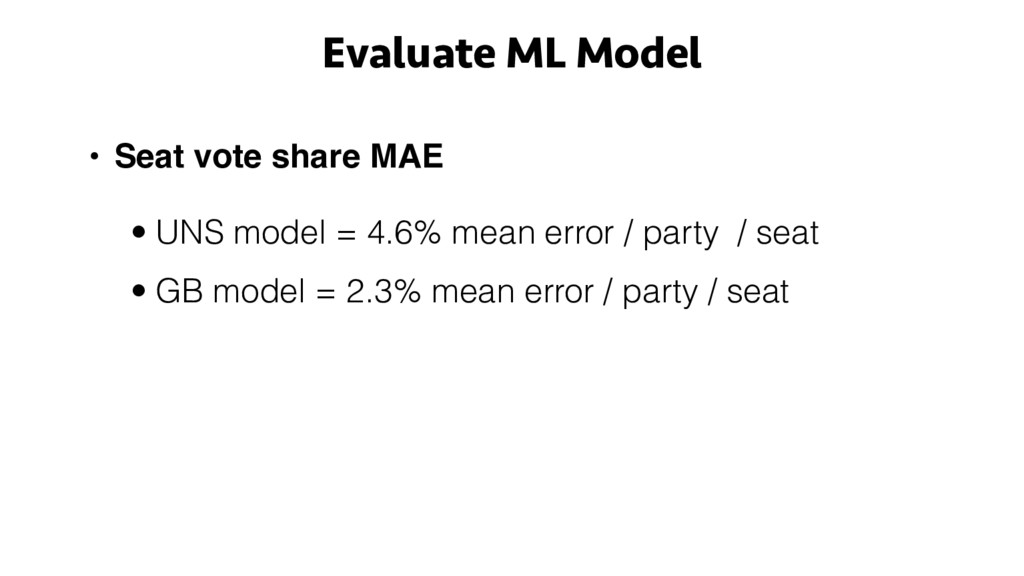
• Understand why forecasting elections in the UK using open data is notoriously difficult, and to see how far good statistical practice and modern machine learning methods can take us.

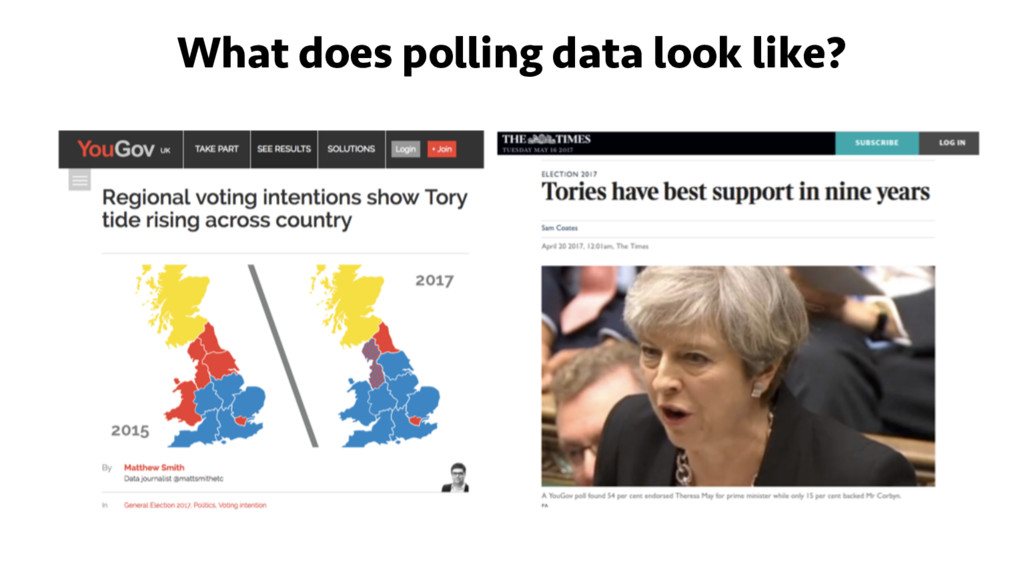
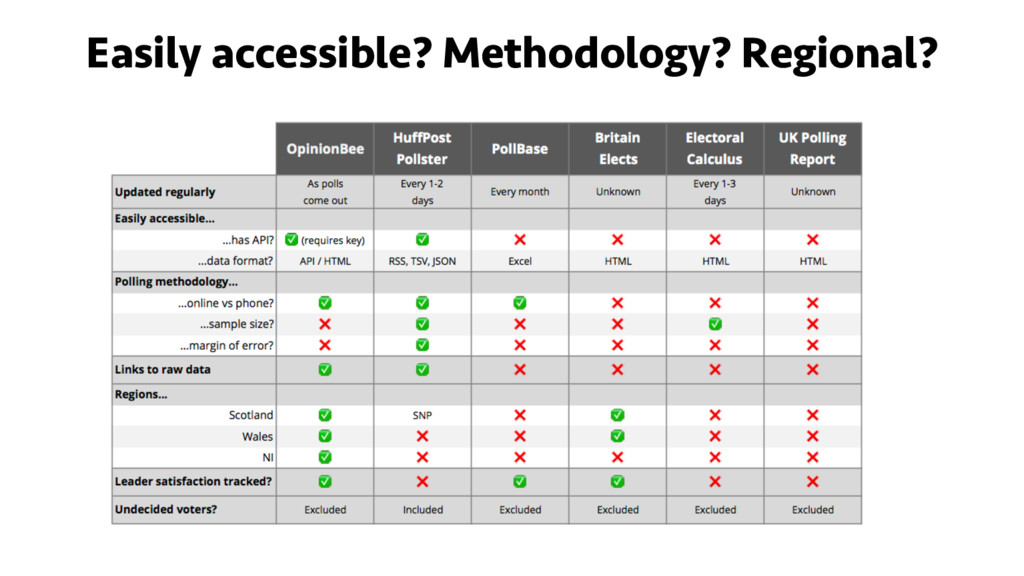
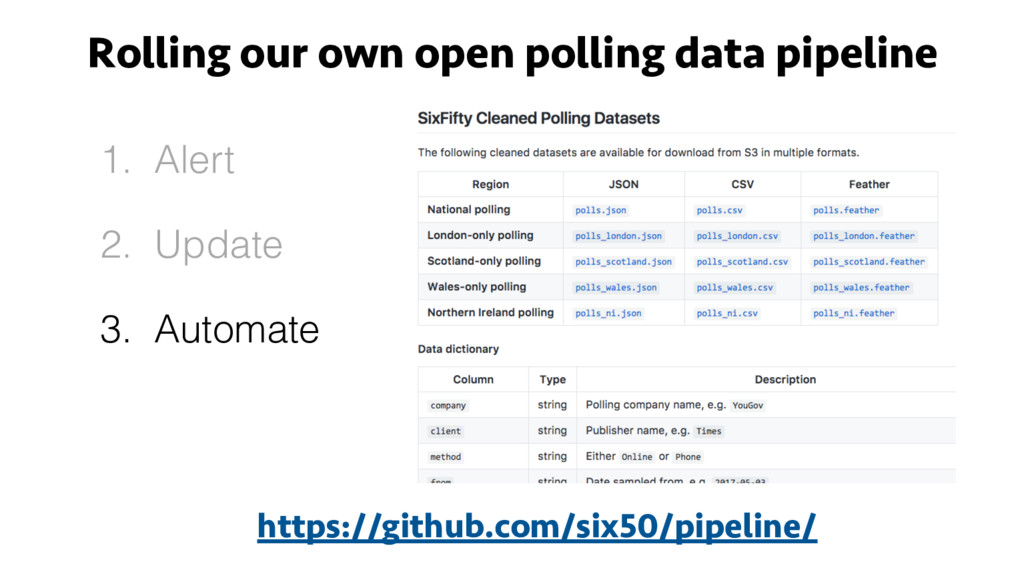
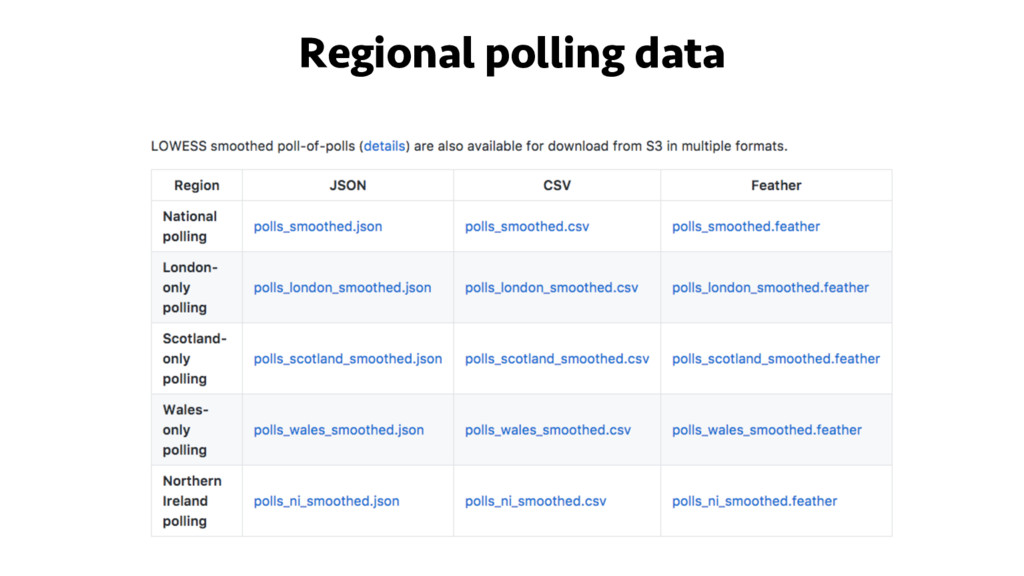
• Make political and demographic data more open and accessible by showcasing and releasing cleaned versions of the datasets we're using.

• We also hope that by communicating our methodology at a non-technical level we will contribute to improving statistical literacy, especially around concepts fundamental to elections and polling.

About the speaker:

John Sandall spends his days working as a self-employed data science consultant and his nights working as a Data Science Instructor at General Assembly. Previously he was Lead Data Scientist at mobile ticketing startup YPlan, quantitative analyst at Apple, strategy/tech lead for non-profit startup STIR Education, co-founder of an ed-tech startup, and dabbled in genomics at Imperial College London.

John Sandall

June 27, 2017
Tweet

More Decks by John Sandall

Other Decks in Technology

Transcript

  1. WHAT IS DATA SCIENCE? Sidenote: Why am I addicted to

    poll trackers? Habit Forming 101 1. Cue
  2. WHAT IS DATA SCIENCE? Sidenote: Why am I addicted to

    poll trackers? Habit Forming 101 1. Cue 2. Routine
  3. Sidenote: Why am I addicted to poll trackers? Habit Forming

    101 1. Cue 2. Routine 3. Reward "Predictable feedback loops don’t create desire" – Nir Eyal
  4. Uniform National Swing: A Case Study Welcome to Sheffield Hallam

    2010 results for Sheffield Hallam • CON: 24% • LAB: 16% • LD: 53% MP: Nick Clegg.
  5. Step 1. Compare national results with latest polling 2010 national

    results • CON: 36% • LAB: 29% • LD: 23% 2015 polling • CON: 33% • LAB: 33% • LD: 9% Uniform National Swing: A Case Study
  6. Step 2. Calculate "uniform national swing" (i.e. uplift) 2010 ->

    2015 UNS • CON: -8% • LAB: +13% • LD: -62% Uniform National Swing: A Case Study
  7. Step 3. Apply UNS to each constituency 2015 forecast for

    Sheffield Hallam • CON: 24% less 8% = 22% • LAB: 16% add 13% = 18% • LD: 53% less 62% = 20% Uniform National Swing: A Case Study
  8. Step 4. Forecast winner 2015 forecast for Sheffield Hallam •

    CON: 22% <- Conservative victory! • LAB: 18% • LD: 20% Uniform National Swing: A Case Study
  9. Step 5. So who won? 2015 forecast for Sheffield Hallam

    • CON: 22% <- Conservative victory! • LAB: 18% • LD: 20% 2015 result for Sheffield Hallam • CON: 14% • LAB: 36% • LD: 40% <- Lib Dem victory! Uniform National Swing: A Case Study
  10. Is there a better way? • Use rigorous & modern

    modelling techniques. • Cross-validate, backtest, evaluate for predictive accuracy. • Open source our code, data, methodology. • Blend in multiple data sources, not just polling. • Greater understanding of what drives election outcomes. Uniform National Swing: A Case Study
  11. Average forecast (left) vs actual results (right) for the 2015

    general election What went wrong in 2015?
  12. • "Shy Tories"? Mostly a convenient myth. • "Lazy Labour"?

    • Biased sampling? • Herding? What went wrong in 2015?
  13. • "Shy Tories"? Mostly a convenient myth. • "Lazy Labour"?

    Partially true. • Biased sampling? • Herding? What went wrong in 2015?
  14. • "Shy Tories"? Mostly a convenient myth. • "Lazy Labour"?

    Partially true. • Biased sampling? Definitely true. • Herding? What went wrong in 2015?
  15. • "Shy Tories"? Mostly a convenient myth. • "Lazy Labour"?

    Partially true. • Biased sampling? Definitely true. • Herding? Definitely true. What went wrong in 2015?
  16. • "Shy Tories"? Mostly a convenient myth. • "Lazy Labour"?

    Partially true. • Biased sampling? Definitely true. • Herding? Definitely true. One survey found that 75% of US adults don't trust surveys. What went wrong in 2015?
  17. Raw data contains: • Voting Intention (“Which party will you

    be voting for on June 8th?”) • Party leader satisfaction • Policy preferences (“Do you think tuition fees should be abolished?”) • Demographic background (location, gender, age, education, etc) • Voted during EU Referendum? Remain or Leave? • Voted during 2015 general election? Which party voted for? • Questions designed to gauge likelihood of voting
  18. Rolling our own open polling data pipeline 1. Alert 2.

    Update 3. Automate https://github.com/six50/pipeline/
  19. The Plan 1. Replicate UNS model 2. Check predictions against

    other forecasts 3. Evaluate with historical election data 4. Build ML model 5. Iterate...
  20. UNS models National UNS forecast for 2017 • CON: 337

    • LAB : 236 • SNP : 47 • LD : 6 • PC : 5 • Other: 19
  21. National UNS forecast for 2017 • CON: 337 • LAB

    : 236 • SNP : 47 • LD : 6 • PC : 5 • Other: 19 Regional UNS forecast for 2017 • CON: 342 • LAB : 236 • SNP : 43 • LD : 6 • PC : 4 • Other: 19 UNS models
  22. Model Evaluation • Repeat for GE2010 -> GE2015 • Forecast

    GE2015 seat-by-seat • Evaluate: • National Vote Share (MAE) = 2% error • National Seat Count (total) = 135 incorrectly called • Seat-by-seat Accuracy = 79% correctly called • Seat vote share MAE = 4.6% mean error / party / seat
  23. Build ML Model • Polling data only for 2010, 2015,

    2017 • CON / LAB / LD / UKIP / GRN only • Calculate and forecast using UNS => useful feature! • Features: • Region • Electorate (registered, total who voted, total votes cast) • Party • Previous election: total votes, vote share, won constituency? • Current election: poll vote share, swing • UNS forecast: vote share (%), predicted winner
  24. Build ML Model • Evaluation • 5x5 cross-validation on GE2015

    predictions from GE2010 data • Models (scikit-learn) • Linear Regression (Simple, Lasso, Ridge) • Ensemble (Random Forest, Gradient Boosting, Extra Trees) • Neural net (MLPRegressor) • Tune best default model (Gradient Boosting)
  25. • Seat vote share MAE • UNS model = 4.6%

    mean error / party / seat • GB model = 2.3% mean error / party / seat Evaluate ML Model
  26. Regional UNS forecast for 2017 • CON: 342 • LAB

    : 236 • SNP : 43 • LD : 6 • PC : 4 • Other: 19 ML forecast for 2017 • CON: 332 • LAB : 232 • SNP : 56 • LD : 5 • PC : 4 • Other: 19 Final Prediction
  27. BREAK INTO DATA SCIENCE UPDATE This section has been added

    after the PyData talk. 1. Final forecast. 2. Comparison with election result. 3. Comparison with other forecasts.
  28. Regional UNS forecast for 2017 • CON: 342 • LAB

    : 236 • SNP : 43 • LD : 6 • PC : 4 • GRN: 1 • Other: 19 ML forecast for 2017 • CON: 336 • LAB : 232 • SNP : 52 • LD : 6 • PC : 4 • GRN: 1 • Other: 19 Final Prediction ← Majority of 34 ← Majority of 22
  29. ML forecast for 2017 • CON: 336 • LAB :

    232 • SNP : 52 • LD : 6 • PC : 4 • GRN: 1 • Other: 19 Final Prediction ← Majority of 22 Actual result • CON: 317 • LAB : 262 • SNP : 35 • LD : 12 • PC : 4 • GRN: 1 • Other: 19 ← 9 short of majority
  30. TL;DR In seven weeks we built the most accurate election

    forecast built purely from public data.