Upgrade to Pro — share decks privately, control downloads, hide ads and more …

Psephology 101

Psephology 101

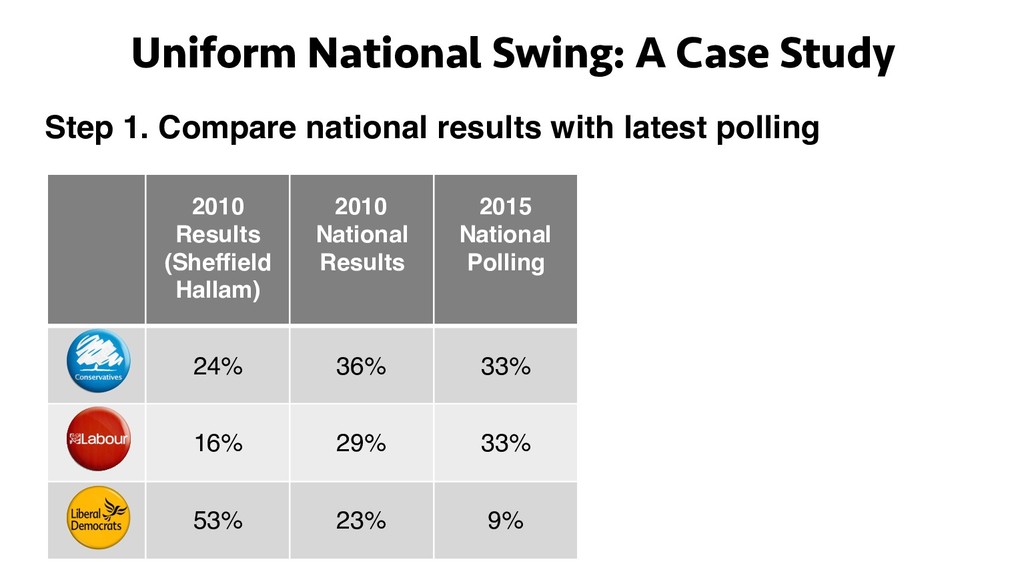
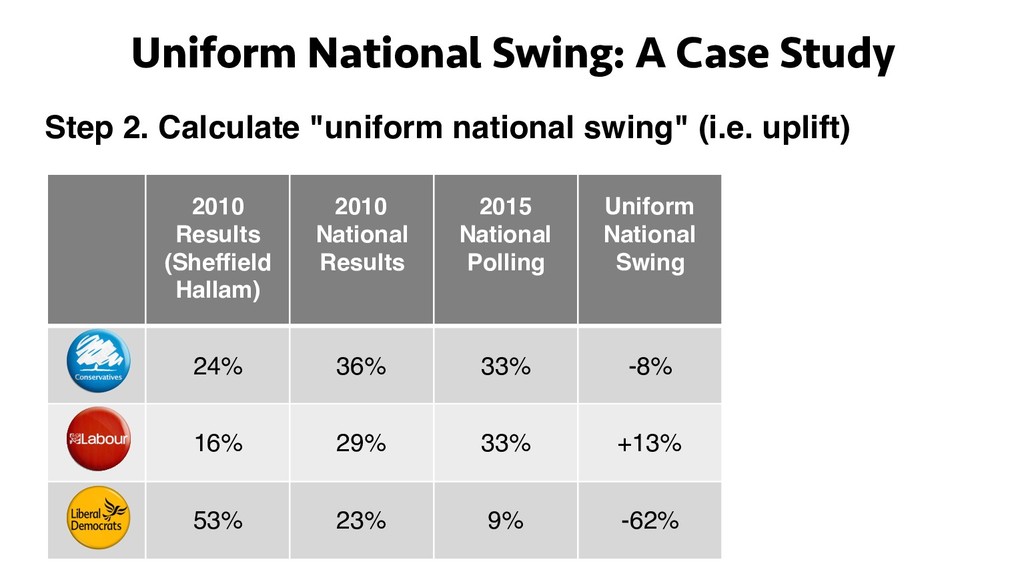
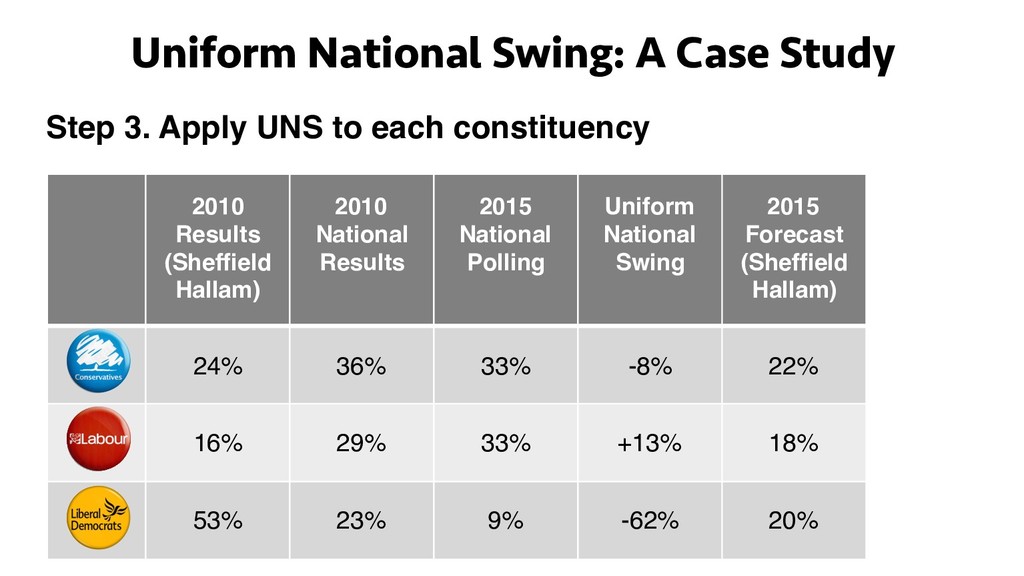
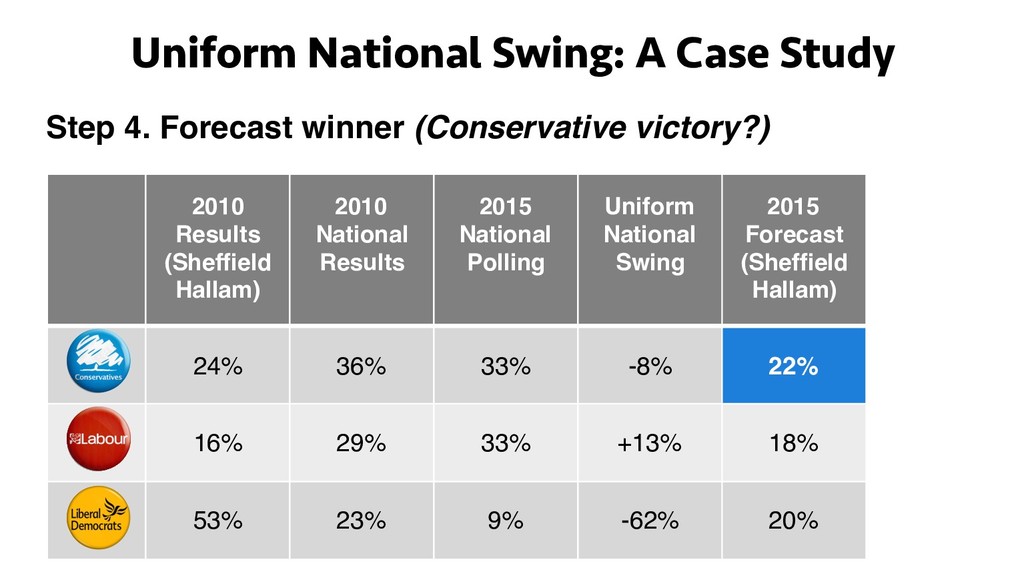
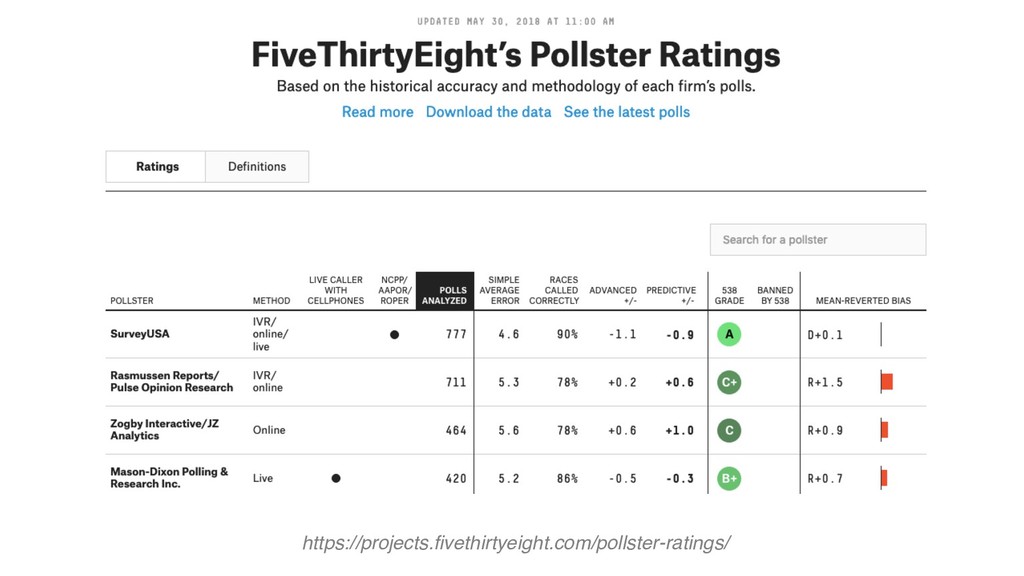
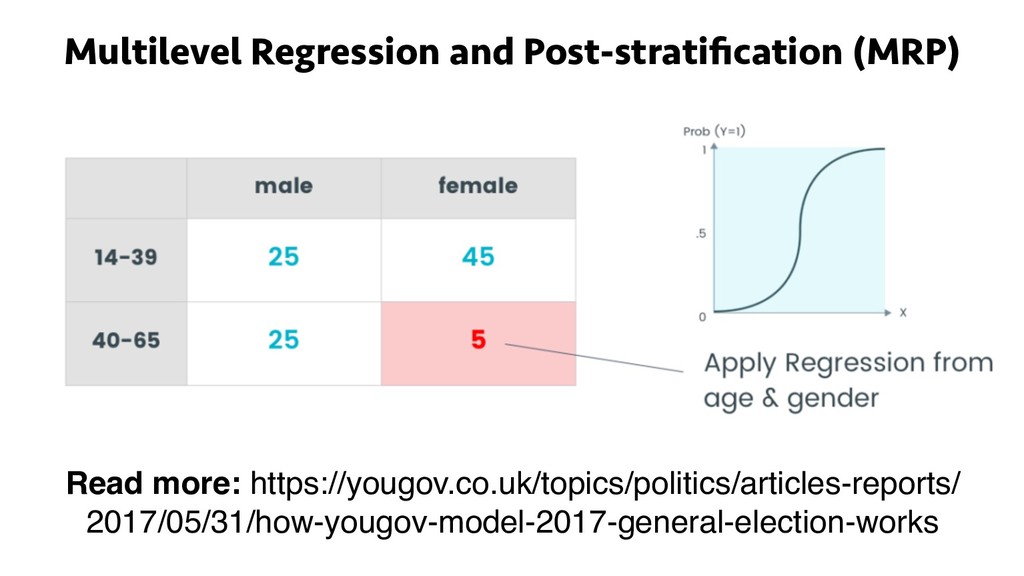
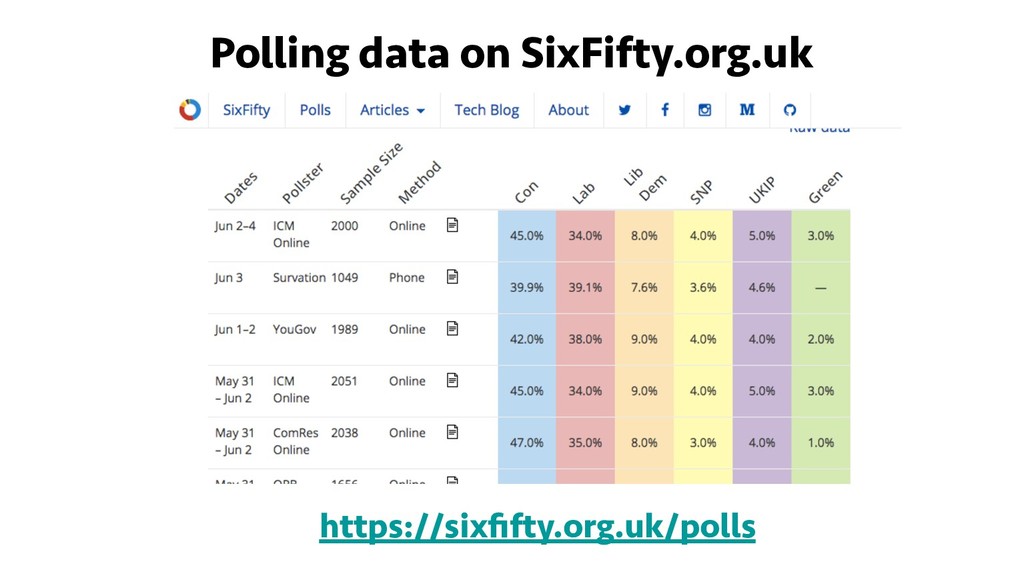
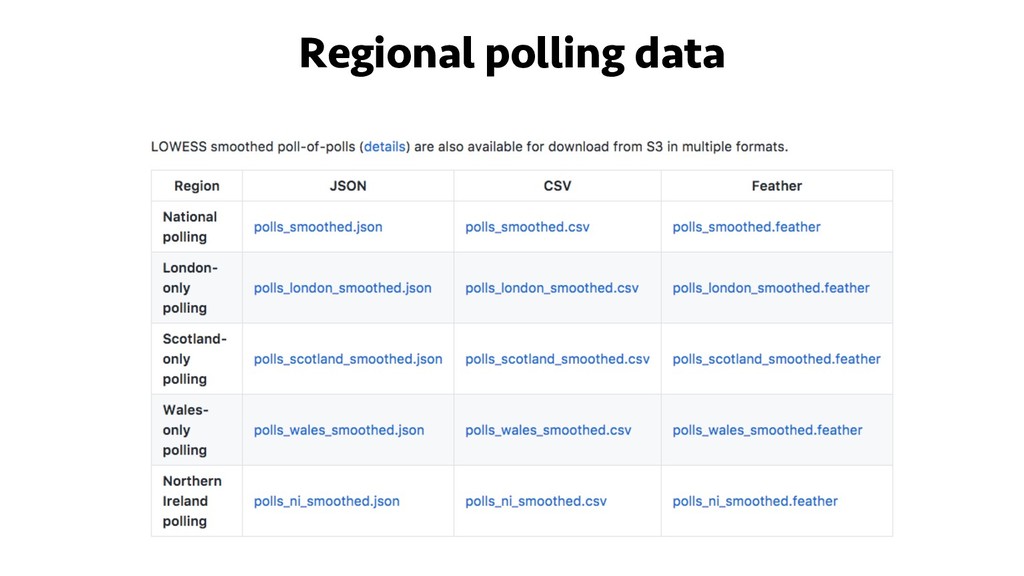
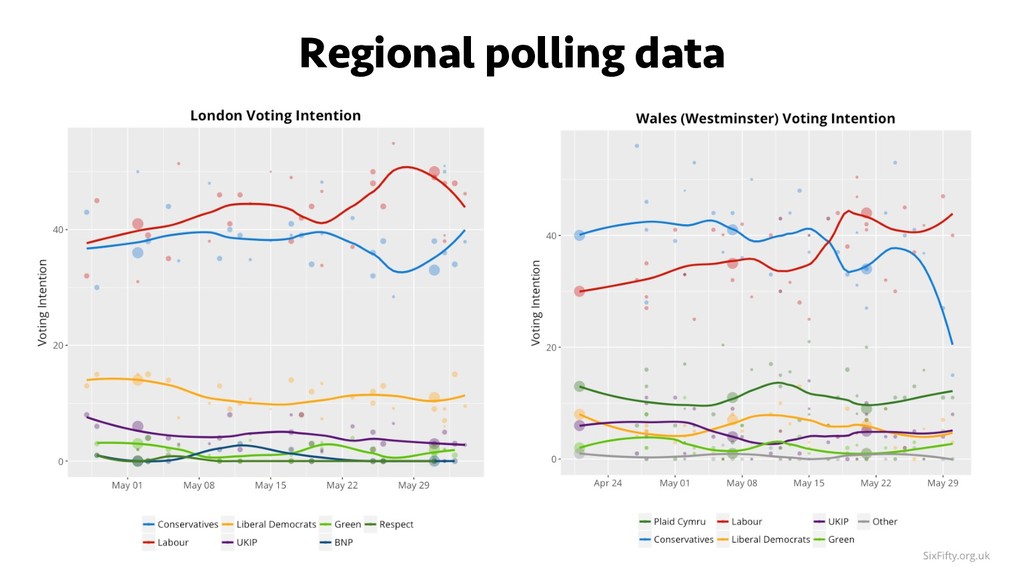
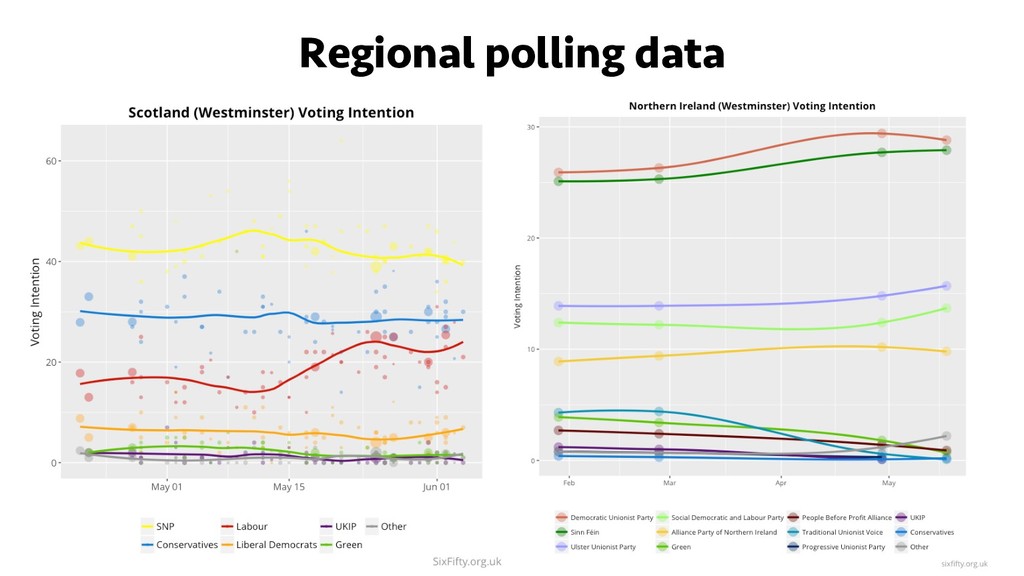
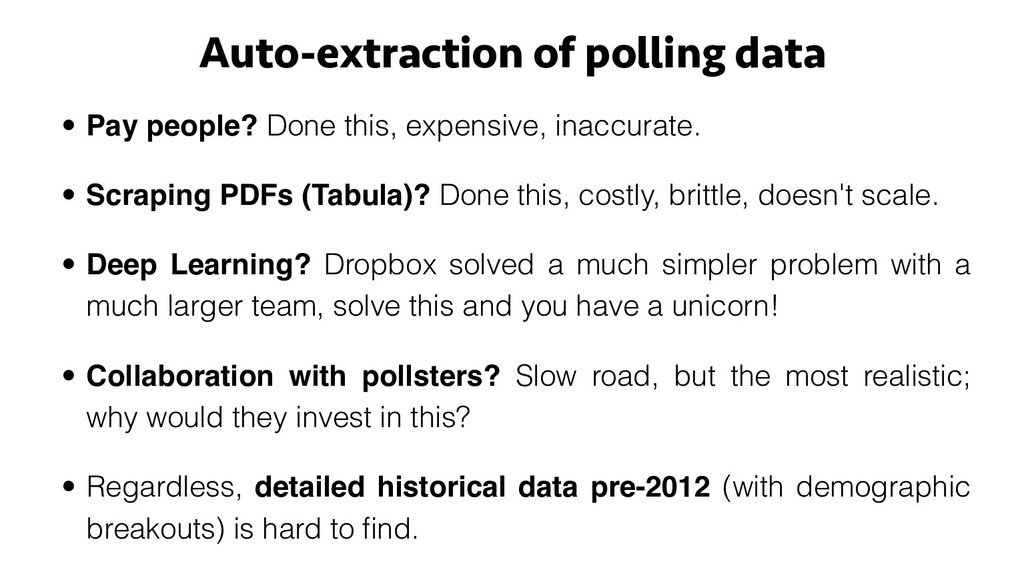
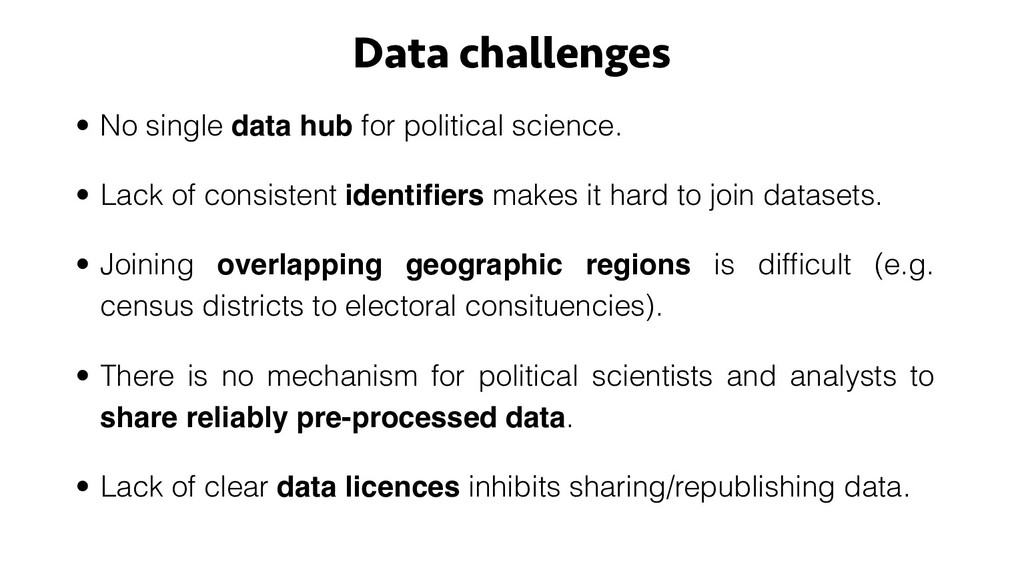
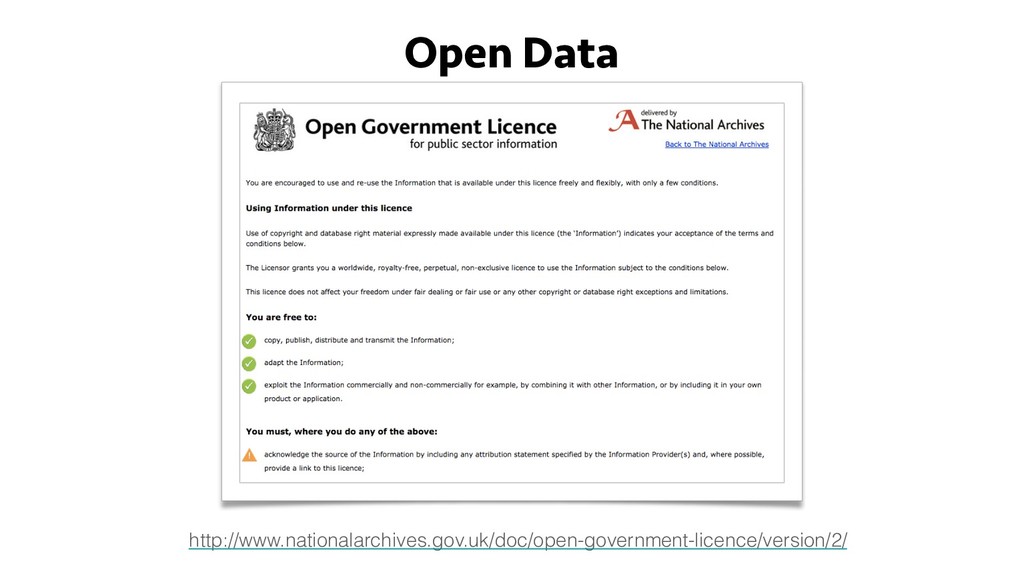
John Sandall is founder of SixFifty, a non-partisan collaboration of data scientists, software engineers, journalists and political experts who came together to try and predict the UK General Election using open data and advanced modelling techniques. He is also a Fellow of Newspeak House and co-organiser of PyData Bristol. He will talk through his experience of building models using machine learning techniques and how to use datasets which are publically available to build models.

John Sandall

June 06, 2019
Tweet

More Decks by John Sandall

Other Decks in Technology

Transcript

  1. Psephology 101
    BREAK INTO DATA SCIENCE
    John Sandall
    6th June 2019
    @john_sandall
    @SixFiftyData

    View Slide

  2. BREAK INTO DATA SCIENCE
    Hello

    View Slide

  3. WHAT IS DATA SCIENCE?
    Call to arms

    View Slide

  4. Comparison With Other Forecasts
    Forecast Predicted Conservative Majority
    YouGov -24 (hung)
    Final SixFifty ML model +22
    SixFifty national UNS model +24
    New Statesman +24
    SixFifty regional UNS model +34
    Lord Ashcroft +64
    Elections Etc +66
    Electoral Calculus +66
    Election Forecast +82

    View Slide

  5. Comparison With Other Forecasts
    https://www.thesun.co.uk/news/3686937/pollster-yougov-is-mocked-over-utter-tripe-poll-which-shows-theresa-may-losing-her-majority-in-election/

    View Slide

  6. UK #GE2017 Final Seat Projections

    View Slide

  7. TL;DR
    In seven weeks we built the most accurate election
    forecast built purely from public data.
    UK #GE2017 Final Seat Projections

    View Slide

  8. BREAK INTO DATA SCIENCE
    How To Forecast A
    General Election

    View Slide

  9. What are we doing?
    National vote share forecasts get a lot of media attention...
    https://www.theguardian.com/politics/2019/jun/01/brexit-party-nigel-farage-lead-
    opinion-poll-conservatives-opinium
    https://www.electoralcalculus.co.uk/

    View Slide

  10. What are we doing?
    ...but seat level forecasts can feed into strategic decision making
    https://www.electoralcalculus.co.uk/

    View Slide

  11. Forecasting Techniques
    1.Extrapolate from national polls
    2.Extrapolate from regional polling
    3.Maybe we can get better seat level accuracy by
    taking into account what happened last time?

    View Slide

  12. Uniform National Swing: A Case Study
    Welcome to Sheffield Hallam! (MP: Nick Clegg)
    2010
    Results
    (Sheffield
    Hallam)
    24%
    16%
    53%

    View Slide

  13. 2010
    Results
    (Sheffield
    Hallam)
    2010
    National
    Results
    2015
    National
    Polling
    24% 36% 33%
    16% 29% 33%
    53% 23% 9%
    Uniform National Swing: A Case Study
    Step 1. Compare national results with latest polling

    View Slide

  14. Uniform National Swing: A Case Study
    2010
    Results
    (Sheffield
    Hallam)
    2010
    National
    Results
    2015
    National
    Polling
    Uniform
    National
    Swing
    24% 36% 33% -8%
    16% 29% 33% +13%
    53% 23% 9% -62%
    Step 2. Calculate "uniform national swing" (i.e. uplift)

    View Slide

  15. Uniform National Swing: A Case Study
    2010
    Results
    (Sheffield
    Hallam)
    2010
    National
    Results
    2015
    National
    Polling
    Uniform
    National
    Swing
    2015
    Forecast
    (Sheffield
    Hallam)
    24% 36% 33% -8% 22%
    16% 29% 33% +13% 18%
    53% 23% 9% -62% 20%
    Step 3. Apply UNS to each constituency

    View Slide

  16. Uniform National Swing: A Case Study
    2010
    Results
    (Sheffield
    Hallam)
    2010
    National
    Results
    2015
    National
    Polling
    Uniform
    National
    Swing
    2015
    Forecast
    (Sheffield
    Hallam)
    24% 36% 33% -8% 22%
    16% 29% 33% +13% 18%
    53% 23% 9% -62% 20%
    Step 4. Forecast winner (Conservative victory?)

    View Slide

  17. Uniform National Swing: A Case Study
    Step 5. So who won? (Liberal Democrat victory)
    2010
    Results
    (Sheffield
    Hallam)
    2010
    National
    Results
    2015
    National
    Polling
    Uniform
    National
    Swing
    2015
    Forecast
    (Sheffield
    Hallam)
    2015
    Results
    (Sheffield
    Hallam)
    24% 36% 33% -8% 22% 14%
    16% 29% 33% +13% 18% 36%
    53% 23% 9% -62% 20% 40%

    View Slide

  18. Is there a better way?
    • Use regional polling where available.
    • Model out regional polls from national poll breakdowns.
    • Adjust each pollster for historical reliability or bias.
    • Adjust polls based on how they weight undecided voters.
    • Adjust based on current sentiments around polling accuracy.
    Uniform National Swing: A Case Study

    View Slide

  19. View Slide

  20. http://britainelects.com/polling/westminster/

    View Slide

  21. https://projects.fivethirtyeight.com/pollster-ratings/

    View Slide

  22. Multilevel Regression and Post-stratification (MRP)
    Read more: https://yougov.co.uk/topics/politics/articles-reports/
    2017/05/31/how-yougov-model-2017-general-election-works

    View Slide

  23. • Use rigorous & modern modelling techniques.
    • Cross-validate, backtest, evaluate for predictive accuracy.
    • Blend in multiple data sources, not just polling.
    • Greater understanding of what drives election outcomes.
    • Open source our code, data, methodology.
    Is there a better way?

    View Slide

  24. BREAK INTO DATA SCIENCE
    How To Evaluate
    A Forecast
    Methodology

    View Slide

  25. Backtesting
    If we simulated the last three elections...
    ...using ONLY data that was available before election night...
    ...how does each technique do?

    View Slide

  26. Backtesting
    If we simulated the last three elections...
    ...using ONLY data that was available before election night...
    ...how does each technique do?
    Error / seat
    50%
    58%
    67%
    75%
    2010 2015 2017

    View Slide

  27. Backtesting
    If we simulated the last three elections...
    ...using ONLY data that was available before election night...
    ...how does each technique do?
    Error / seat
    50%
    58%
    67%
    75%
    2010 2015 2017

    View Slide

  28. BREAK INTO DATA SCIENCE
    Polling data

    View Slide

  29. What does polling data look like?

    View Slide

  30. Raw data looks like:

    View Slide

  31. Raw data contains:
    • Voting Intention (“Which party will you be voting for on June 8th?”)
    • Party leader satisfaction
    • Policy preferences (“Do you think tuition fees should be abolished?”)
    • Demographic background (location, gender, age, education, etc)
    • Voted during EU Referendum? Remain or Leave?
    • Voted during 2015 general election? Which party voted for?
    • Questions designed to gauge likelihood of voting

    View Slide

  32. Easily accessible? Methodology? Regional?

    View Slide

  33. Polling data on SixFifty.org.uk
    https://sixfifty.org.uk/polls

    View Slide

  34. Regional polling data

    View Slide

  35. Regional polling data

    View Slide

  36. Regional polling data

    View Slide

  37. Auto-extraction of polling data
    • Pay people? Done this, expensive, inaccurate.
    • Scraping PDFs (Tabula)? Done this, costly, brittle, doesn't scale.
    • Deep Learning? Dropbox solved a much simpler problem with a
    much larger team, solve this and you have a unicorn!
    • Collaboration with pollsters? Slow road, but the most realistic;
    why would they invest in this?
    • Regardless, detailed historical data pre-2012 (with demographic
    breakouts) is hard to find.

    View Slide

  38. BREAK INTO DATA SCIENCE
    Open Data + Politics

    View Slide

  39. Data challenges
    • No single data hub for political science.
    • Lack of consistent identifiers makes it hard to join datasets.
    • Joining overlapping geographic regions is difficult (e.g.
    census districts to electoral consituencies).
    • There is no mechanism for political scientists and analysts to
    share reliably pre-processed data.
    • Lack of clear data licences inhibits sharing/republishing data.

    View Slide

  40. Open Data
    http://www.nationalarchives.gov.uk/doc/open-government-licence/version/2/

    View Slide

  41. Are Polls Open Data?

    View Slide

  42. Are Polls Open Data?

    View Slide

  43. • Python package for automatically downloading, processing,
    joining and creating model ready datasets.
    • Automatically cleans and standardises lookup identifiers.
    • Moves towards open data whilst respecting licenses by doing
    all of this on device.
    My solution
    What else can I do?
    What can communities like Campaign Lab do?

    View Slide

  44. BREAK INTO DATA SCIENCE
    @john_sandall
    @SixFiftyData
    Thank You

    View Slide