Upgrade to Pro — share decks privately, control downloads, hide ads and more …

Алексей Рагозин — Мастер-класс по Java Mission Control

Алексей Рагозин — Мастер-класс по Java Mission Control

Java Flight Recorder — это подсистема Oracle JVM, которая позволяет собирать диагностическую информацию, минимально нагружая работающее приложение.

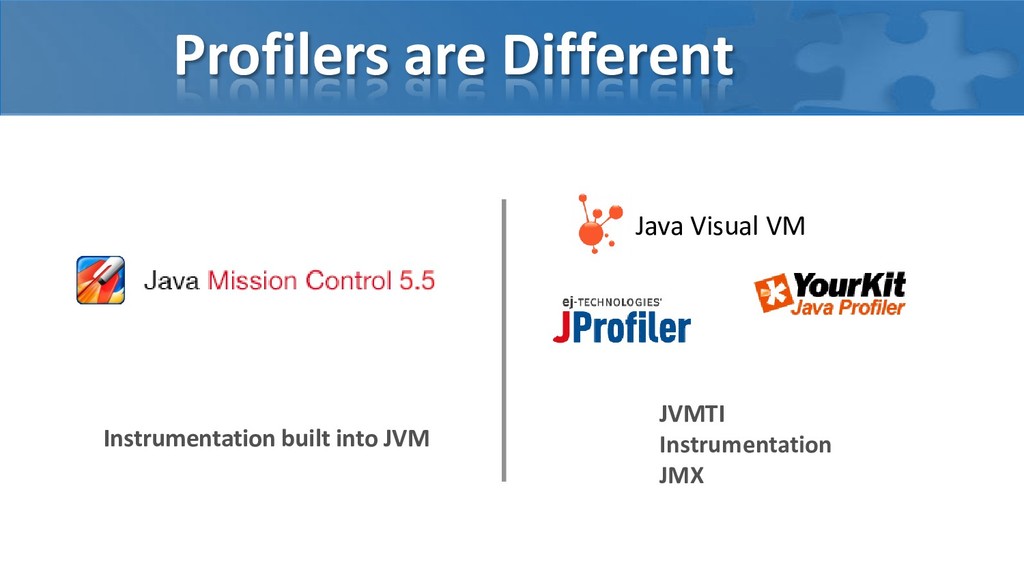
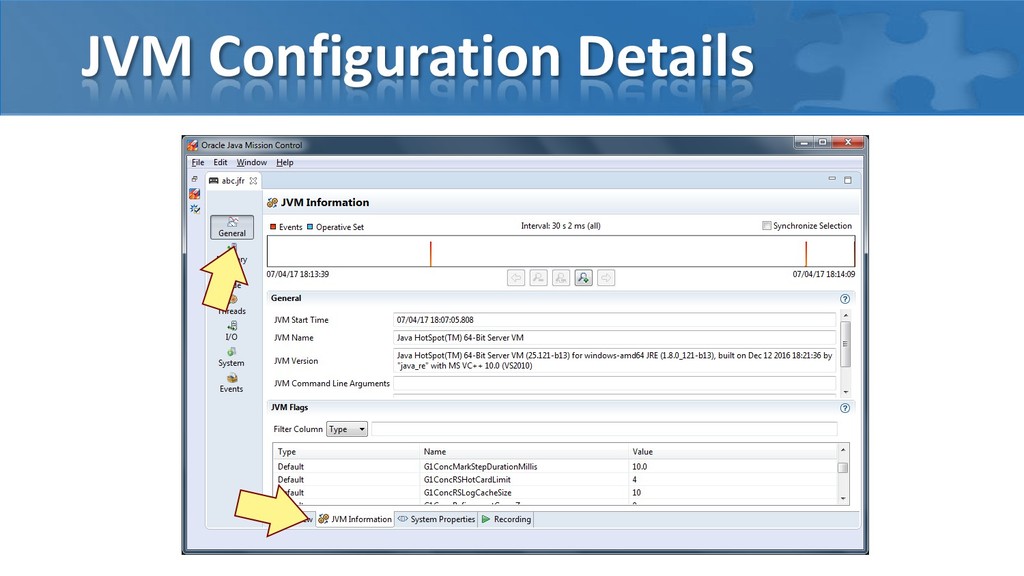
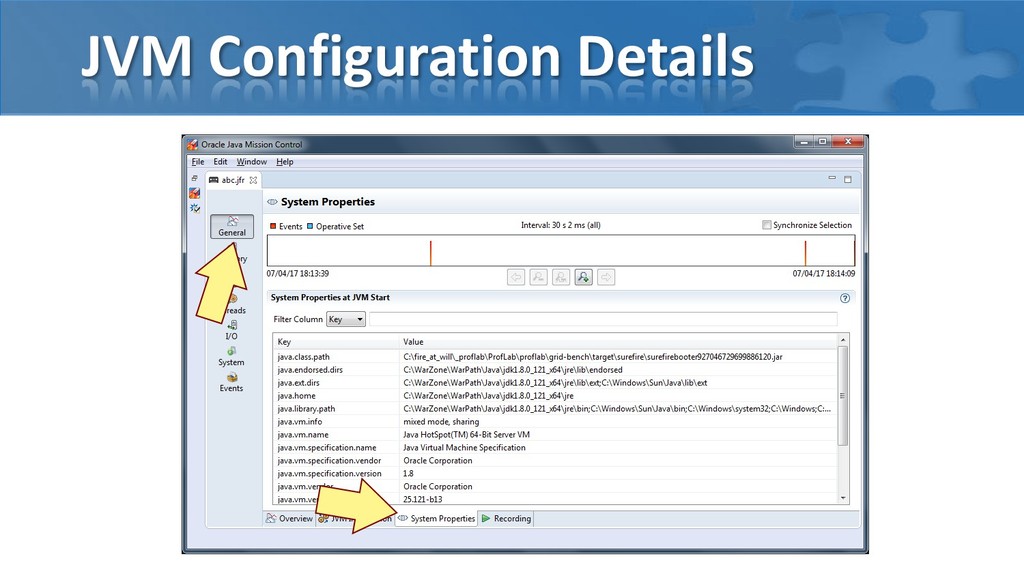
Java Mission Control — графический инструмент, входящий в поставку Oracle JDK, позволяющий анализировать информацию, собранную Java Flight Recorder. Одно из применений Flight Recorder — поиск проблем производительности.

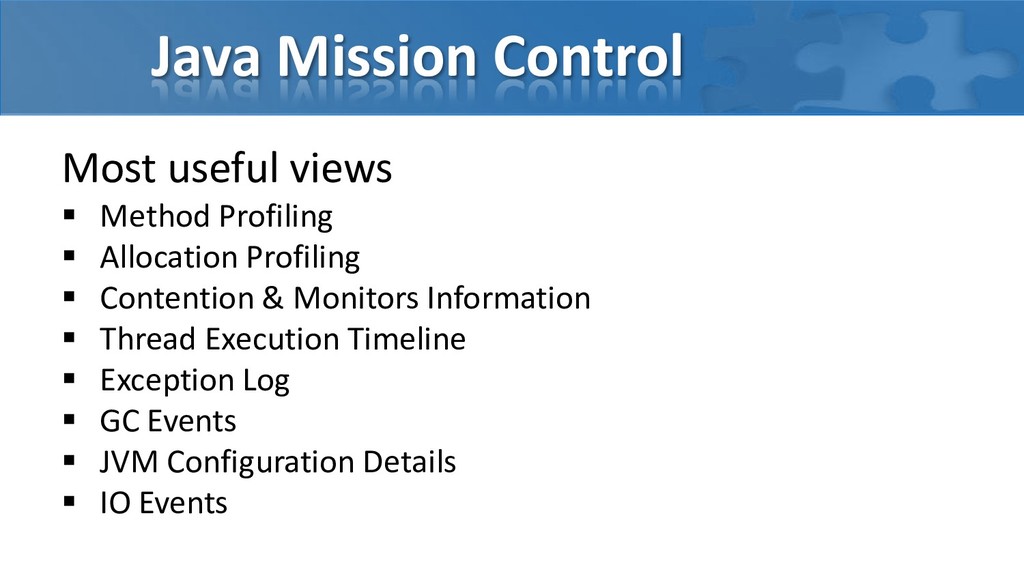
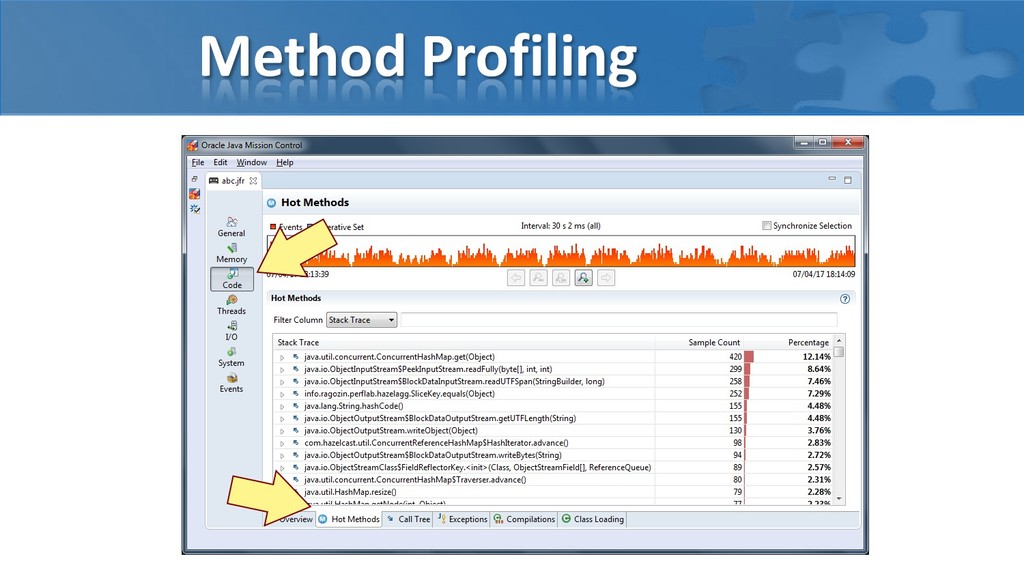
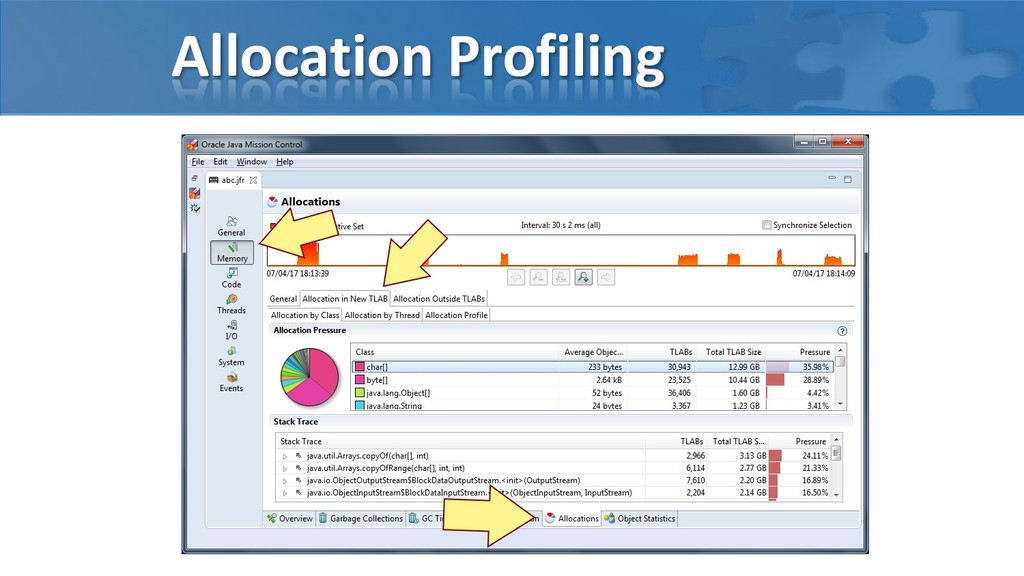
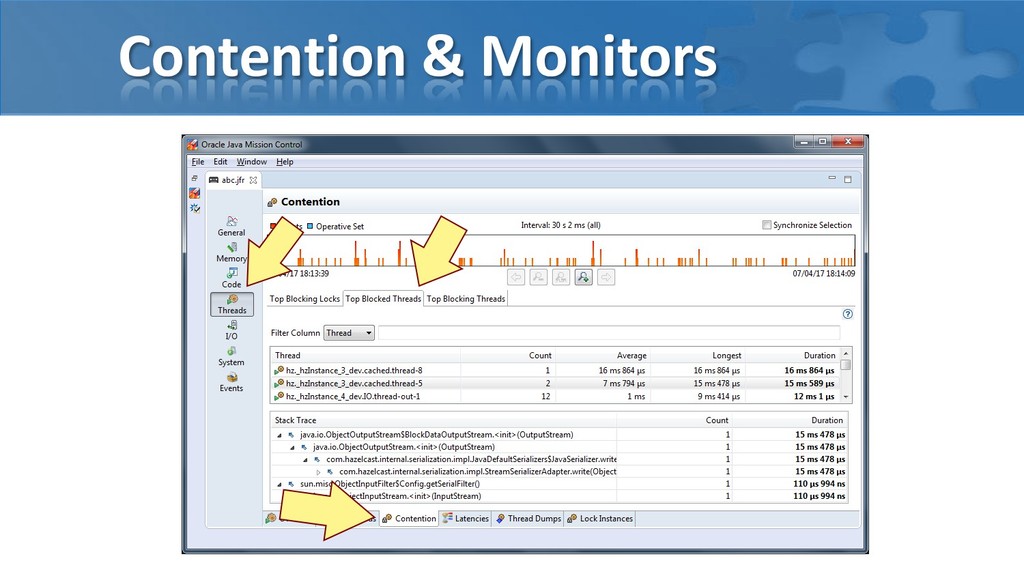
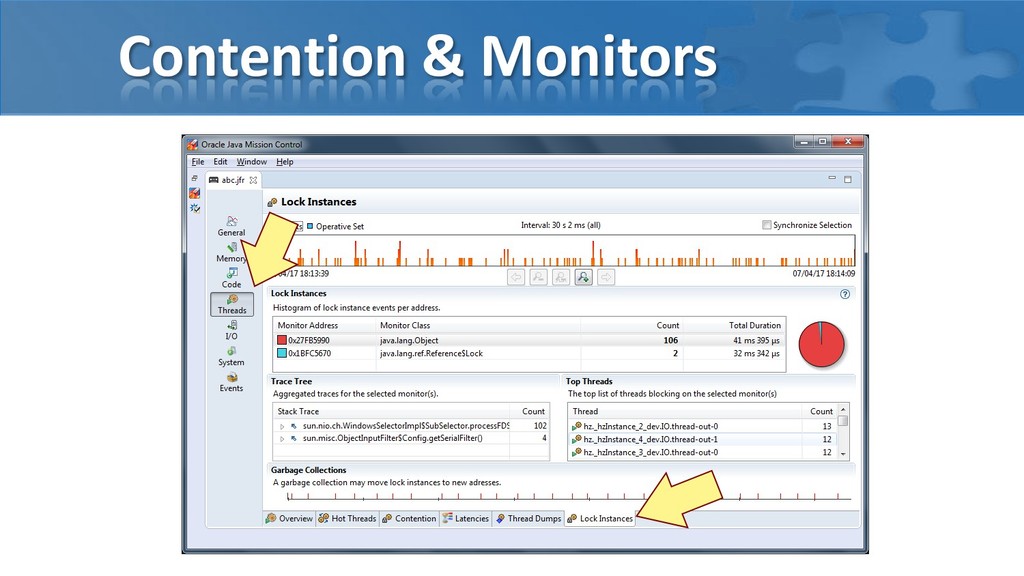
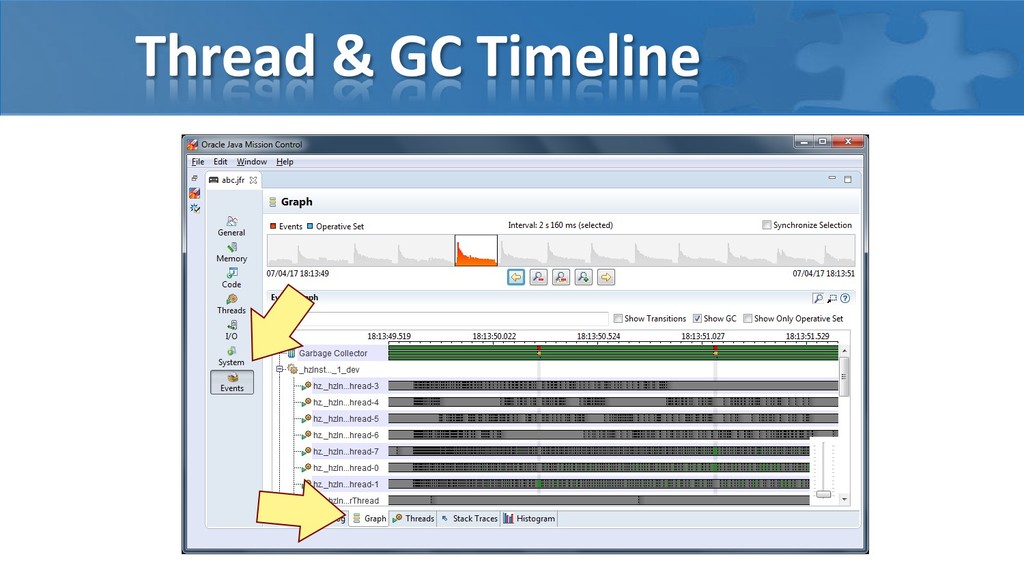
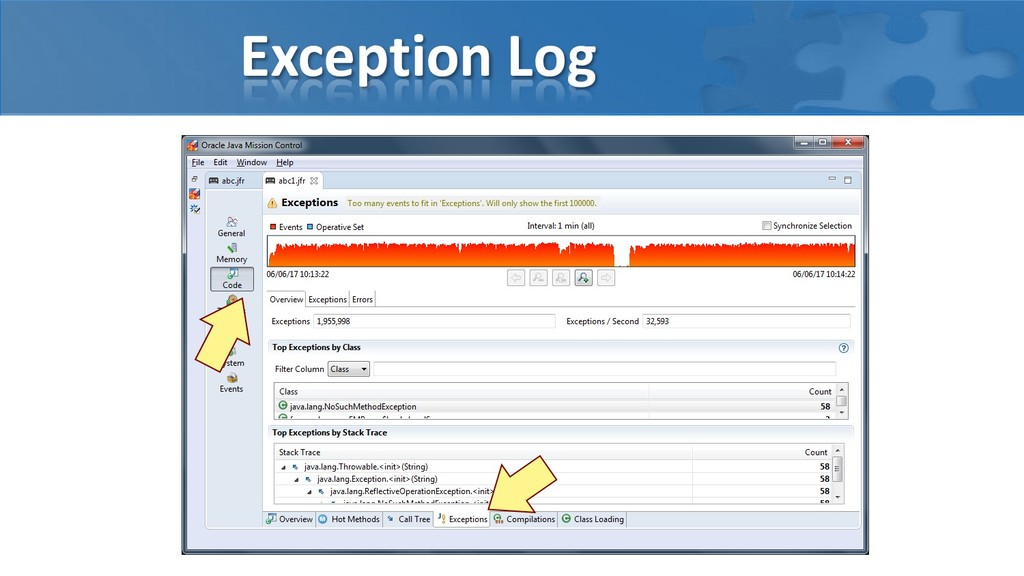
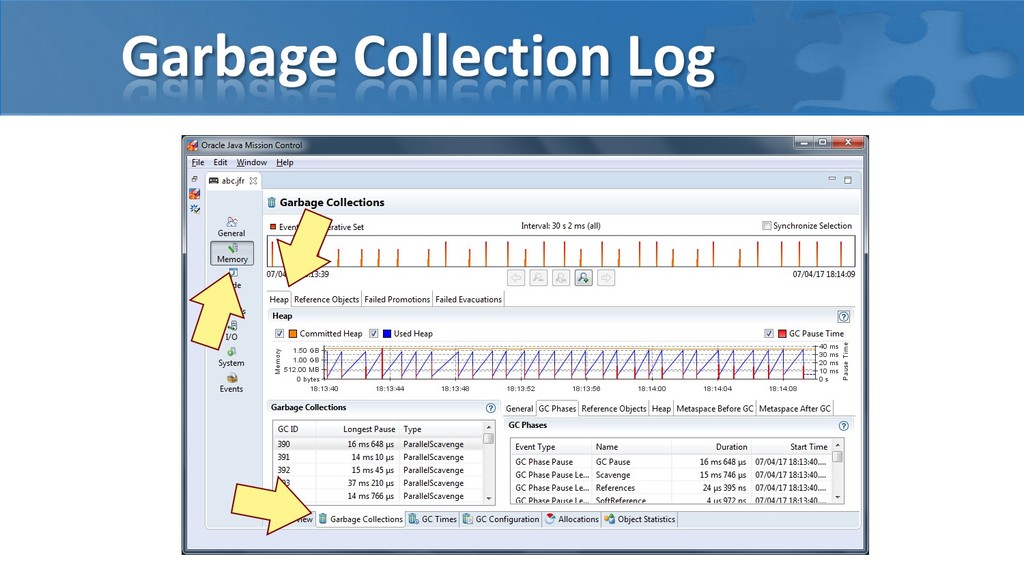
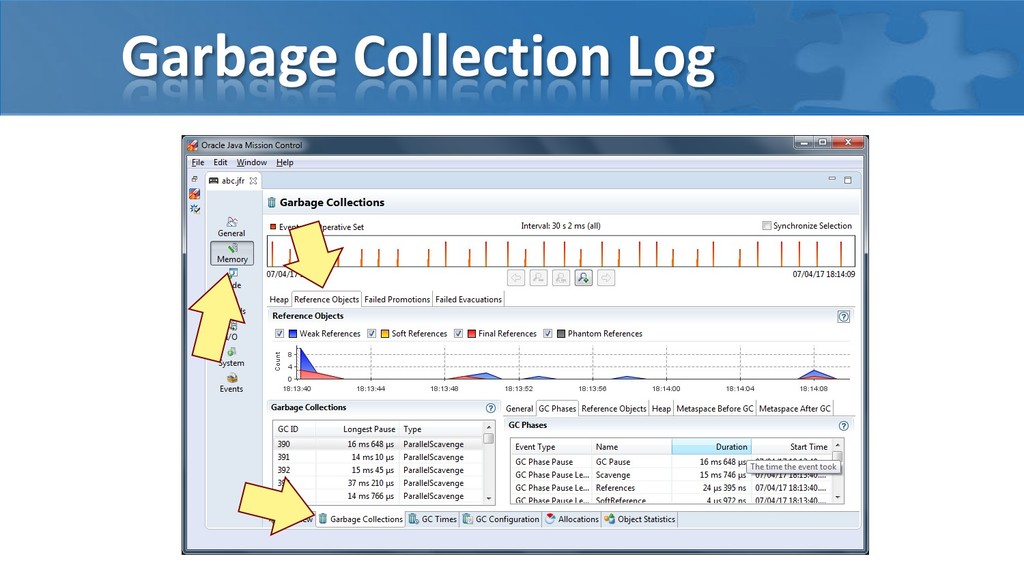
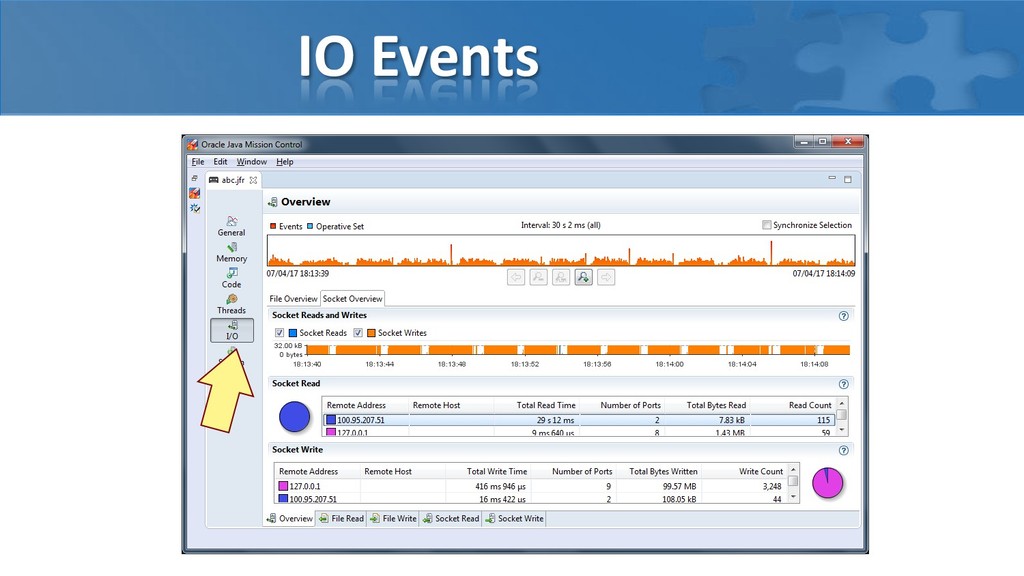
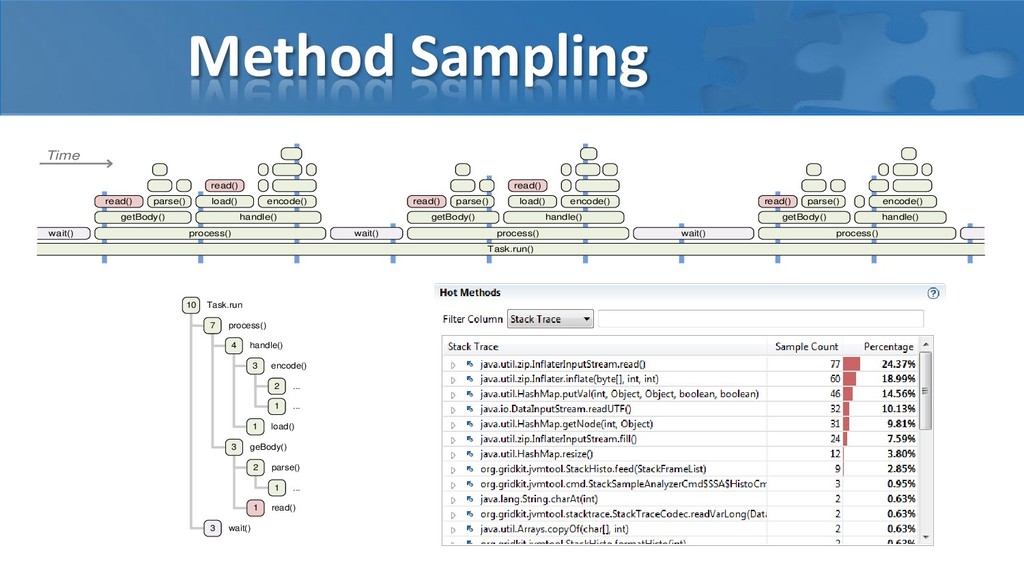
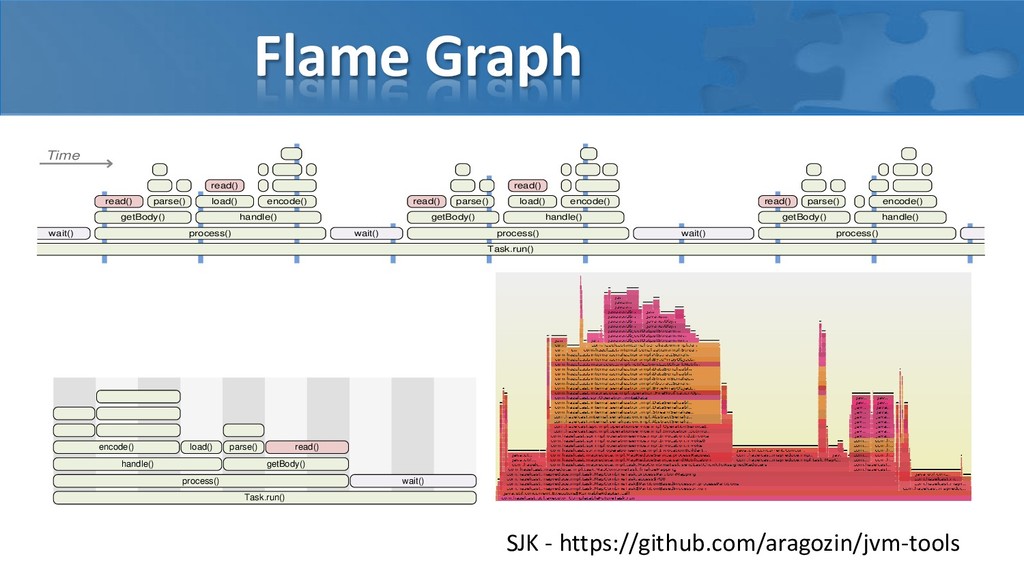
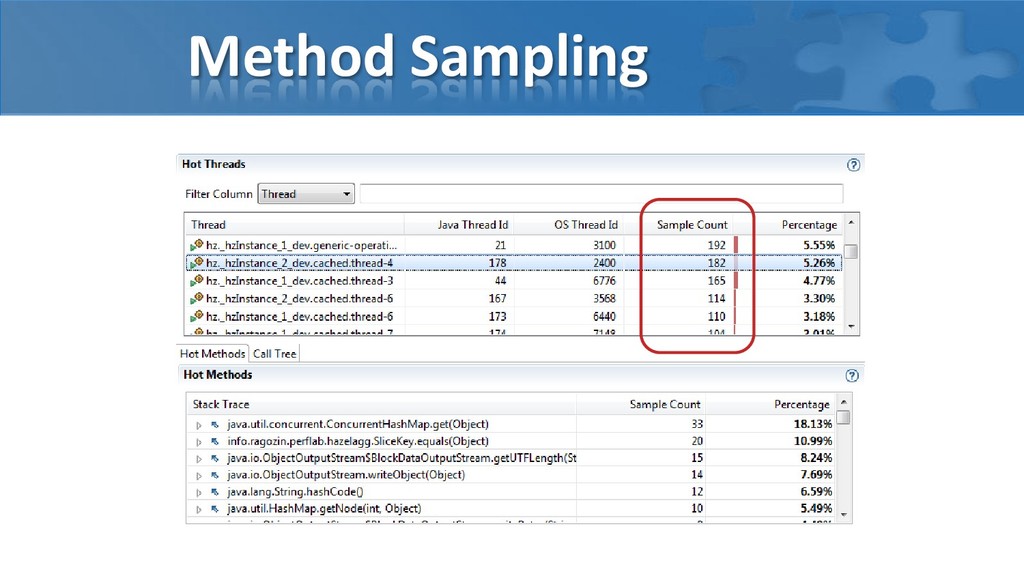
В рамках мастер-класса будут продемонстрированы приёмы поиска типовых проблем, таких как «горячие участки» кода, источники мусора и т.п., с использованием Mission Control / Flight Recorder.

Moscow JUG

March 13, 2018
Tweet

More Decks by Moscow JUG

Other Decks in Programming

Transcript

  1. Java Mission Control • Session Profiling – classic • JVM

    Startup Profiling • Continuous Profiling
  2. Java Mission Control Most useful views  Method Profiling 

    Allocation Profiling  Contention & Monitors Information  Thread Execution Timeline  Exception Log  GC Events  JVM Configuration Details  IO Events
  3. Profiling Session Configuration  Garbage Collector  Complier  Method

    Sampling  Thread Dump  Exceptions  Synchronization Threshold  File I/O Threshold  Socket I/O Threshold  Heap Statistics  Class Loading  Allocation Profiling Enforces Safepoints May be slow if there are many exceptions Set low threshold for profiling Enforces Full GC
  4. Method Sampling Tracing  Instrument and record every interesting change

    in observed system Sampling  Capture periodic snapshots of observed system Task.run() wait() process() getBody() read() parse() handle() load() read() Time encode() wait() process() getBody() read() parse() handle() load() read() encode() wait() process() getBody() read() parse() handle() encode()
  5. Method Sampling Task.run() wait() process() getBody() read() parse() handle() load()

    read() Time encode() wait() process() getBody() read() parse() handle() load() read() encode() wait() process() getBody() read() parse() handle() encode() 10 Task.run 7 3 process() 4 handle() 3 encode() 2 ... 1 ... 1 load() geBody() 2 1 read() parse() 1 ... 3 wait()
  6. Flame Graph Task.run() wait() process() getBody() read() parse() handle() load()

    read() Time encode() wait() process() getBody() read() parse() handle() load() read() encode() wait() process() getBody() read() parse() handle() encode() Task.run() process() wait() getBody() handle() read() parse() load() encode() SJK - https://github.com/aragozin/jvm-tools
  7. Method Sampling Traditional Profilers  Dump all threads periodically –

    Stop The World  JVM can suspend thread on in discrete points of execution Flight Recorder  Threads sampled during execution of Java code  No Safepoints / No Stop The World  No samples is thread is not running!
  8. Method Sampling Bias Problem – Frequent JNI calls into InflaterInputStream

    Java Flight Recorder SJK (JMX sampling) perf * * https://github.com/jvm-profiling-tools/perf-map-agent Total samples 5653 100.00% ZIP 2659 47.04% Other 2994 52.96% Total samples 2905 100.00% ZIP 2870 98.80% Other 35 1.20% Total samples 59896 100.00% ZIP 54771 91.44% Other 5125 8.56%
  9. Method Sampling Bias Problem – Frequent JNI calls into InflaterInputStream

    Fix - 92% (565ms -> 45ms) Java Flight Recorder SJK (JMX sampling) perf * * https://github.com/jvm-profiling-tools/perf-map-agent Total samples 5653 100.00% ZIP 2659 47.04% Other 2994 52.96% Total samples 2905 100.00% ZIP 2870 98.80% Other 35 1.20% Total samples 59896 100.00% ZIP 54771 91.44% Other 5125 8.56%
  10. Execution Time Optimization  Prove what you spend time in

    code not in wait  Double check with Visual VM or other profiler  Use contention, events and thread timeline views  Set thresholds to 0
  11. Allocation Sampling Instrumentation – Normal Profilers  Instrument every new

    instruction  Expensive!  Interfere JVM optimizations Flight Recorder  Fast path – Object allocated from TLAB  Slow path – new TLAB have to be allocated  Sample on slow path (every few hundreds of kB)  Non uniform sampling (TLAB size is dynamic) Sampled
  12. Summary Method sampling Method tracing  Generic  IO Allocation

    sampling Heap dump inspection Startup profiling Continuous profiling Flight Recorder Only Java code Low overhead No Built-in events Low overhead No Yes May require license Classic Java Profiler On Safepoints High overhead Yes - High overhead Yes ? ?