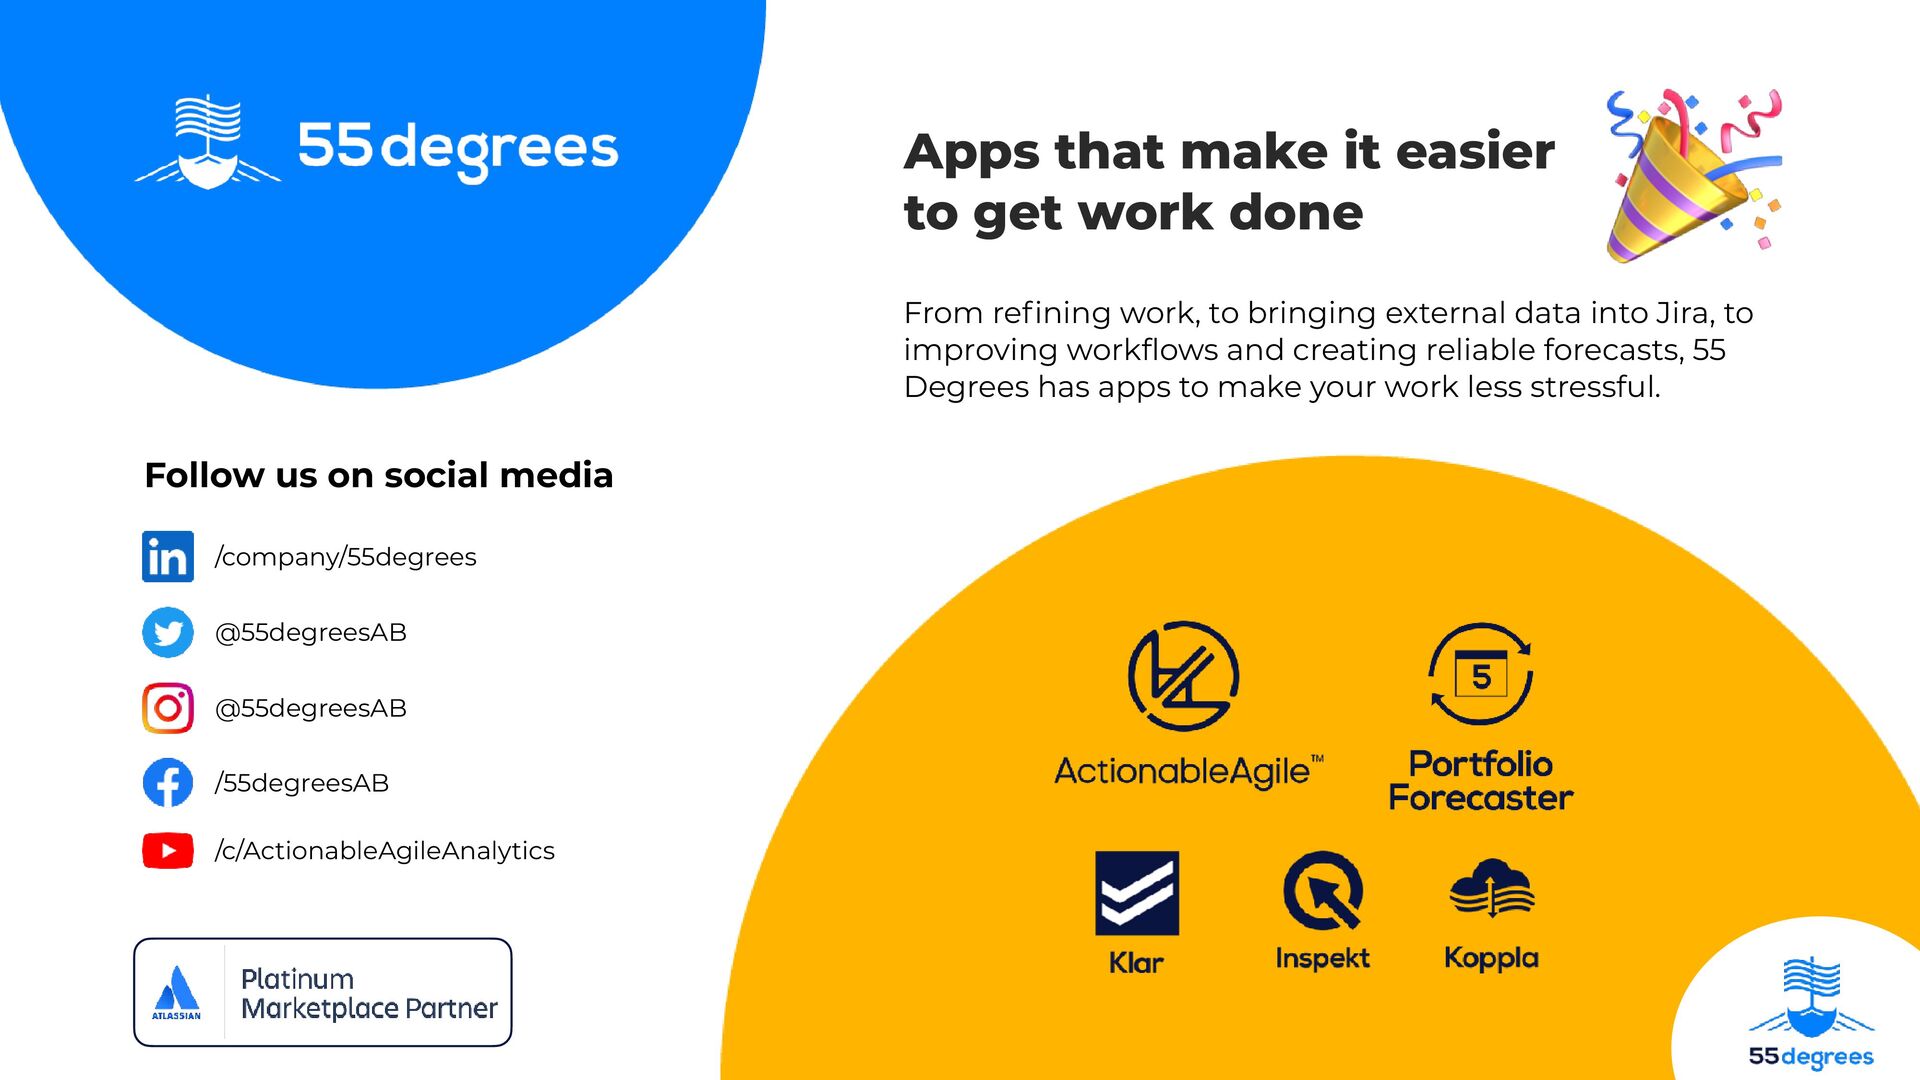
@55degreesAB /55degreesAB /c/ActionableAgileAnalytics Apps that make it easier to get work done 🎉 From re fi ning work, to bringing external data into Jira, to improving work fl ows and creating reliable forecasts, 55 Degrees has apps to make your work less stressful.
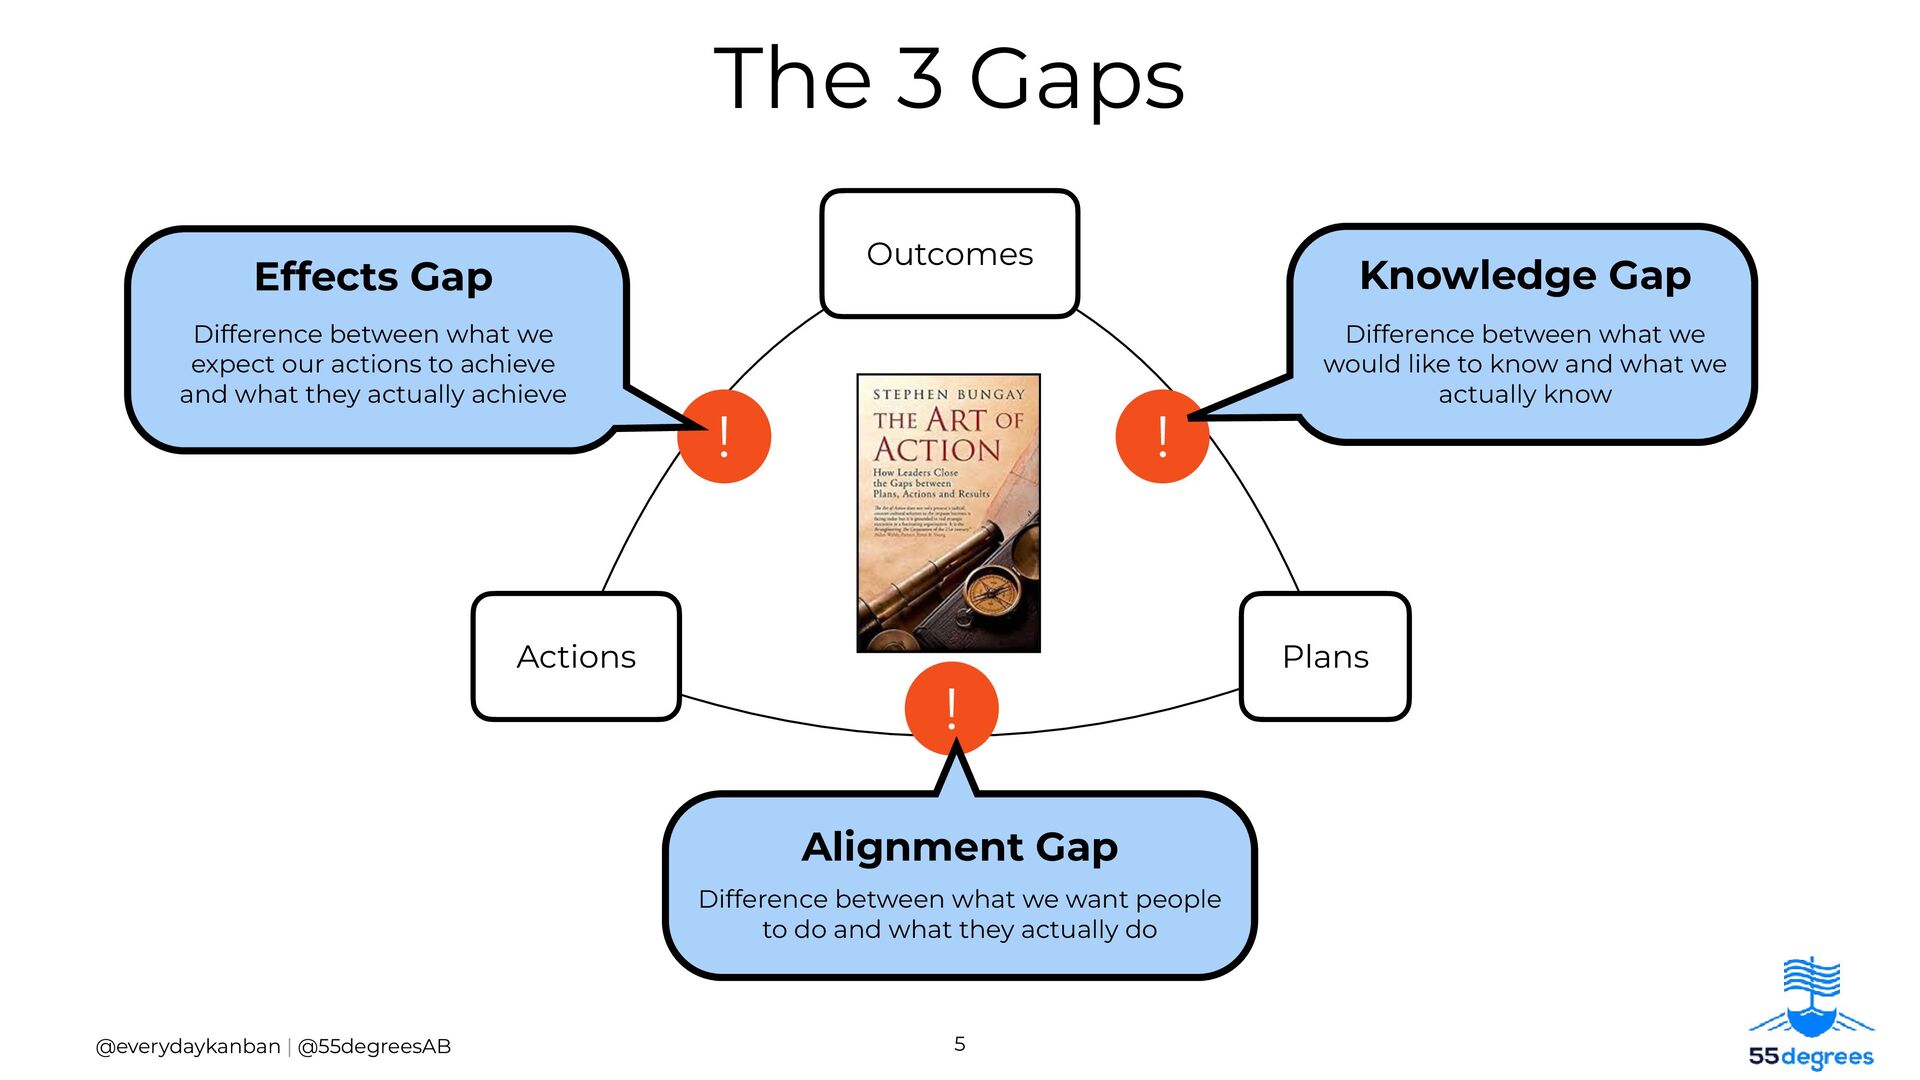
! Effects Gap Difference between what we expect our actions to achieve and what they actually achieve ! Knowledge Gap Difference between what we would like to know and what we actually know ! Alignment Gap Difference between what we want people to do and what they actually do
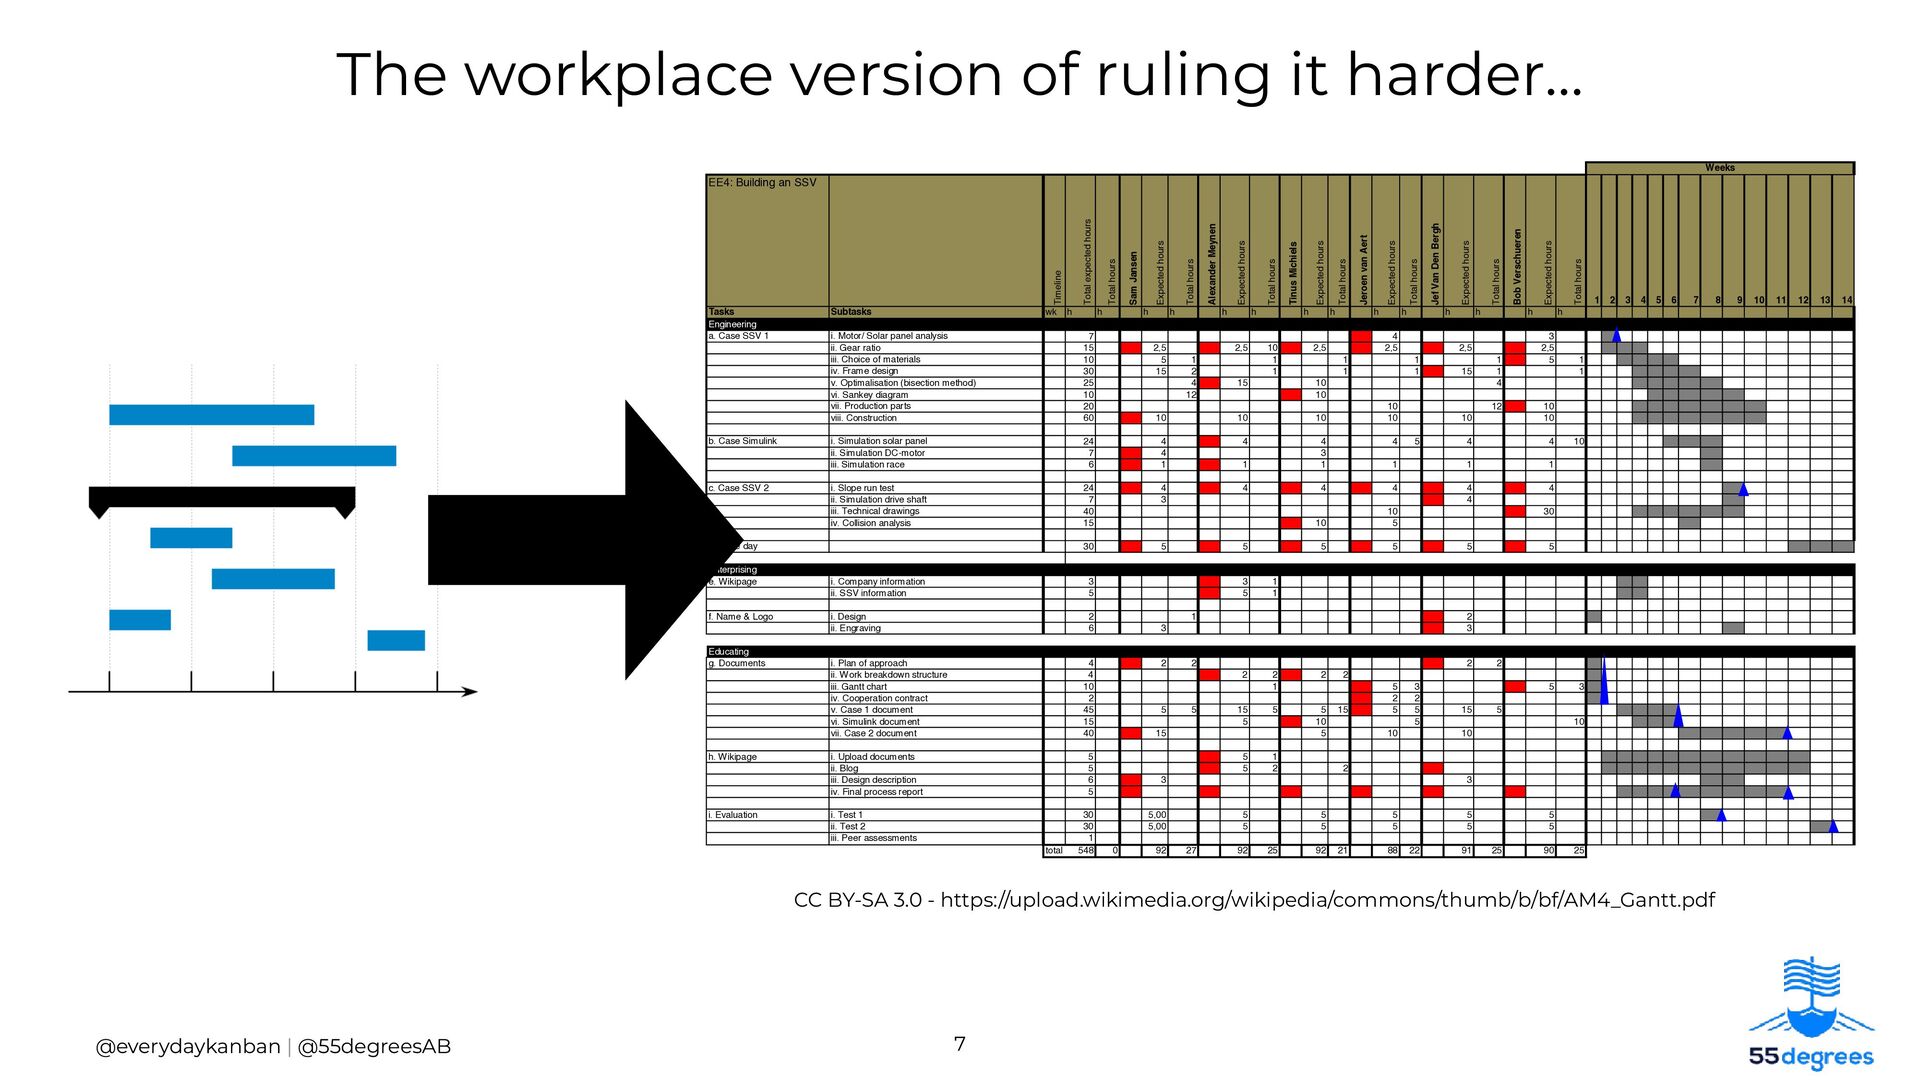
expected hours Total hours Sam Jansen Expected hours Total hours Alexander Meynen Expected hours Total hours Tinus Michiels Expected hours Total hours Jeroen van Aert Expected hours Total hours Jef Van Den Bergh Expected hours Total hours Bob Verschueren Expected hours Total hours 1 2 3 4 5 6 7 8 9 10 11 12 13 14 Tasks Subtasks wk h h h h h h h h h h h h h h Engineering a. Case SSV 1 i. Motor/ Solar panel analysis 7 4 3 ii. Gear ratio 15 2,5 2,5 10 2,5 2,5 2,5 2,5 iii. Choice of materials 10 5 1 1 1 1 1 5 1 iv. Frame design 30 15 2 1 1 1 15 1 1 v. Optimalisation (bisection method) 25 4 15 10 4 vi. Sankey diagram 10 12 10 vii. Production parts 20 10 12 10 viii. Construction 60 10 10 10 10 10 10 b. Case Simulink i. Simulation solar panel 24 4 4 4 4 5 4 4 10 ii. Simulation DC-motor 7 4 3 iii. Simulation race 6 1 1 1 1 1 1 c. Case SSV 2 i. Slope run test 24 4 4 4 4 4 4 ii. Simulation drive shaft 7 3 4 iii. Technical drawings 40 10 30 iv. Collision analysis 15 10 5 d. Race day 30 5 5 5 5 5 5 Enterprising e. Wikipage i. Company information 3 3 1 ii. SSV information 5 5 1 f. Name & Logo i. Design 2 1 2 ii. Engraving 6 3 3 g. Documents i. Plan of approach 4 2 2 2 2 ii. Work breakdown structure 4 2 2 2 2 iii. Gantt chart 10 1 5 3 5 3 iv. Cooperation contract 2 2 2 v. Case 1 document 45 5 5 15 5 5 15 5 5 15 5 vi. Simulink document 15 5 10 5 10 vii. Case 2 document 40 15 5 10 10 h. Wikipage i. Upload documents 5 5 1 ii. Blog 5 5 2 2 iii. Design description 6 3 3 iv. Final process report 5 i. Evaluation i. Test 1 30 5,00 5 5 5 5 5 ii. Test 2 30 5,00 5 5 5 5 5 iii. Peer assessments 1 total 548 0 92 27 92 25 92 21 88 22 91 25 90 25 Legende milestone responsibillity Gantt chart 1 Educating Weeks The workplace version of ruling it harder… CC BY-SA 3.0 - https://upload.wikimedia.org/wikipedia/commons/thumb/b/bf/AM4_Gantt.pdf
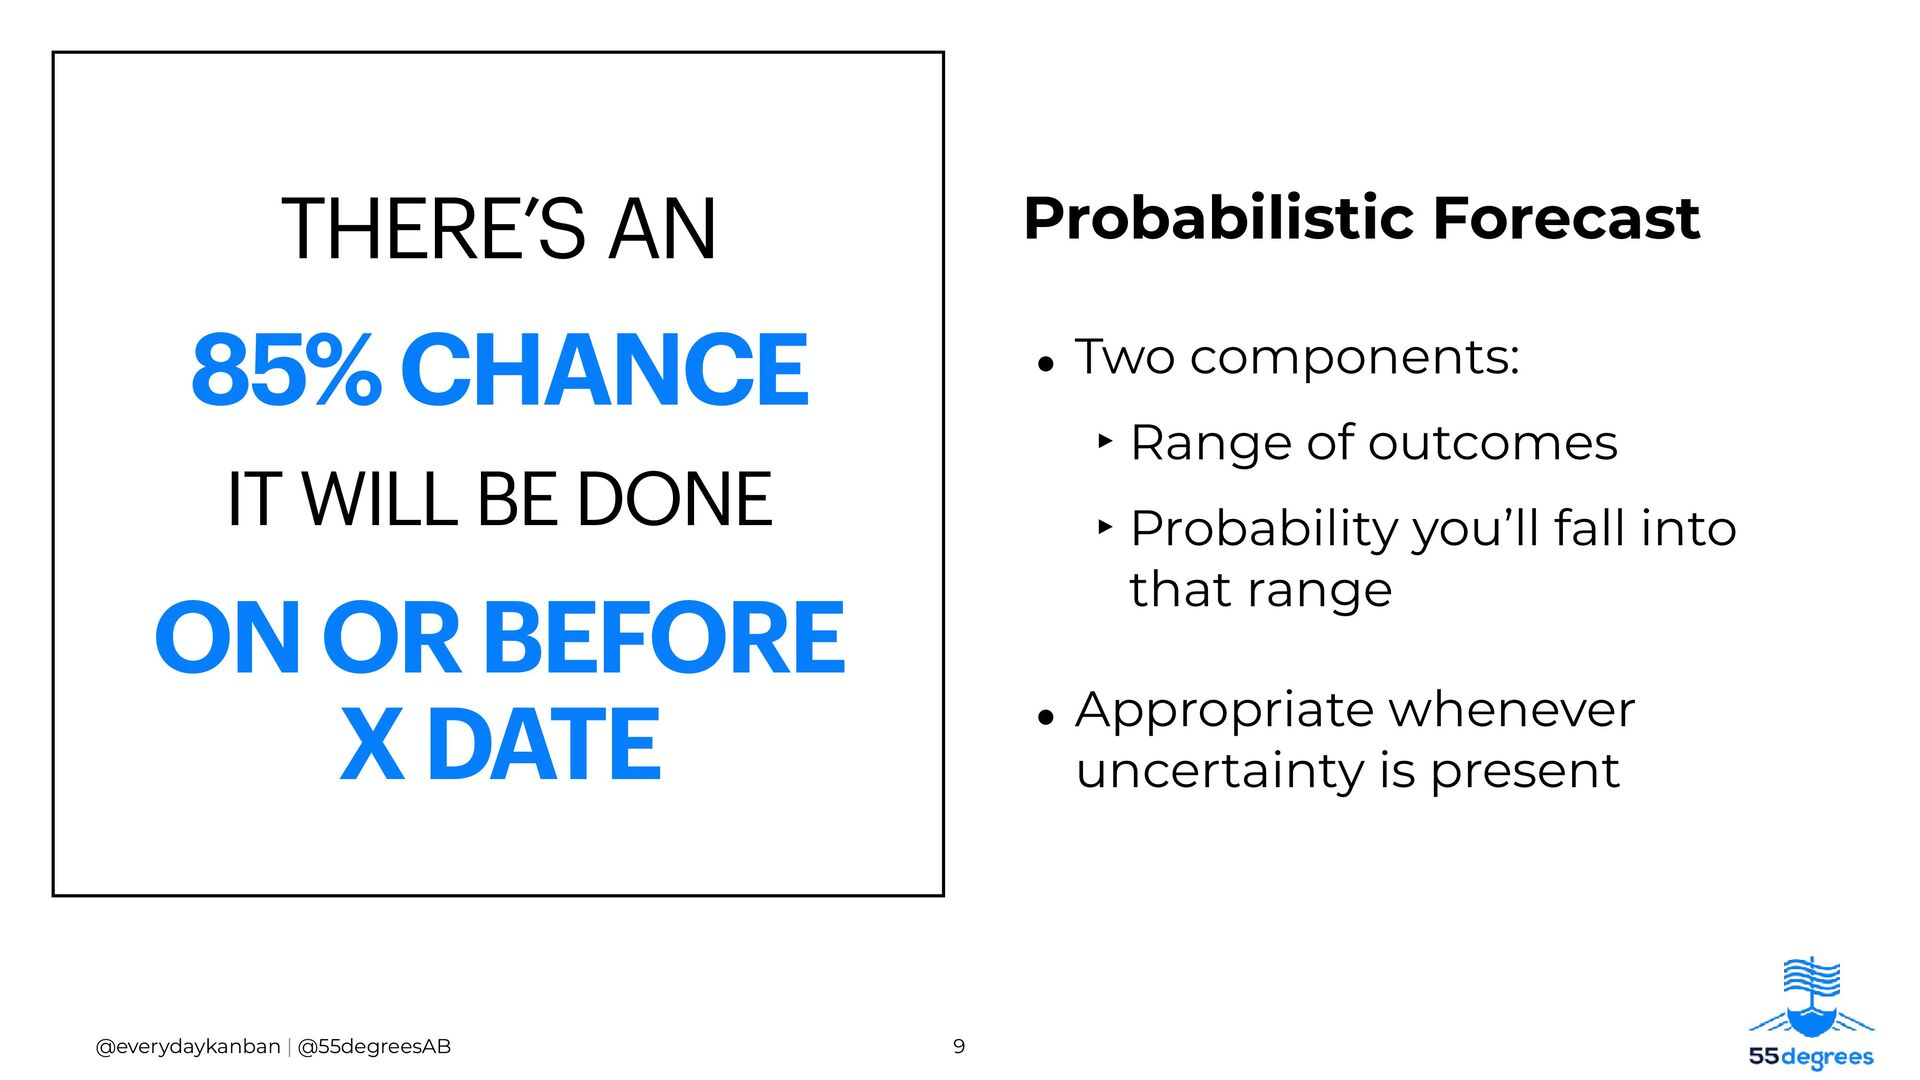
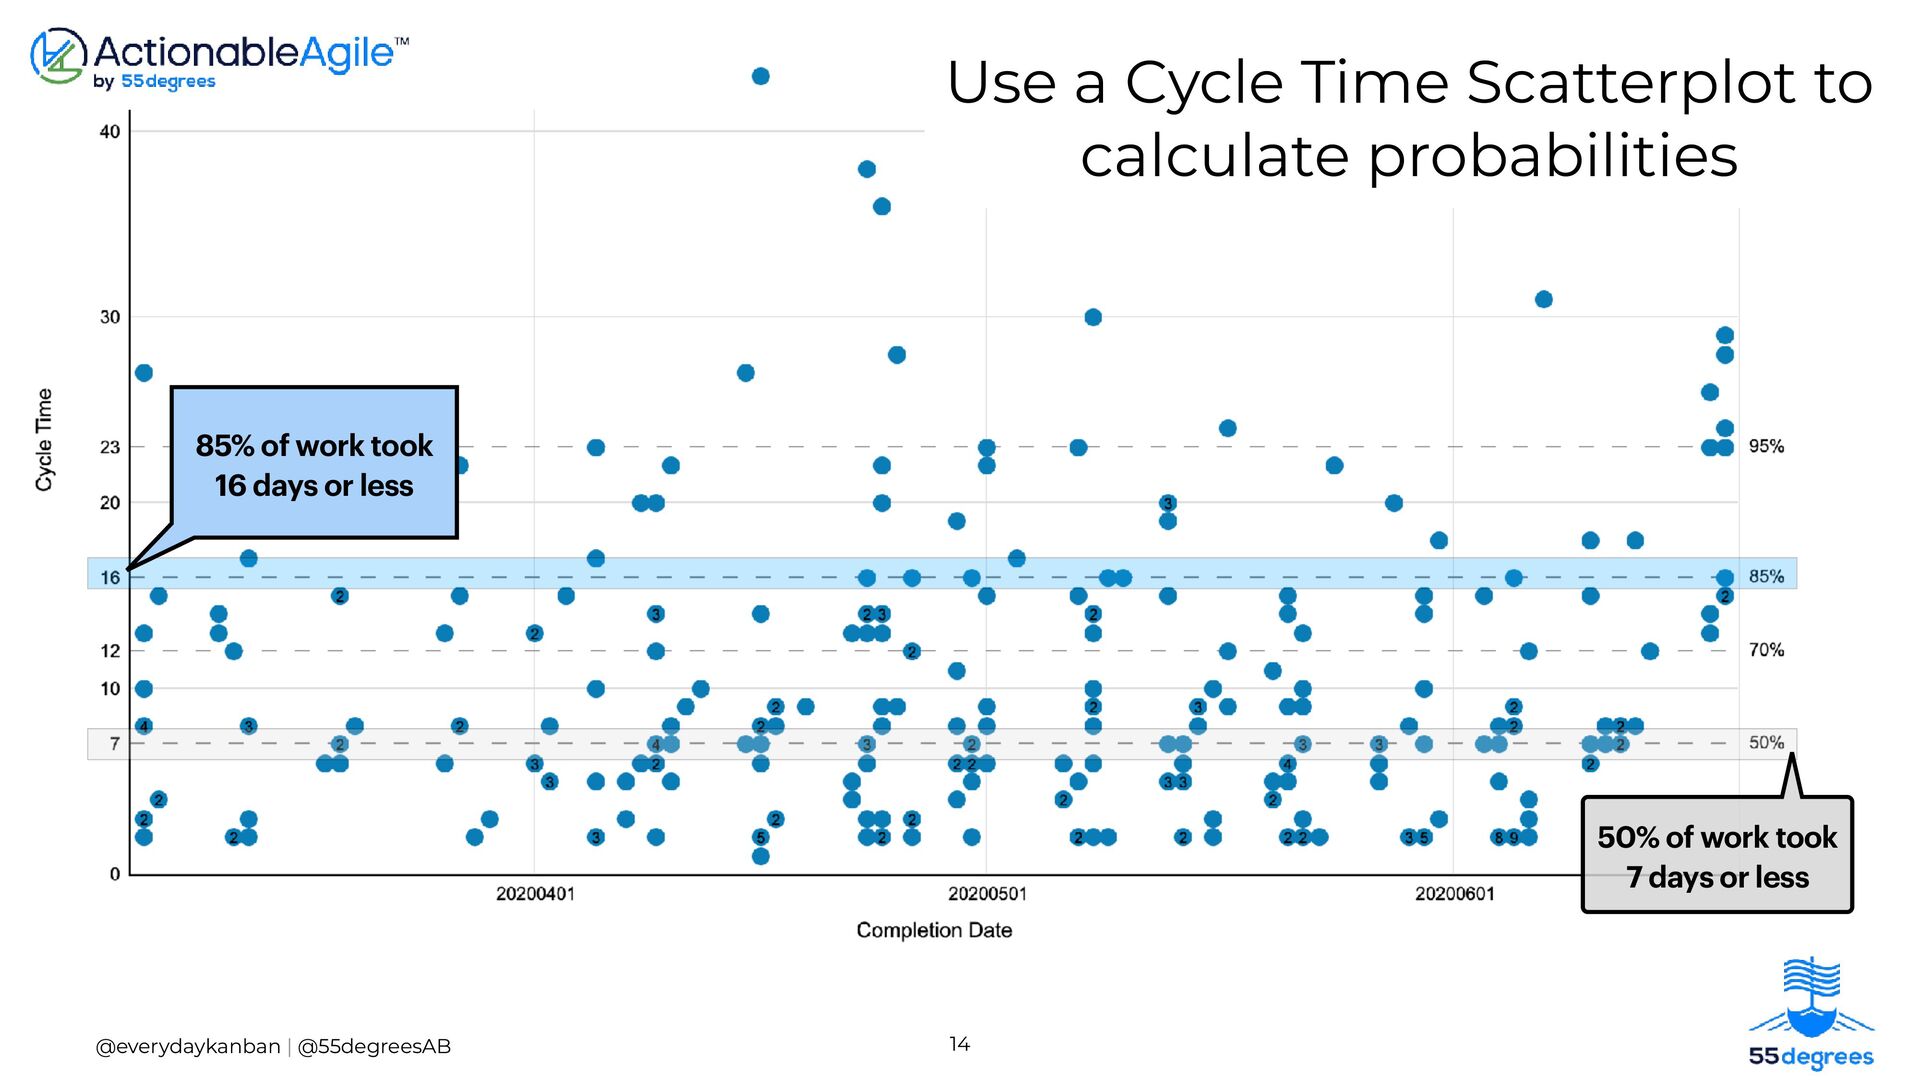
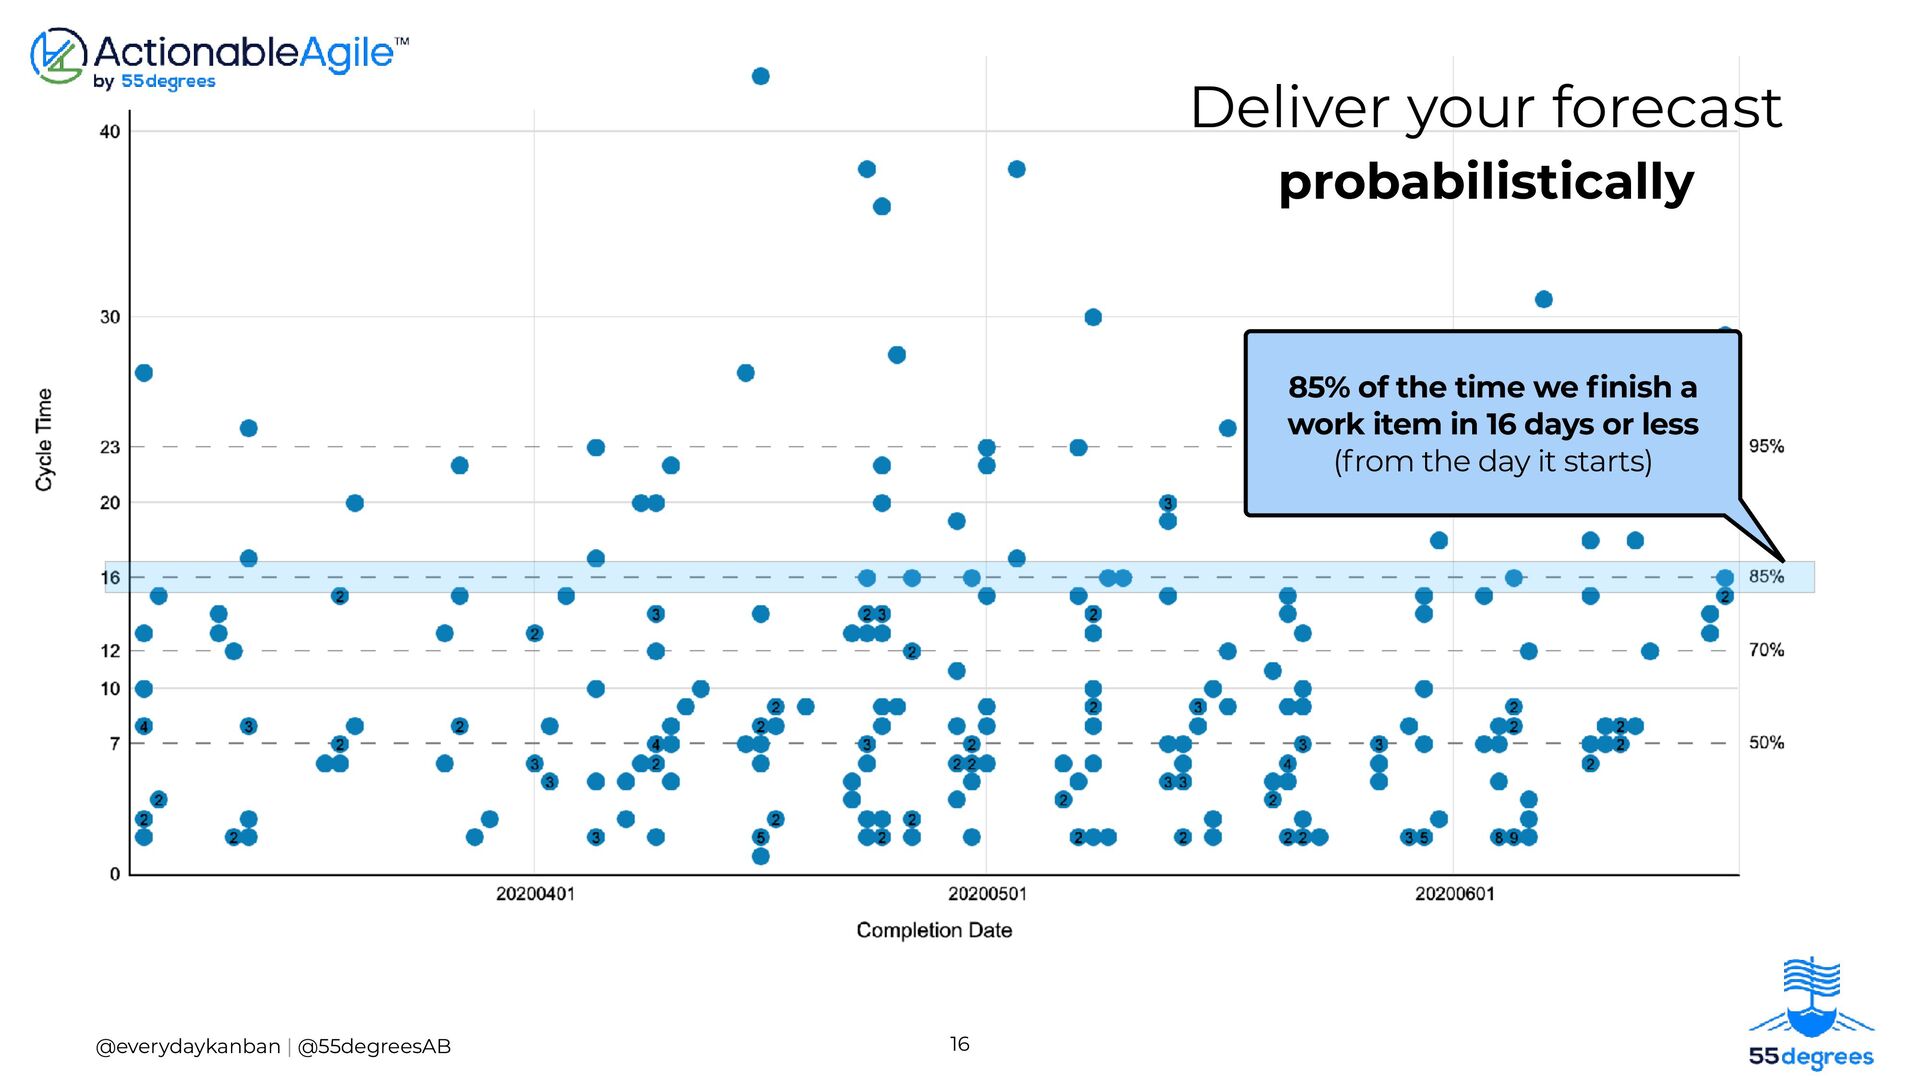
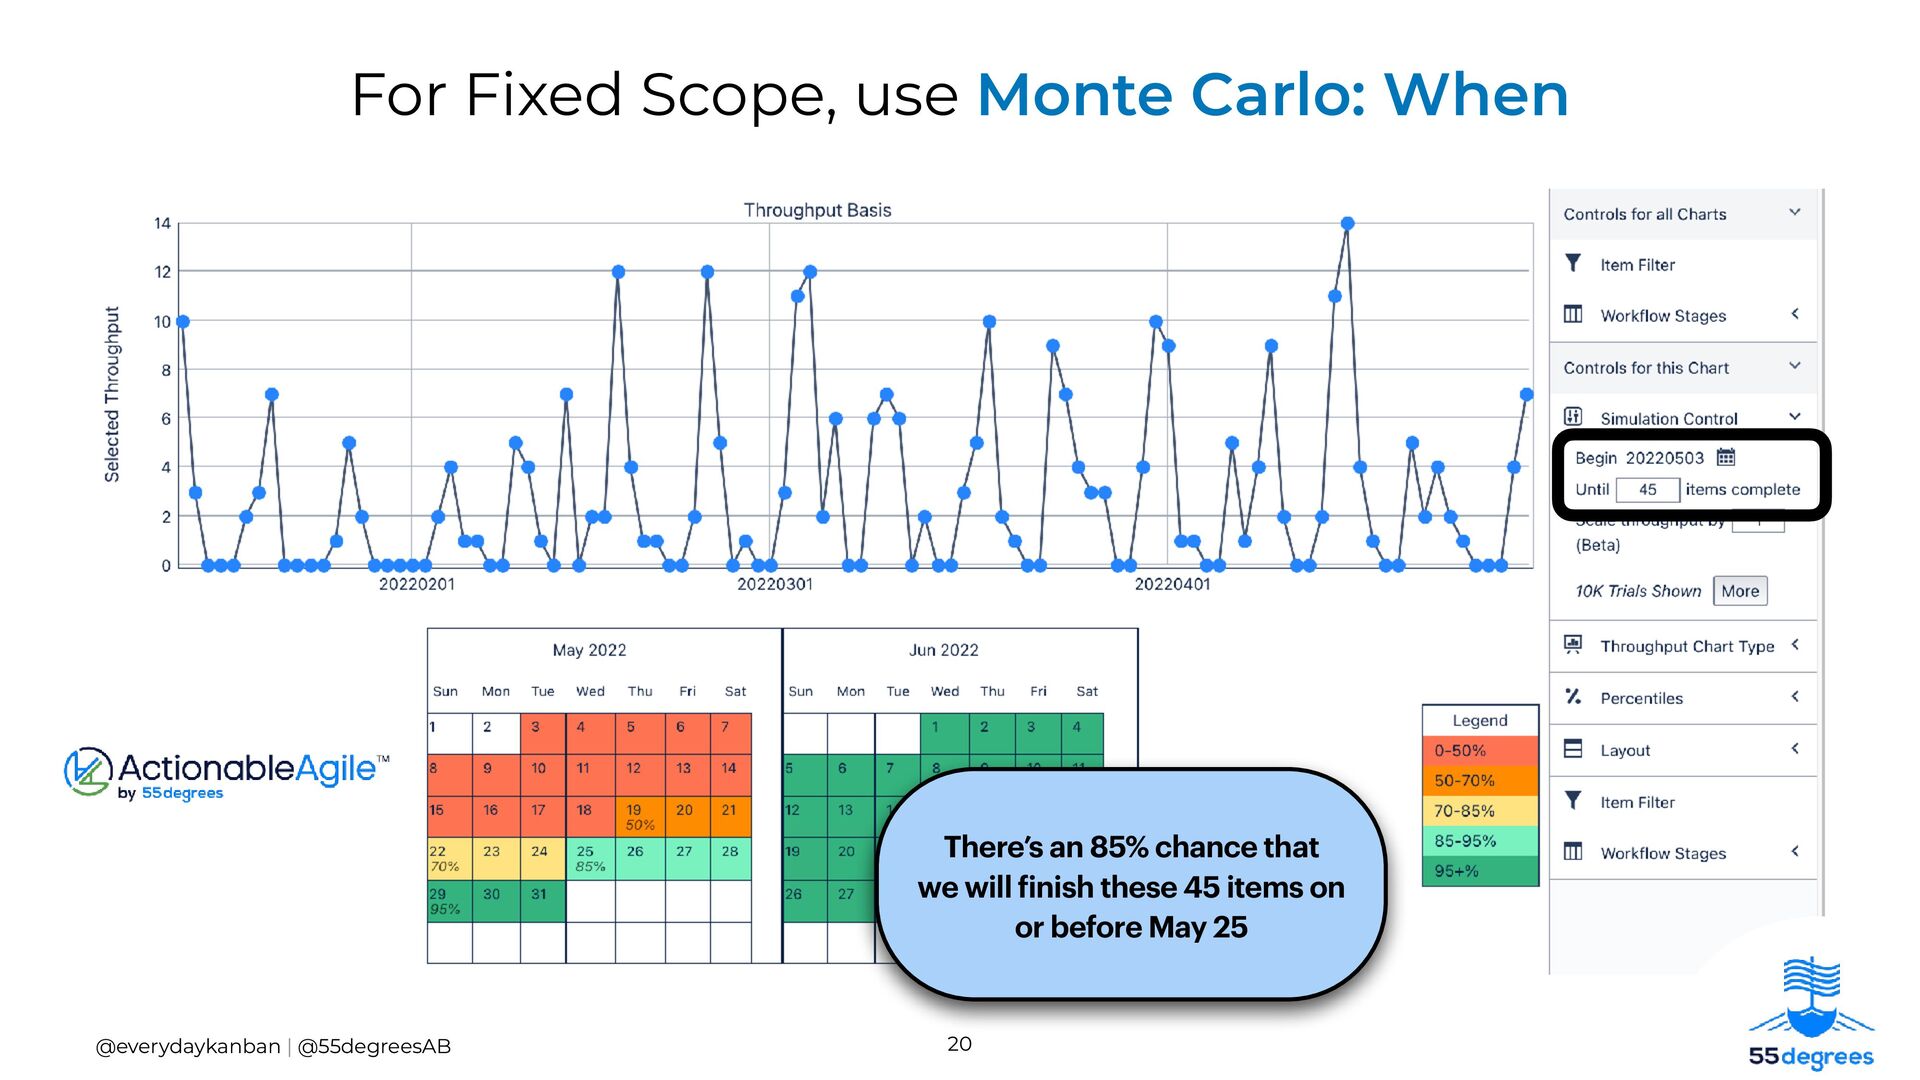
IT WILL BE DONE ON OR BEFORE X DATE •Two components: ‣ Range of outcomes ‣ Probability you’ll fall into that range •Appropriate whenever uncertainty is present
too many outliers Just the right balance? Ask: What is the fallout if we fall outside of the probability? by understanding your risk tolerance Choose a probability
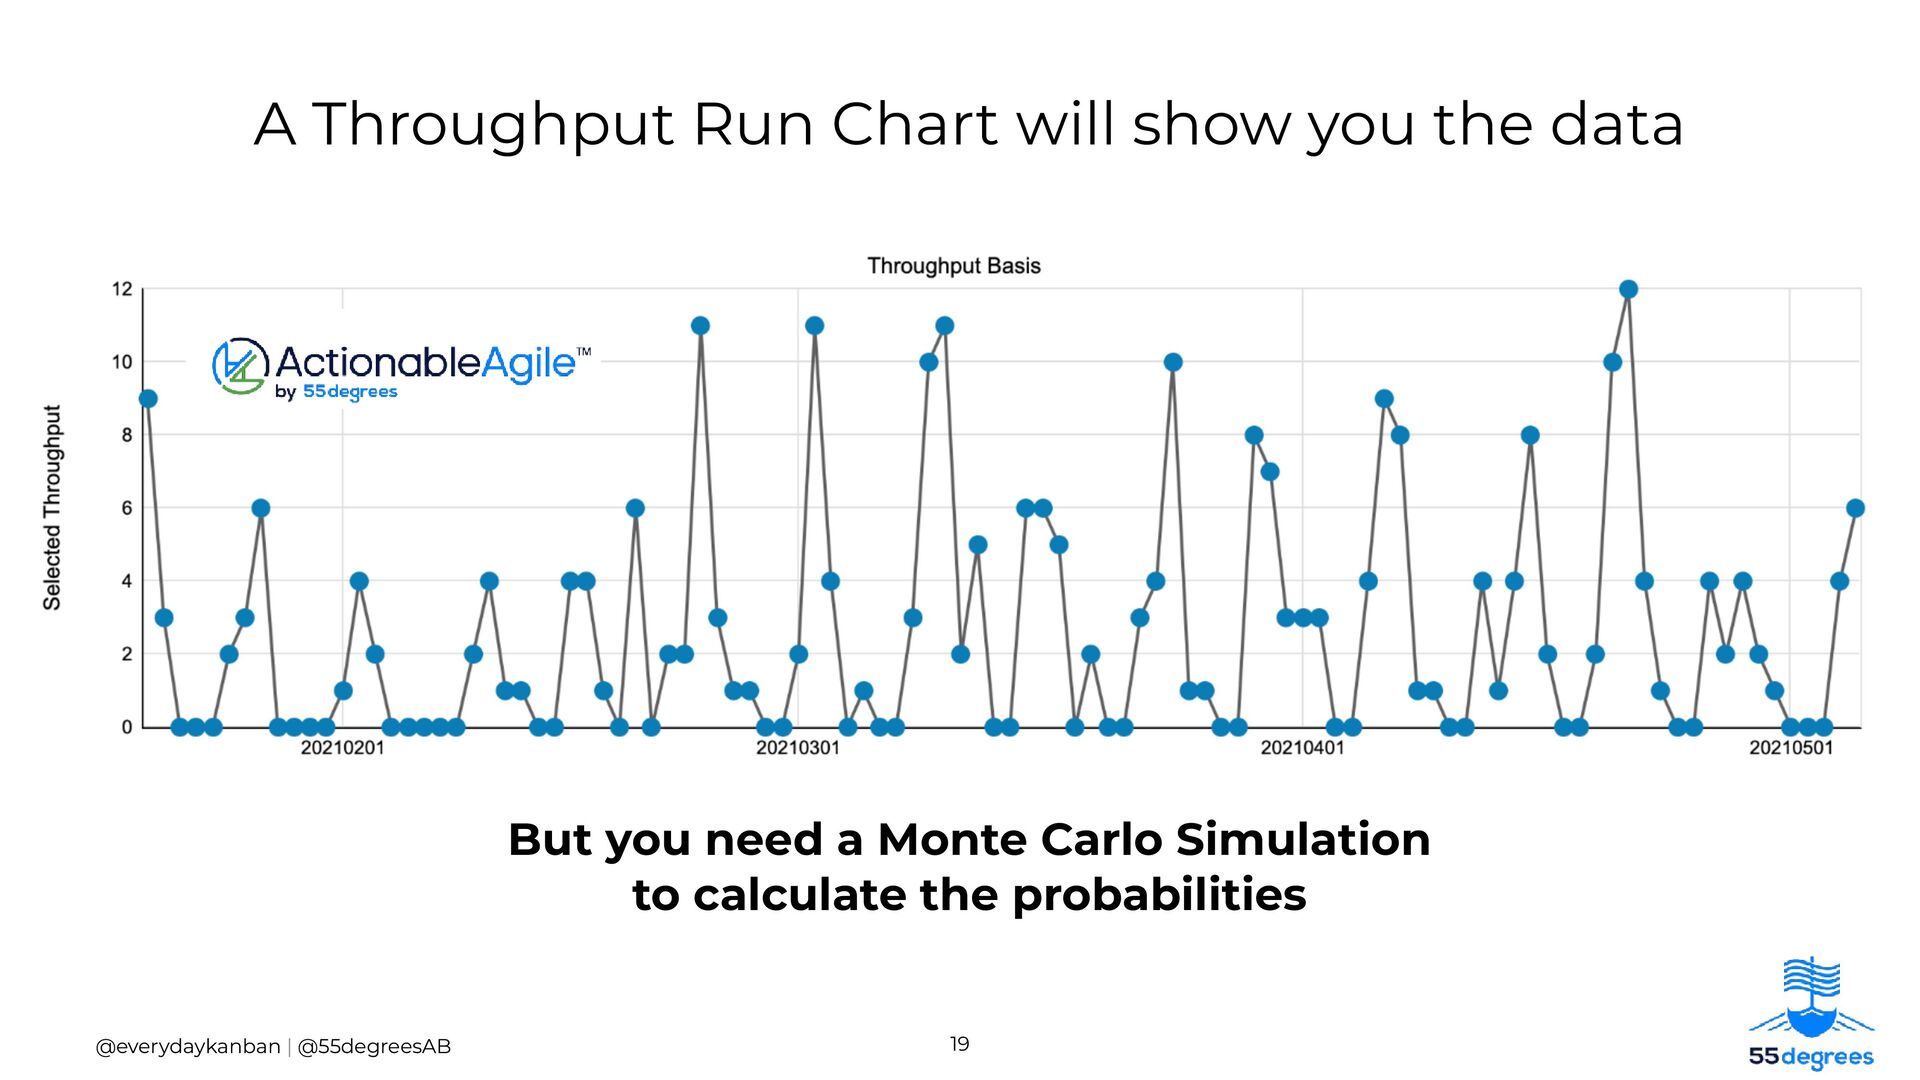
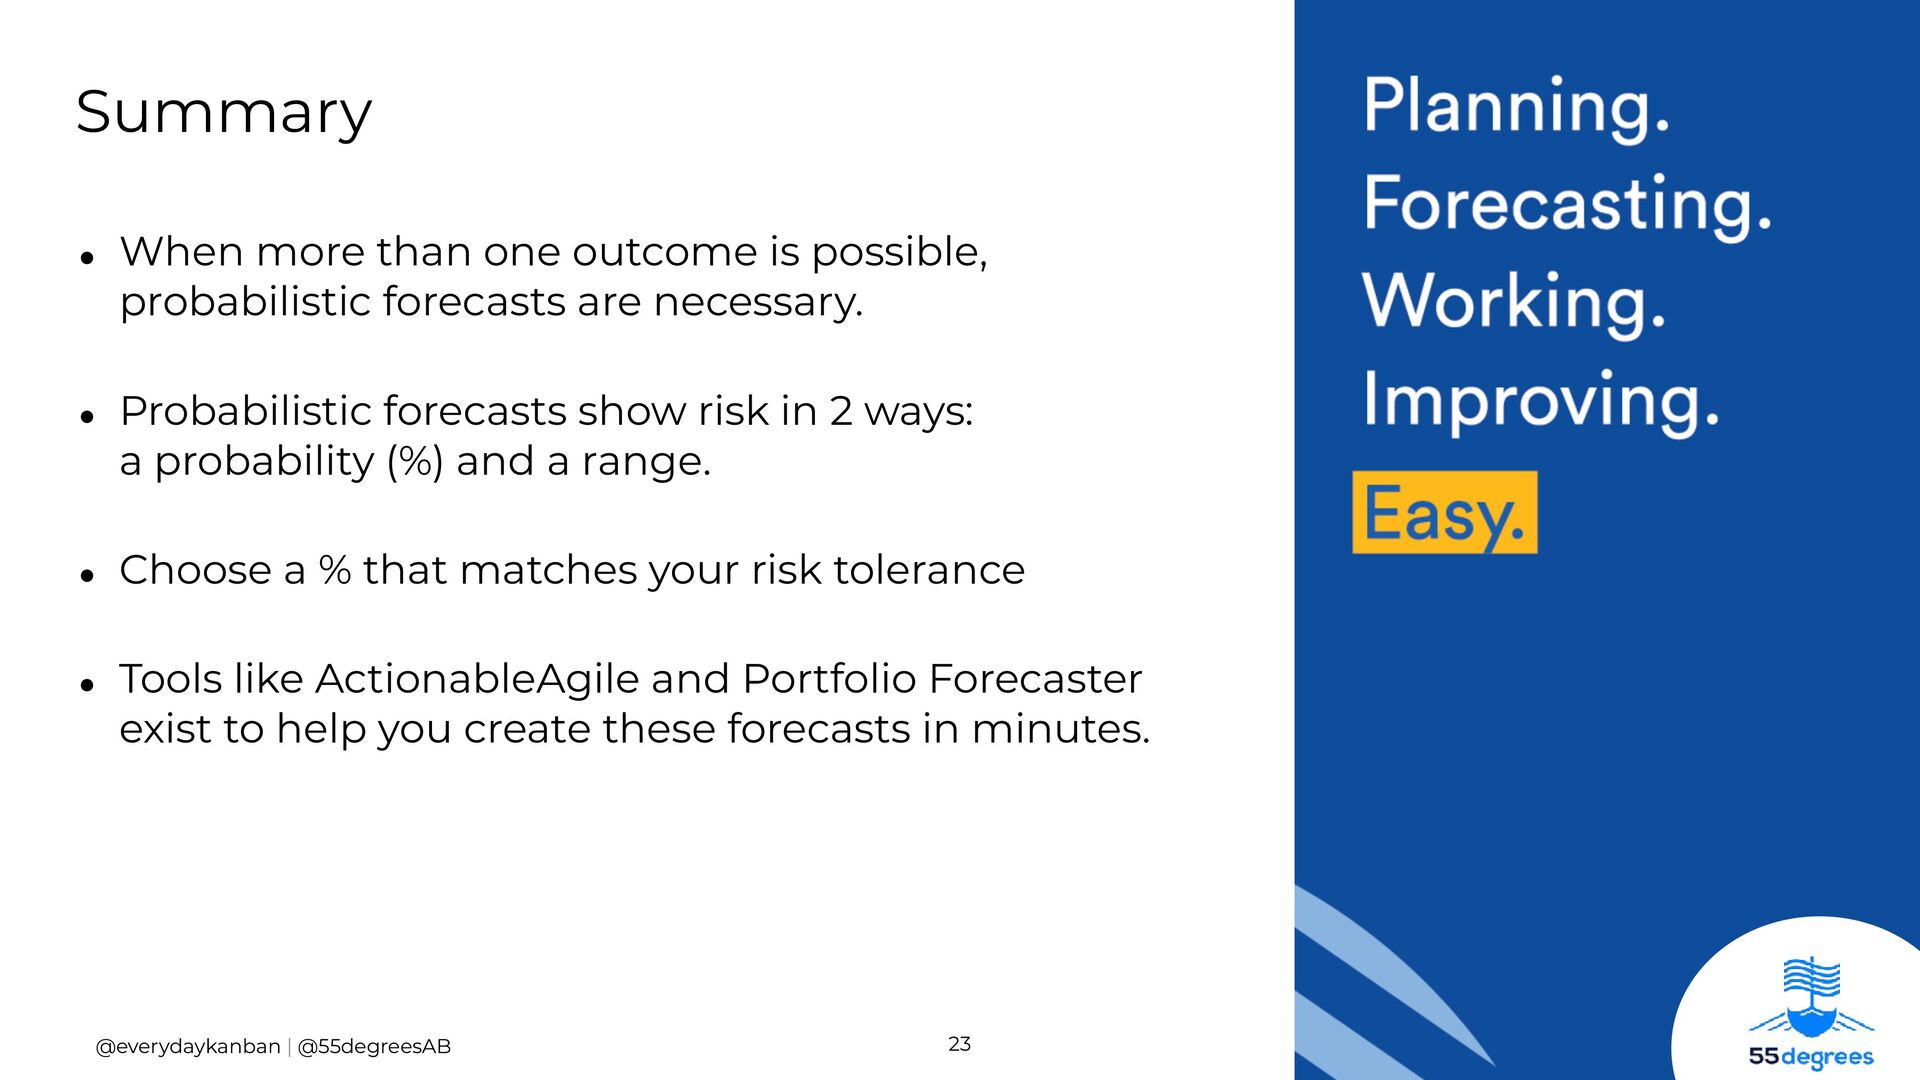
is possible, probabilistic forecasts are necessary. • Probabilistic forecasts show risk in 2 ways: a probability (%) and a range. • Choose a % that matches your risk tolerance • Tools like ActionableAgile and Portfolio Forecaster exist to help you create these forecasts in minutes. Summary