Upgrade to Pro — share decks privately, control downloads, hide ads and more …

Transforming project forecasts using probabilities

Transforming project forecasts using probabilities

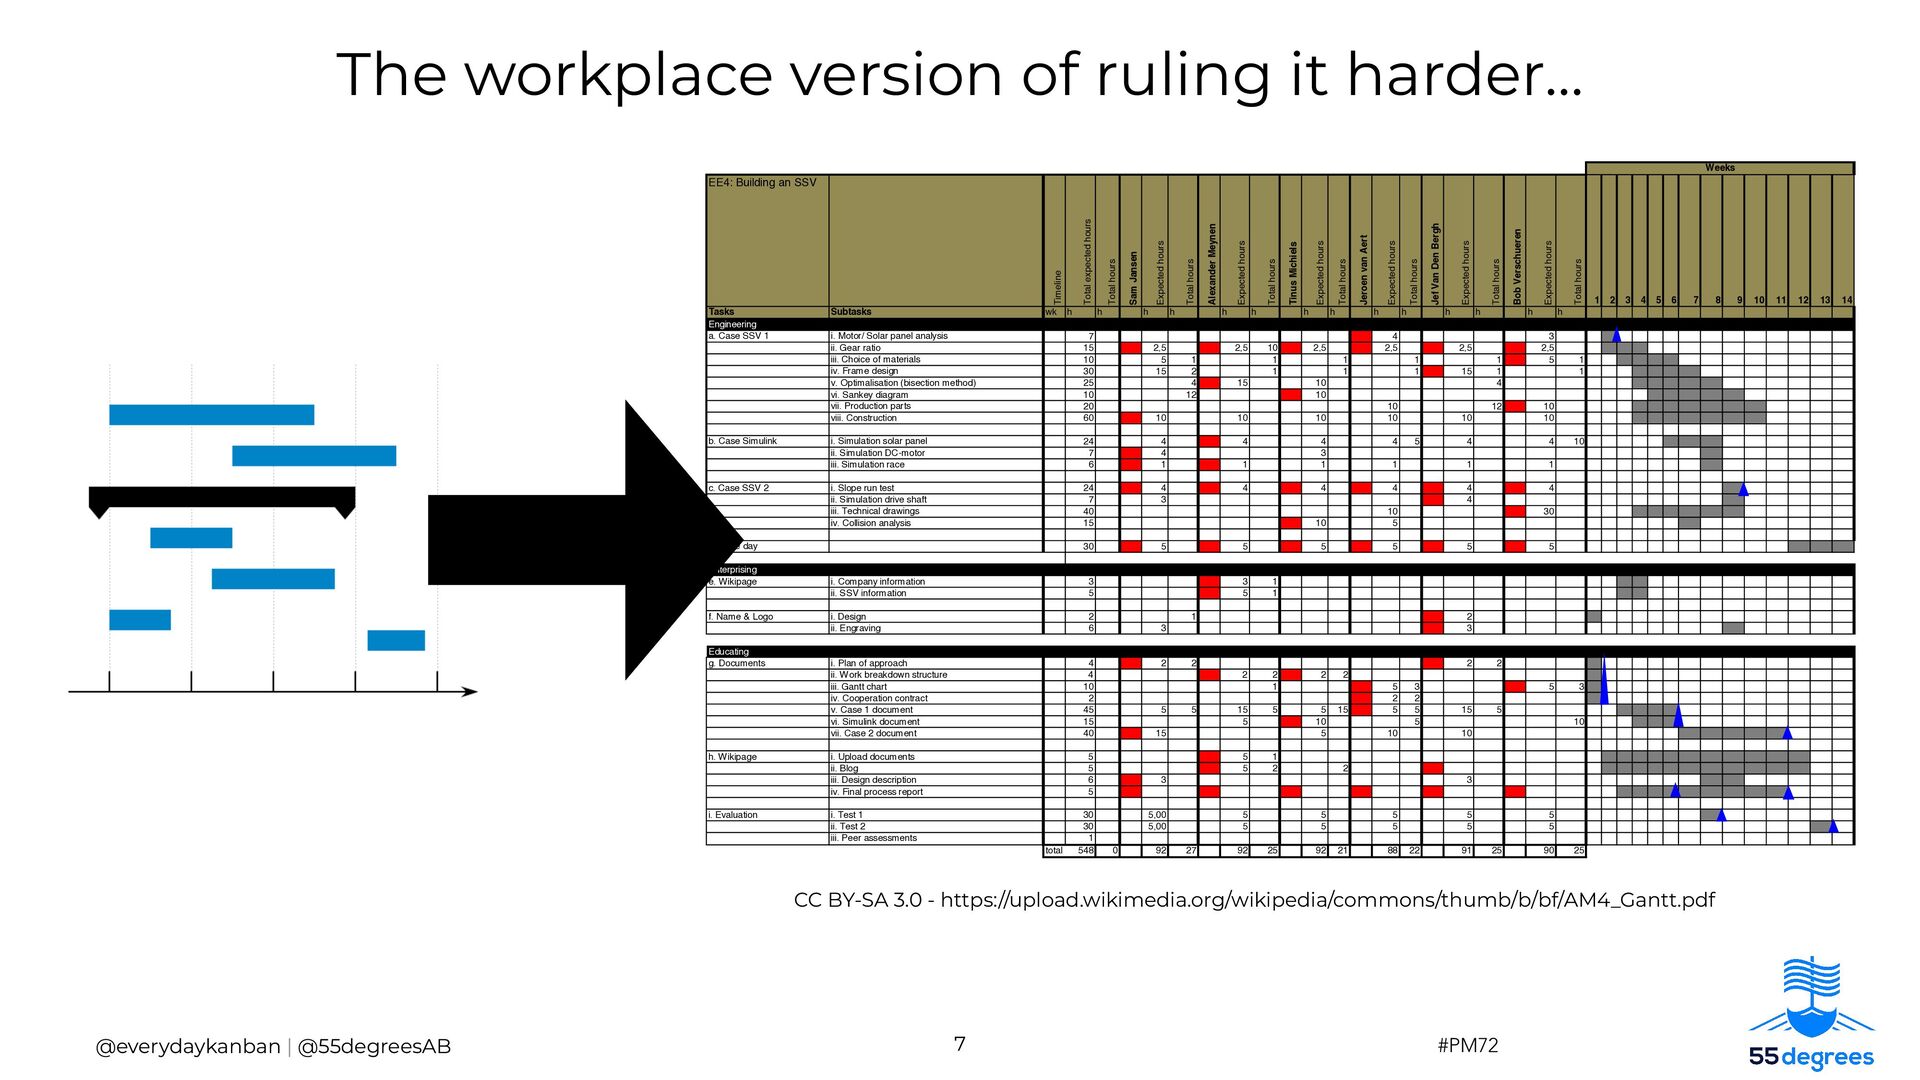
Plagued by watermelon projects? You know the kind... the ones that are green, green, green, until the very end and then they are red. Well, you're not the only one. The good news is that changing the way you forecast can provide a higher level of clarity on just how likely it is that a project will finish by a given date.

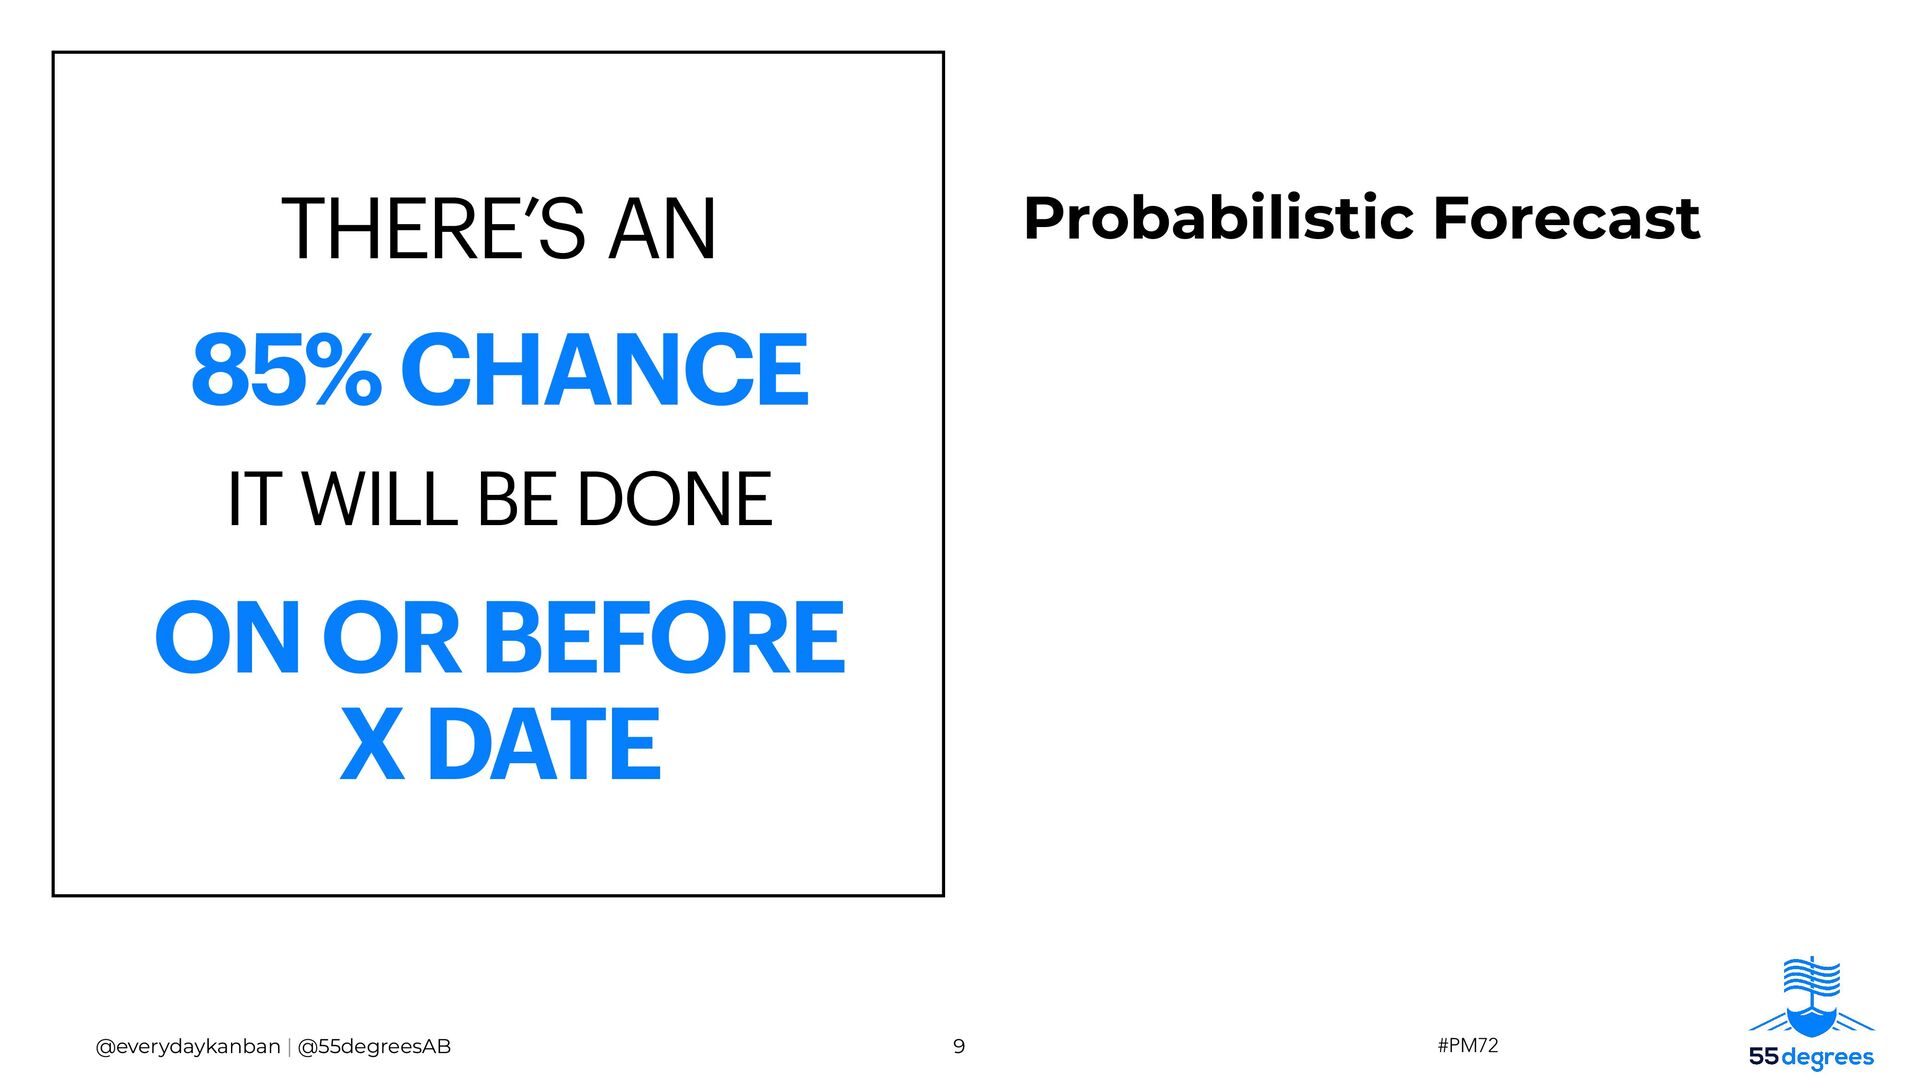
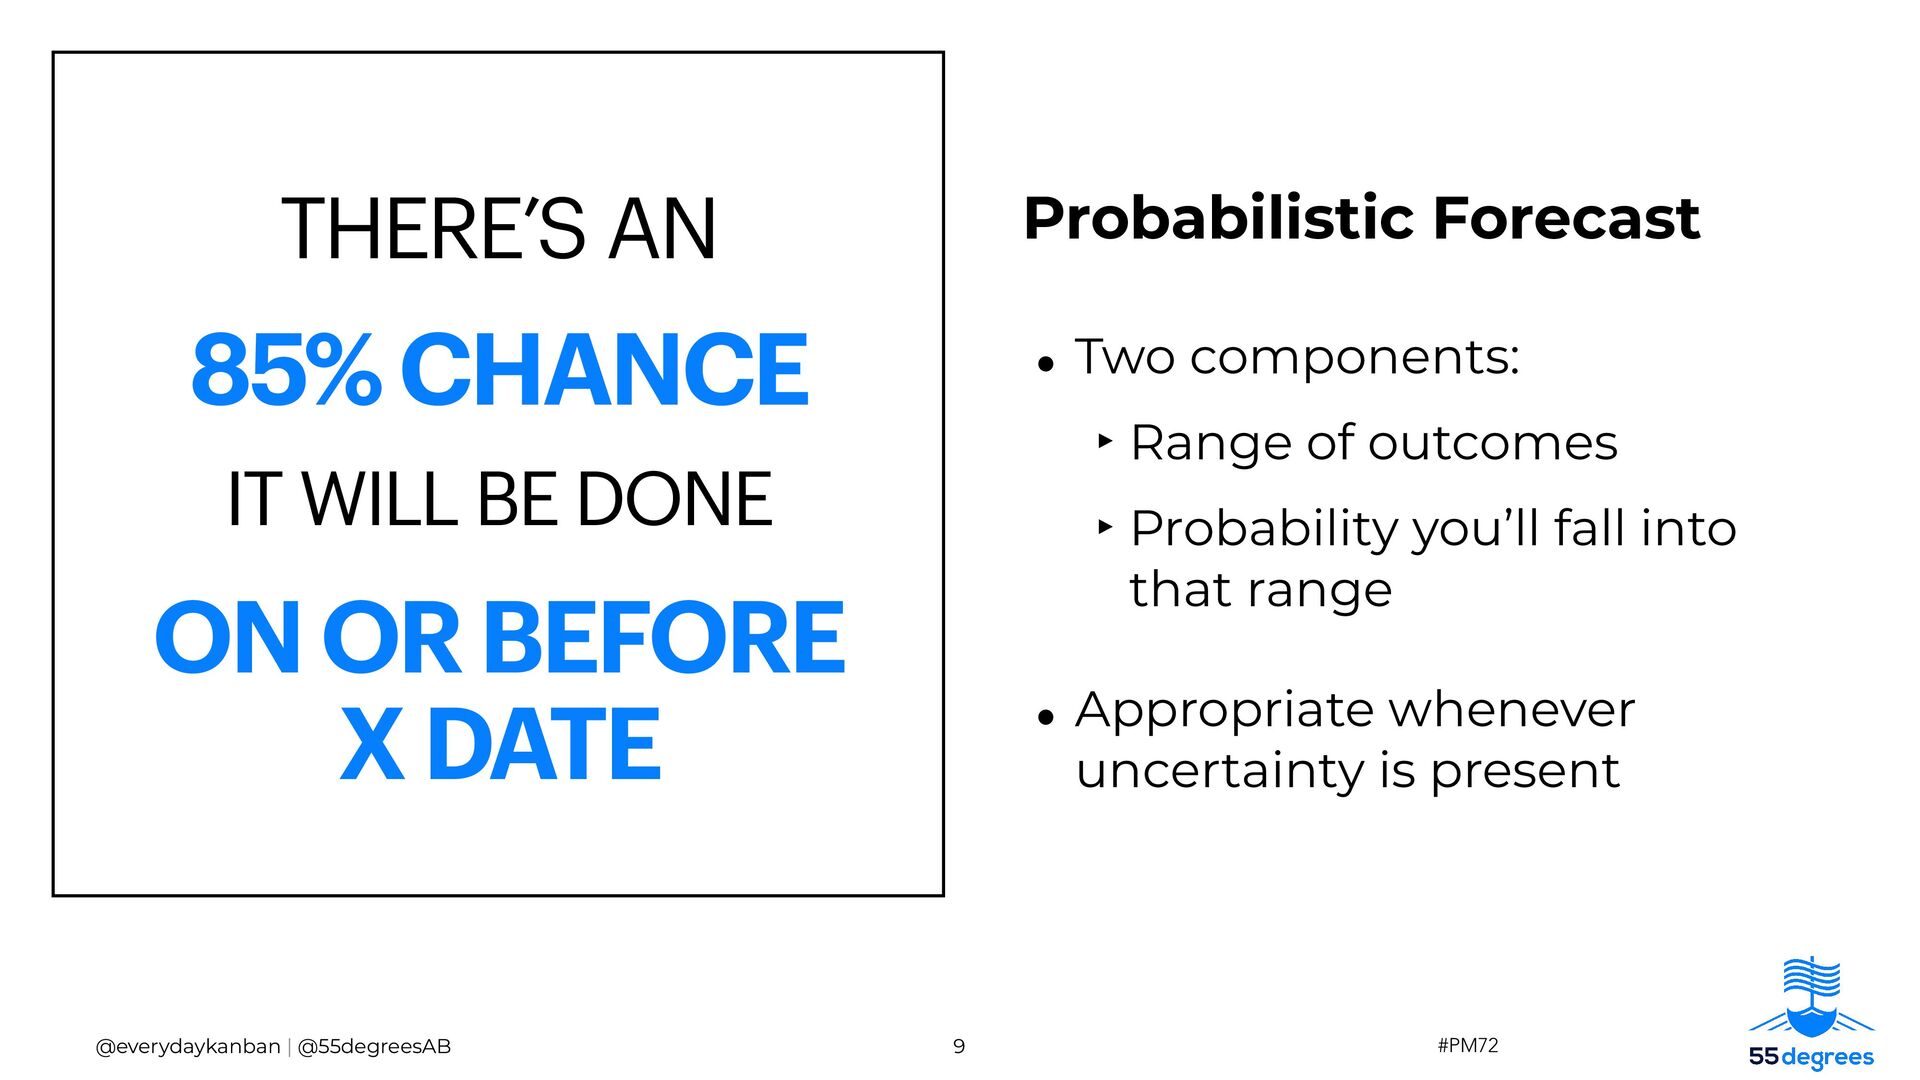
By attending this talk you'll learn 1) why probabilities are a necessity when uncertainty is present, 2) how to use your team's data to create probabilistic forecasts, and 3) what to keep in mind to create the most accurate forecasts.

Julia Wester

June 08, 2022
Tweet

More Decks by Julia Wester

Other Decks in Business

Transcript

  1. @everydaykanban | @55degreesAB Follow us on social media /company/55degrees @55degreesAB

    @55degreesAB /55degreesAB /c/ActionableAgileAnalytics Apps that make it easier to get work done 🎉 From re fi ning work, to bringing external data into Jira, to improving work fl ows and creating reliable forecasts, 55 Degrees has apps to make your work less stressful.
  2. #PM72 3 @everydaykanban | @55degreesAB Benjamin Franklin November 1789 “…IN

    THIS WORLD, NOTHING IS CERTAIN EXCEPT DEATH AND TAXES.”
  3. Often forecasts are interpreted as certainties because we don’t tell

    them otherwise 4 #PM72 @everydaykanban | @55degreesAB CC BY-SA 3.0, https://en.wikipedia.org/w/index.php?curid=3422341
  4. 5 #PM72 @everydaykanban | @55degreesAB The 3 Gaps Outcomes Plans

    Actions ! Knowledge Gap Difference between what we would like to know and what we actually know
  5. 5 #PM72 @everydaykanban | @55degreesAB The 3 Gaps Outcomes Plans

    Actions ! Knowledge Gap Difference between what we would like to know and what we actually know ! Alignment Gap Difference between what we want people to do and what they actually do
  6. 5 #PM72 @everydaykanban | @55degreesAB The 3 Gaps Outcomes Plans

    Actions ! Effects Gap Difference between what we expect our actions to achieve and what they actually achieve ! Knowledge Gap Difference between what we would like to know and what we actually know ! Alignment Gap Difference between what we want people to do and what they actually do
  7. 7 #PM72 @everydaykanban | @55degreesAB EE4: Building an SSV Timeline

    Total expected hours Total hours Sam Jansen Expected hours Total hours Alexander Meynen Expected hours Total hours Tinus Michiels Expected hours Total hours Jeroen van Aert Expected hours Total hours Jef Van Den Bergh Expected hours Total hours Bob Verschueren Expected hours Total hours 1 2 3 4 5 6 7 8 9 10 11 12 13 14 Tasks Subtasks wk h h h h h h h h h h h h h h Engineering a. Case SSV 1 i. Motor/ Solar panel analysis 7 4 3 ii. Gear ratio 15 2,5 2,5 10 2,5 2,5 2,5 2,5 iii. Choice of materials 10 5 1 1 1 1 1 5 1 iv. Frame design 30 15 2 1 1 1 15 1 1 v. Optimalisation (bisection method) 25 4 15 10 4 vi. Sankey diagram 10 12 10 vii. Production parts 20 10 12 10 viii. Construction 60 10 10 10 10 10 10 b. Case Simulink i. Simulation solar panel 24 4 4 4 4 5 4 4 10 ii. Simulation DC-motor 7 4 3 iii. Simulation race 6 1 1 1 1 1 1 c. Case SSV 2 i. Slope run test 24 4 4 4 4 4 4 ii. Simulation drive shaft 7 3 4 iii. Technical drawings 40 10 30 iv. Collision analysis 15 10 5 d. Race day 30 5 5 5 5 5 5 Enterprising e. Wikipage i. Company information 3 3 1 ii. SSV information 5 5 1 f. Name & Logo i. Design 2 1 2 ii. Engraving 6 3 3 g. Documents i. Plan of approach 4 2 2 2 2 ii. Work breakdown structure 4 2 2 2 2 iii. Gantt chart 10 1 5 3 5 3 iv. Cooperation contract 2 2 2 v. Case 1 document 45 5 5 15 5 5 15 5 5 15 5 vi. Simulink document 15 5 10 5 10 vii. Case 2 document 40 15 5 10 10 h. Wikipage i. Upload documents 5 5 1 ii. Blog 5 5 2 2 iii. Design description 6 3 3 iv. Final process report 5 i. Evaluation i. Test 1 30 5,00 5 5 5 5 5 ii. Test 2 30 5,00 5 5 5 5 5 iii. Peer assessments 1 total 548 0 92 27 92 25 92 21 88 22 91 25 90 25 Legende milestone responsibillity Gantt chart 1 Educating Weeks The workplace version of ruling it harder… CC BY-SA 3.0 - https://upload.wikimedia.org/wikipedia/commons/thumb/b/bf/AM4_Gantt.pdf
  8. Deterministic Forecast 8 #PM72 @everydaykanban | @55degreesAB IT WILL BE

    DONE ON X DATE •Communicates a single possible outcome
  9. Deterministic Forecast 8 #PM72 @everydaykanban | @55degreesAB IT WILL BE

    DONE ON X DATE •Communicates a single possible outcome •Provides no probability of that outcome
  10. Deterministic Forecast 8 #PM72 @everydaykanban | @55degreesAB IT WILL BE

    DONE ON X DATE •Communicates a single possible outcome •Provides no probability of that outcome •Appropriate only when certainty is assured
  11. Probabilistic Forecast 9 #PM72 @everydaykanban | @55degreesAB THERE’S AN 85%

    CHANCE IT WILL BE DONE ON OR BEFORE 
 X DATE •Two components: ‣ Range of outcomes ‣ Probability you’ll fall into that range
  12. Probabilistic Forecast 9 #PM72 @everydaykanban | @55degreesAB THERE’S AN 85%

    CHANCE IT WILL BE DONE ON OR BEFORE 
 X DATE •Two components: ‣ Range of outcomes ‣ Probability you’ll fall into that range •Appropriate whenever uncertainty is present
  13. 10 Let’s create these probabilistic forecasts… #PM72 @everydaykanban | @55degreesAB

    Single Item Forecasts Multiple Item Forecasts 📆 Fixed Date 📑 Fixed Scope 2 Types
  14. For each, we can use the same simple data to

    calculate the probabilities 11 #PM72 @everydaykanban | @55degreesAB
  15. Single Item Forecasts 12 #PM72 @everydaykanban | @55degreesAB How long

    will it take? Finish Start Cycle Time: The total elapsed time it takes a work item to travel from start to fi nish
  16. #PM72 13 @everydaykanban | @55degreesAB Cycle Time: The total elapsed

    time it takes a work item to travel from start to fi nish Single Item Forecasts (Finish date - start date) + 1
  17. #PM72 13 @everydaykanban | @55degreesAB Finish Start Cycle Time: The

    total elapsed time it takes a work item to travel from start to fi nish Single Item Forecasts (Finish date - start date) + 1
  18. Use a Cycle Time Scatterplot to calculate probabilities 14 #PM72

    @everydaykanban | @55degreesAB 50% of work took 7 days or less
  19. 85% of work took 16 days or less Use a

    Cycle Time Scatterplot to calculate probabilities 14 #PM72 @everydaykanban | @55degreesAB 50% of work took 7 days or less
  20. 15 #PM72 @everydaykanban | @55degreesAB Wrong as much as right…

    by understanding your risk tolerance Choose a probability
  21. 15 #PM72 @everydaykanban | @55degreesAB Wrong as much as right…

    Ask: What is the fallout if we fall outside of the probability? by understanding your risk tolerance Choose a probability
  22. 15 #PM72 @everydaykanban | @55degreesAB Wrong as much as right…

    Contains too many outliers Ask: What is the fallout if we fall outside of the probability? by understanding your risk tolerance Choose a probability
  23. 15 #PM72 @everydaykanban | @55degreesAB Wrong as much as right…

    Contains too many outliers Just the right balance? Ask: What is the fallout if we fall outside of the probability? by understanding your risk tolerance Choose a probability
  24. 16 #PM72 @everydaykanban | @55degreesAB 85% of the time we

    finish a 
 work item in 16 days or less 
 (from the day it starts) probabilistically Deliver your forecast
  25. Multiple Item Forecasts 18 #PM72 @everydaykanban | @55degreesAB Finish Start

    Throughput: The total count of items that pass the de fi ned fi nish point in a given unit of time When will they all be done?
  26. 19 #PM72 @everydaykanban | @55degreesAB A Throughput Run Chart will

    show you the data But you need a Monte Carlo Simulation to calculate the probabilities
  27. 20 #PM72 @everydaykanban | @55degreesAB For Fixed Scope, use Monte

    Carlo: When There’s an 85% chance that we will f inish these 45 items on or before May 25
  28. 21 #PM72 @everydaykanban | @55degreesAB For Fixed Date, use Monte

    Carlo: How Many There’s an 85% chance that we can f inish 67 or more items by then
  29. 23 @everydaykanban | @55degreesAB • When more than one outcome

    is possible, probabilistic forecasts are necessary. Summary
  30. 23 @everydaykanban | @55degreesAB • When more than one outcome

    is possible, probabilistic forecasts are necessary. • Probabilistic forecasts show risk in 2 ways: 
 a probability (%) and a range. Summary
  31. 23 @everydaykanban | @55degreesAB • When more than one outcome

    is possible, probabilistic forecasts are necessary. • Probabilistic forecasts show risk in 2 ways: 
 a probability (%) and a range. • Choose a % that matches your risk tolerance Summary
  32. 23 @everydaykanban | @55degreesAB • When more than one outcome

    is possible, probabilistic forecasts are necessary. • Probabilistic forecasts show risk in 2 ways: 
 a probability (%) and a range. • Choose a % that matches your risk tolerance • Tools like ActionableAgile and Portfolio Forecaster exist to help you create these forecasts in minutes. Summary
  33. 24 #PM72 @everydaykanban | @55degreesAB Join us at the after

    party for demos of ActionableAgile, Portfolio Forecaster, and more Tuesday, June 14 19-21 CEST Register on the PM72 website!
  34. @everydaykanban | @55degreesAB 🍦 Follow us on social media /company/55degrees

    @55degreesAB @55degreesAB /55degreesAB /c/ActionableAgileAnalytics Get your free trial of any app shown below via the Atlassian Marketplace!