Upgrade to Pro — share decks privately, control downloads, hide ads and more …

Exploratory: Analytics : Introduction to Principal Component Analysis (PCA)

Kan Nishida
September 11, 2019

Exploratory: Analytics : Introduction to Principal Component Analysis (PCA)

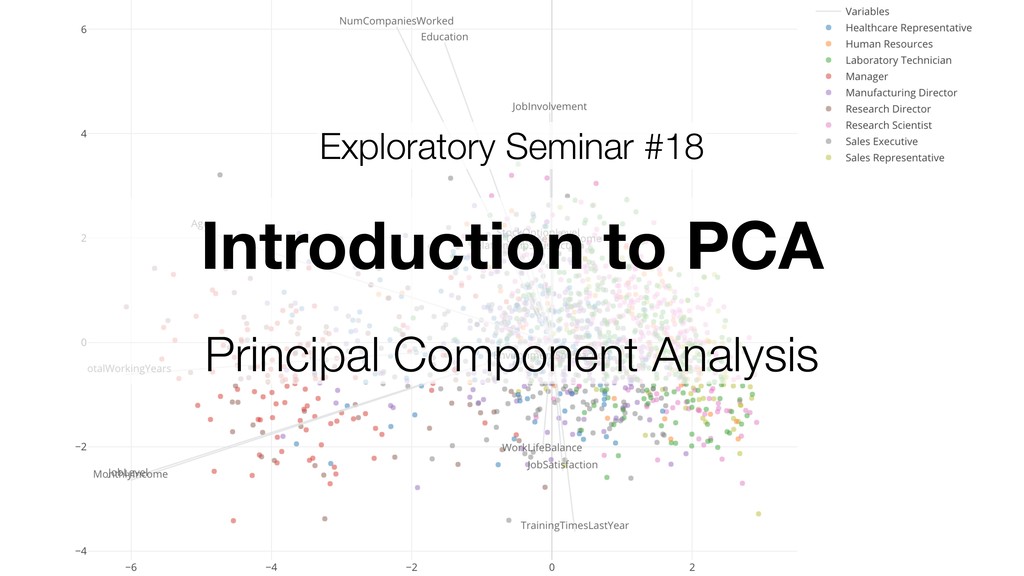
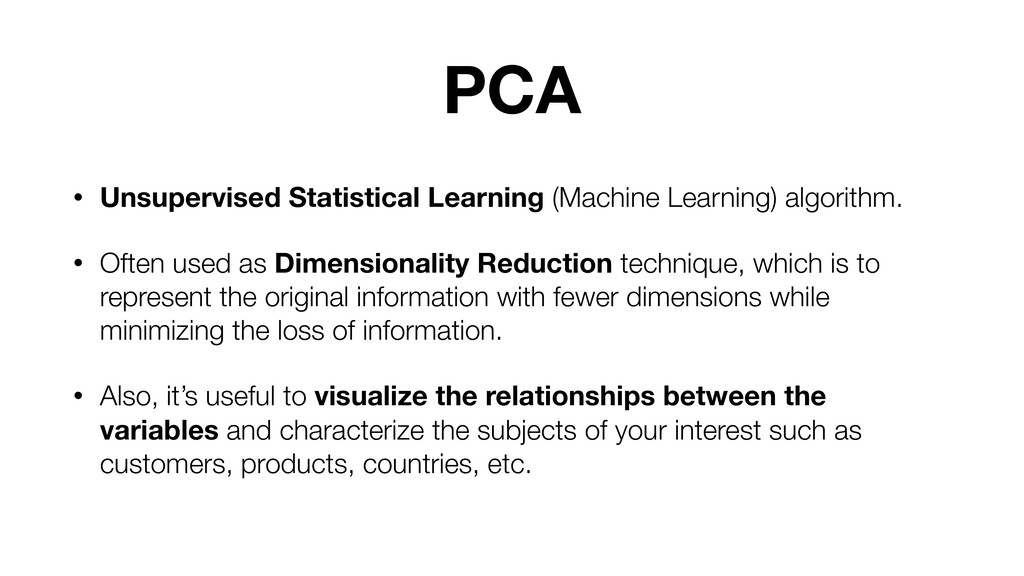
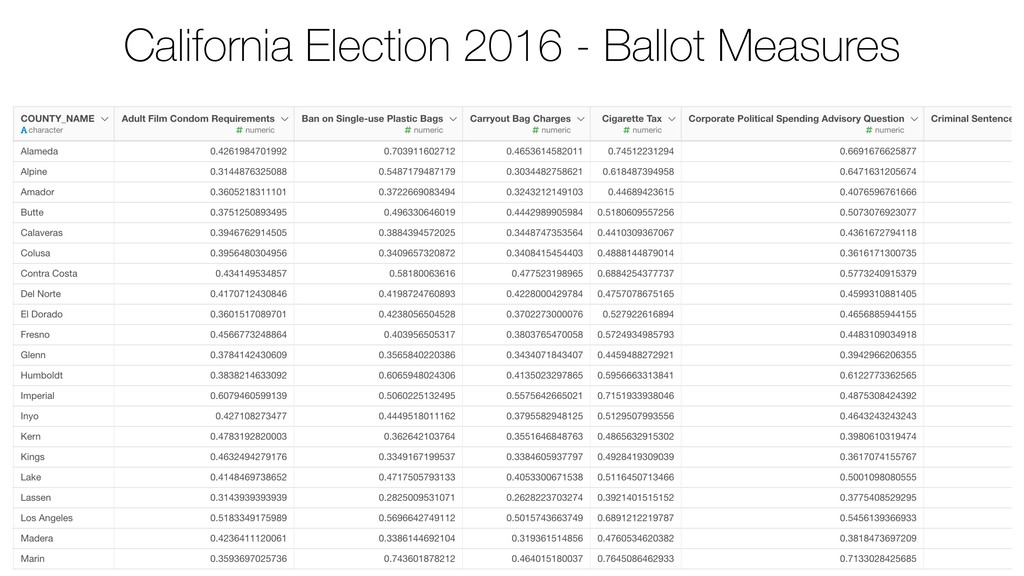
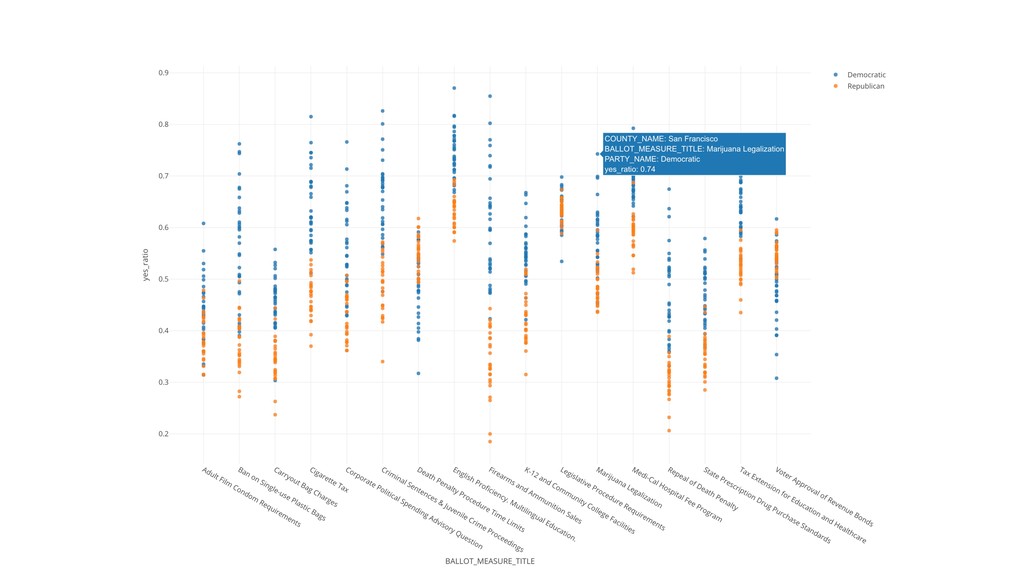
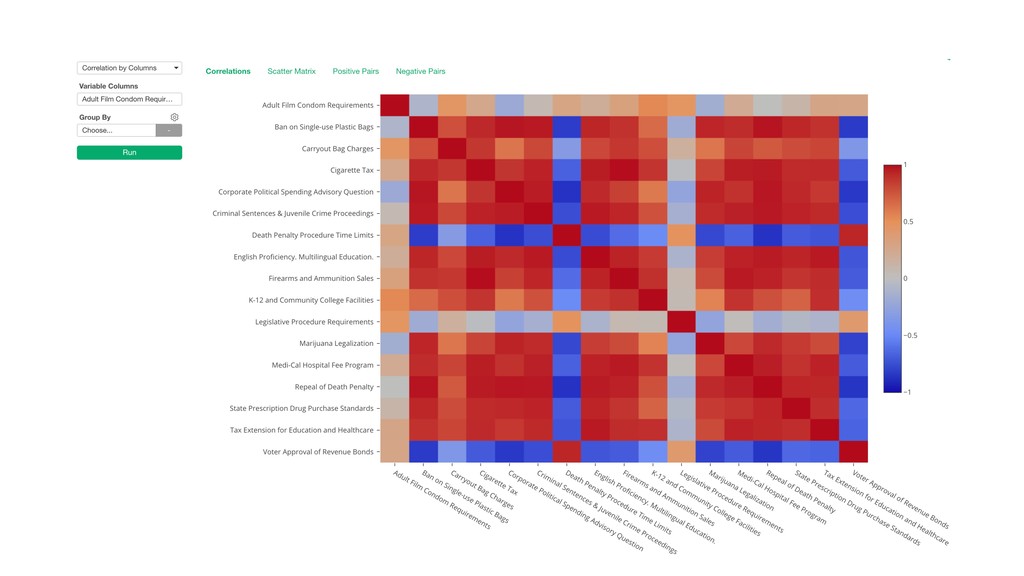
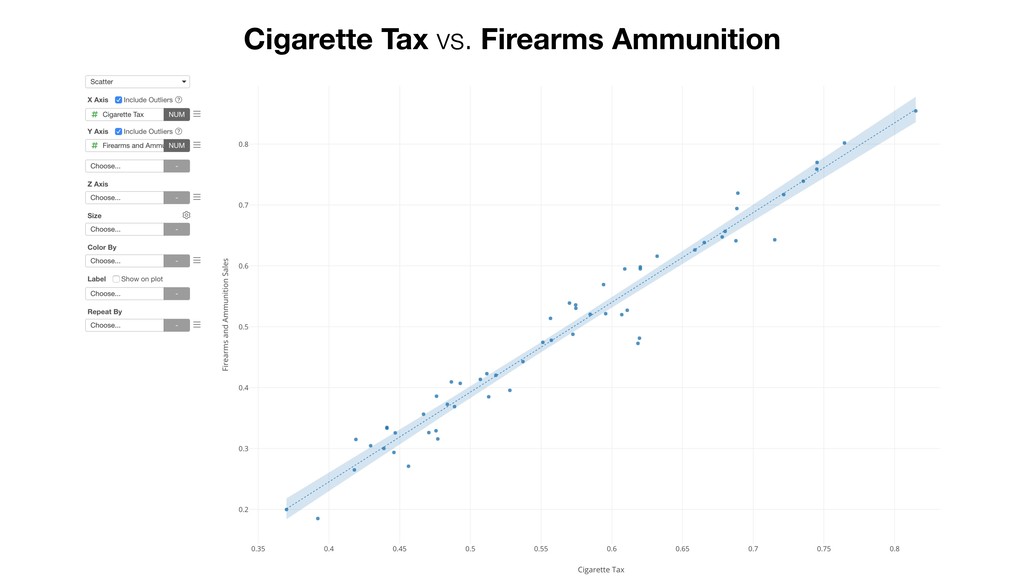
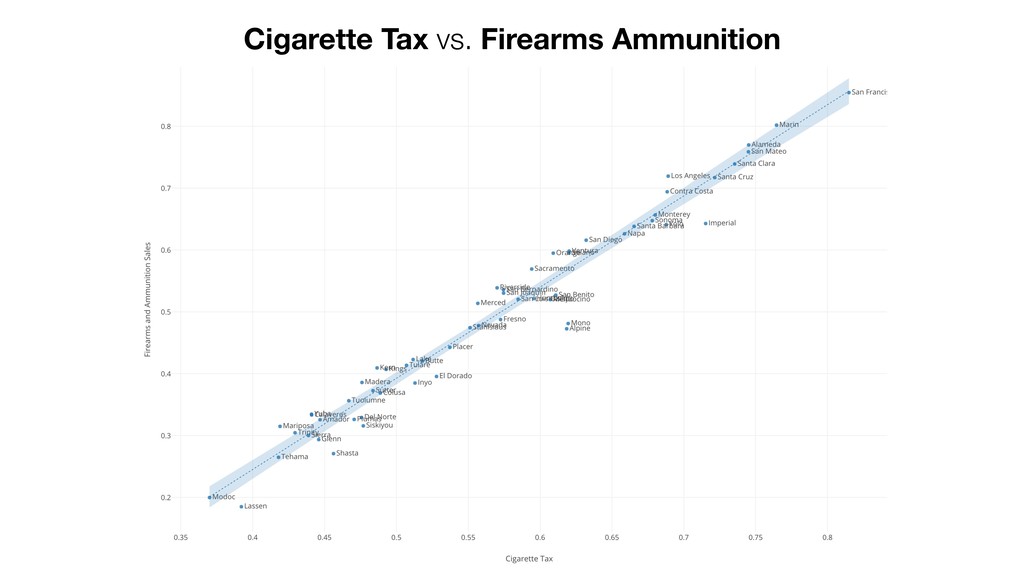
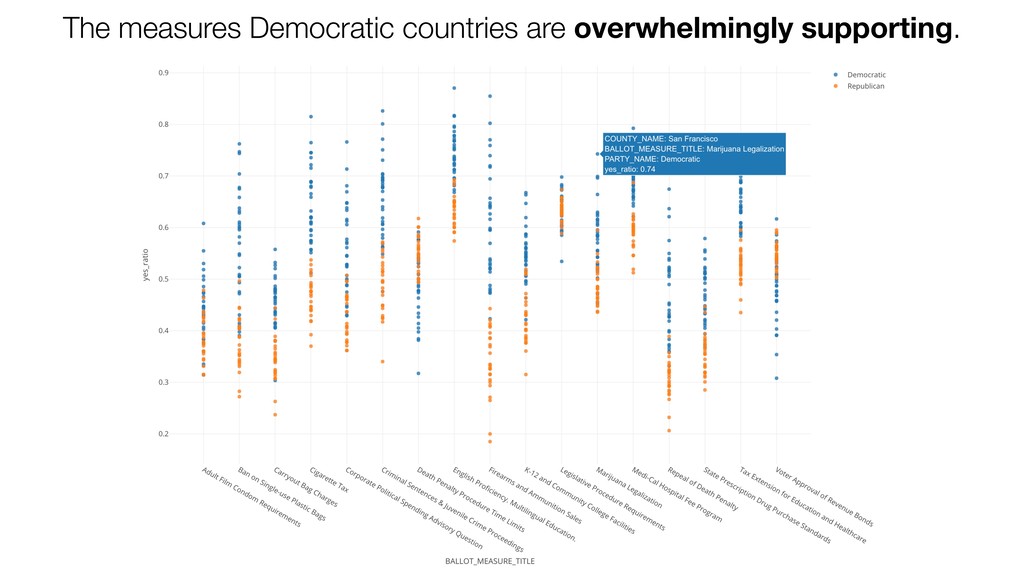
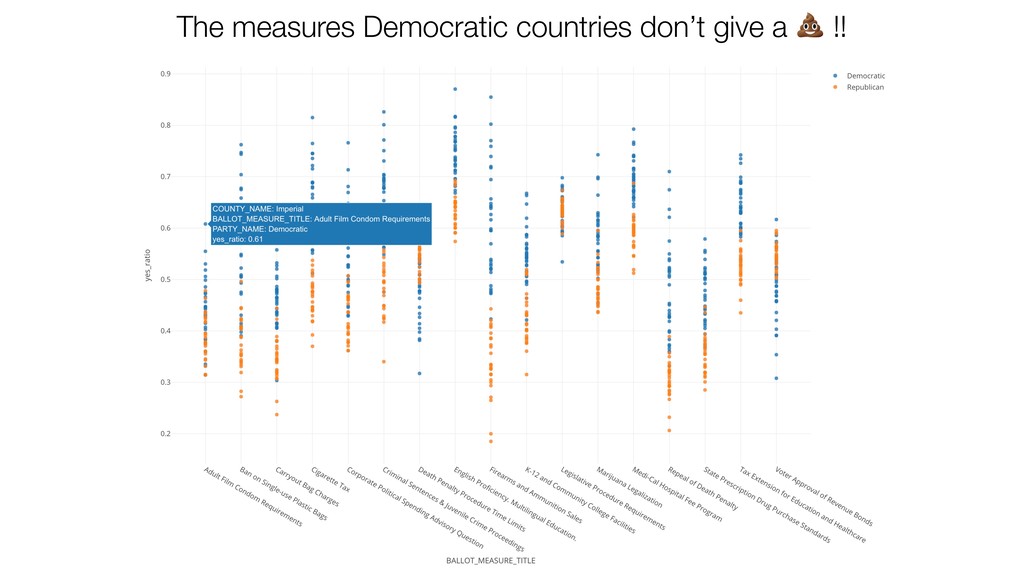
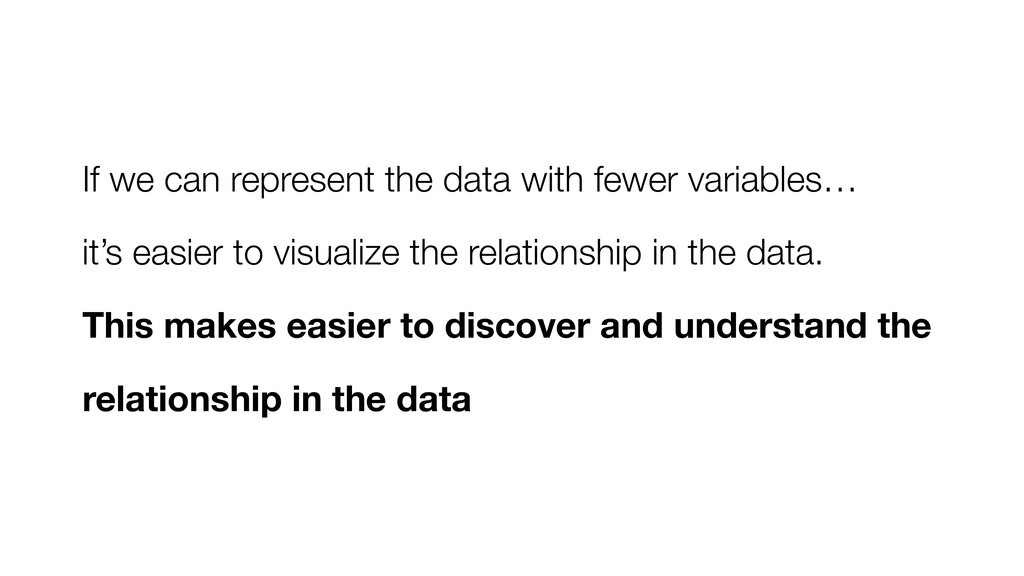
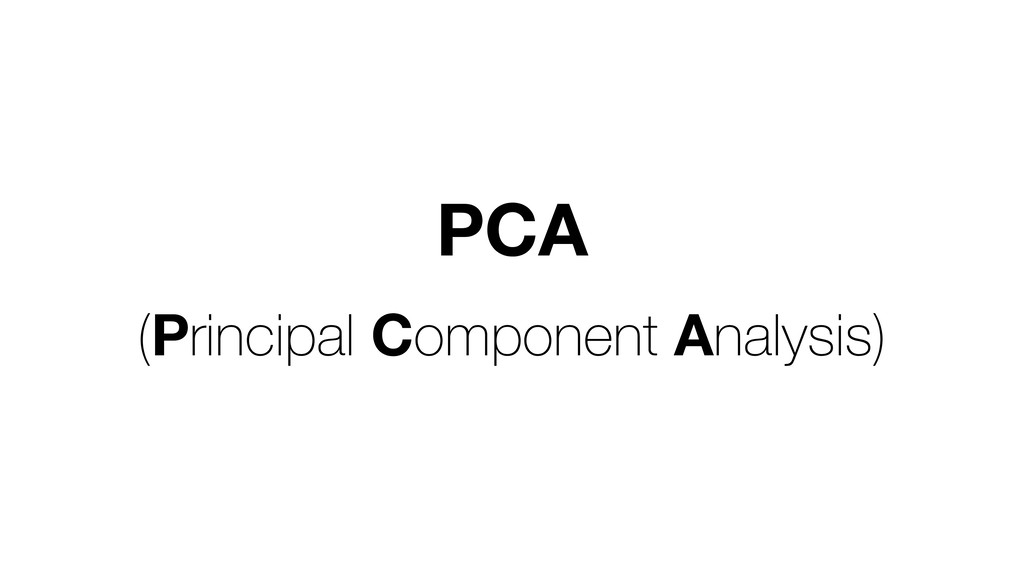
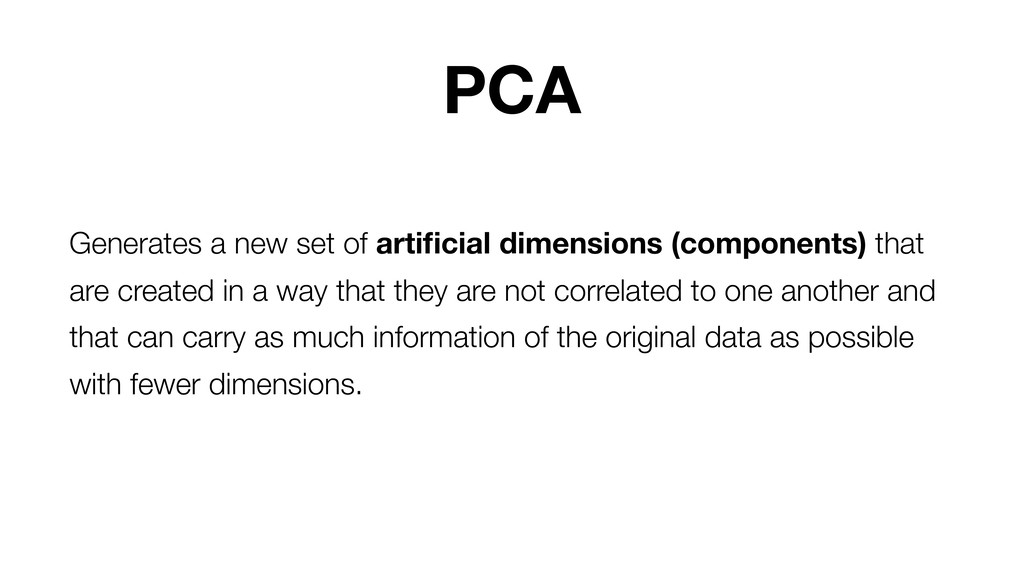
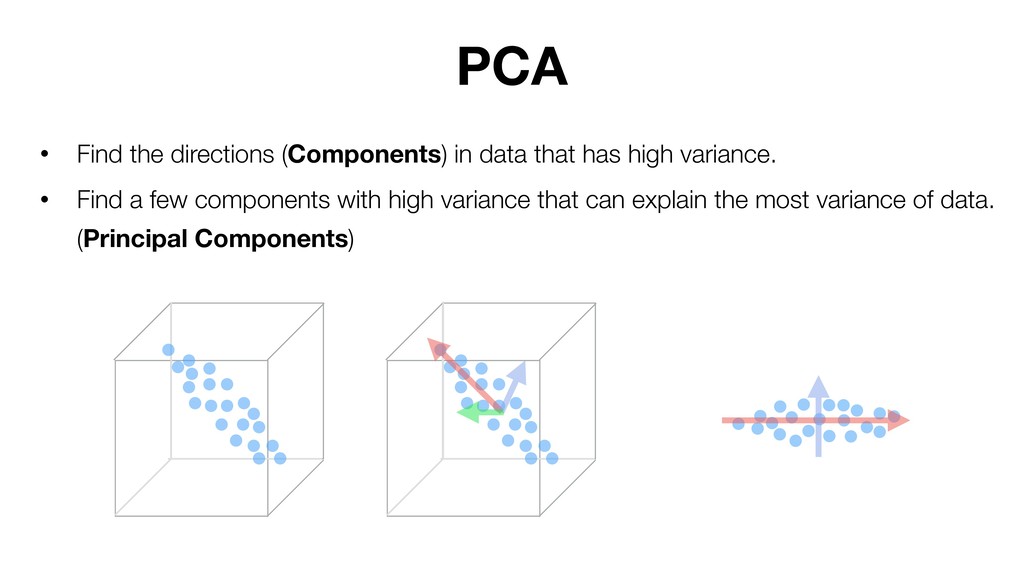
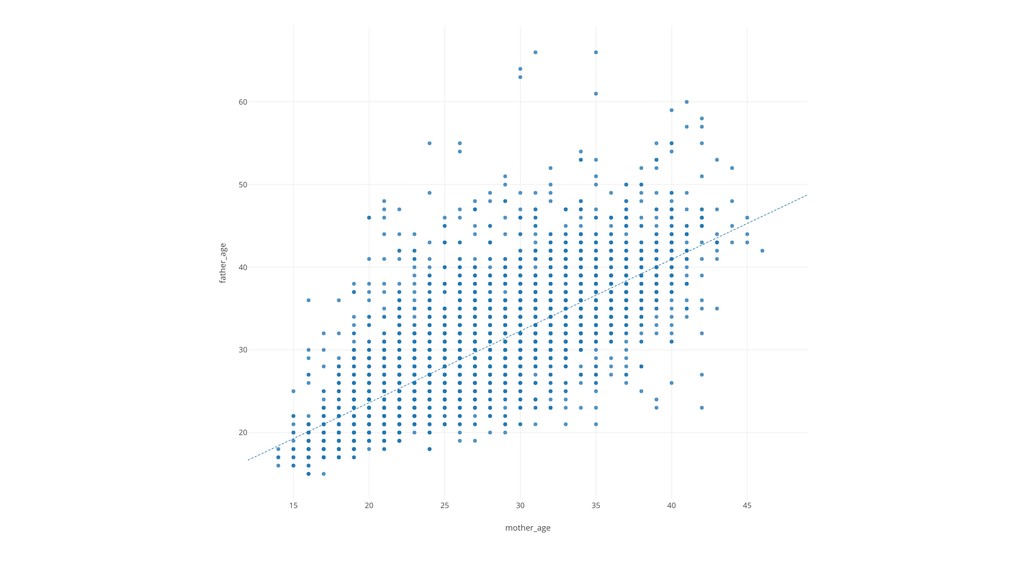
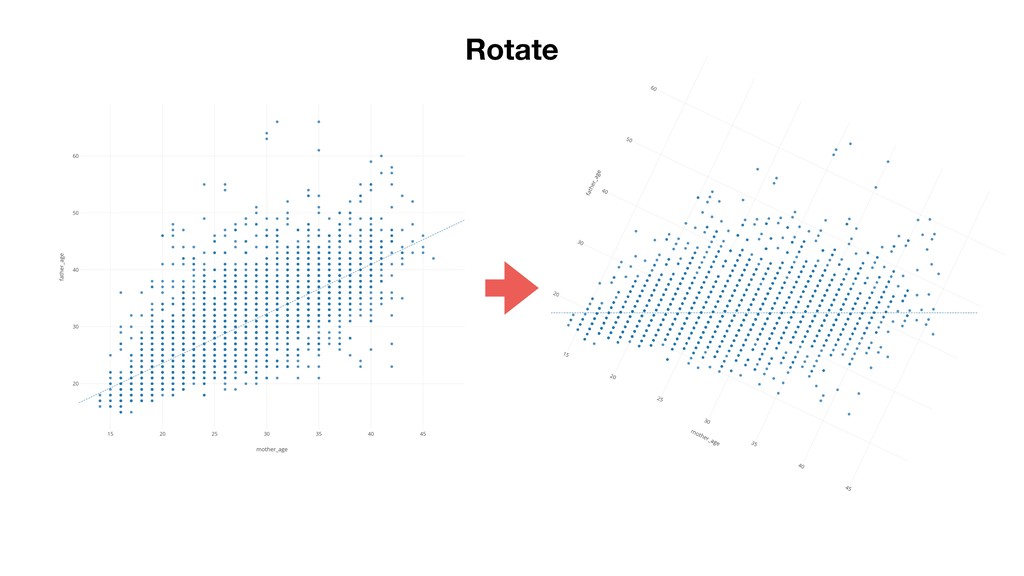
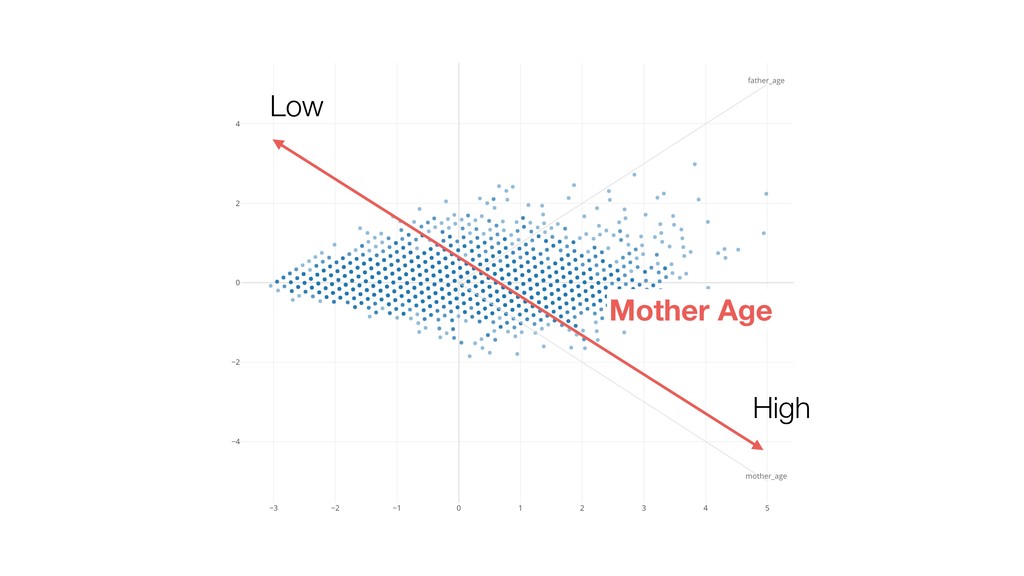
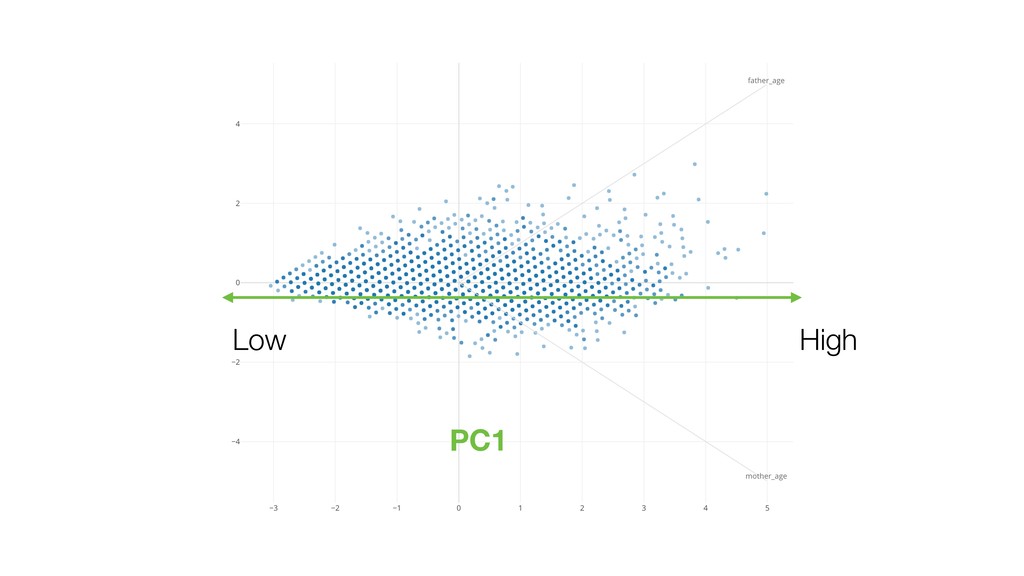
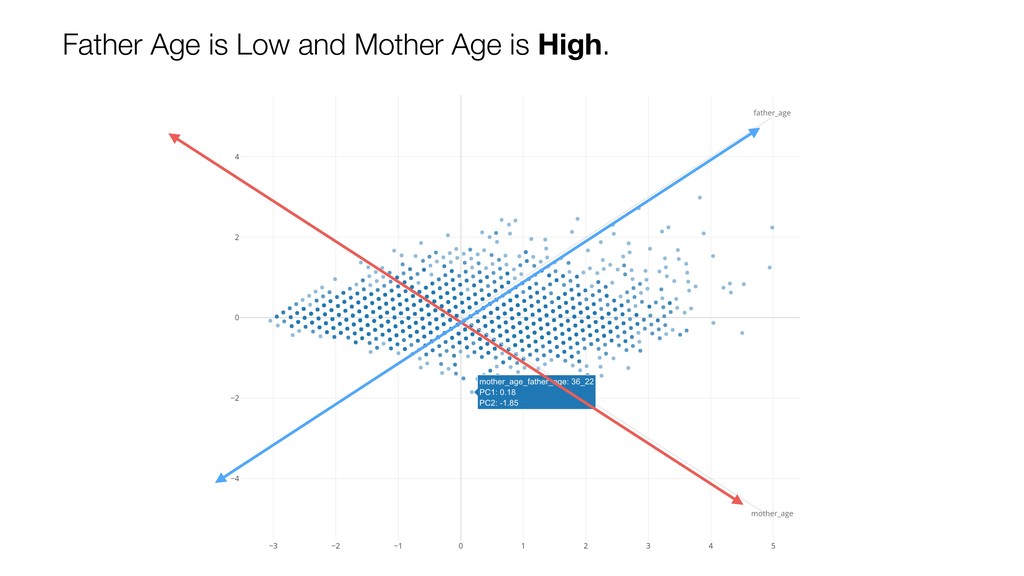
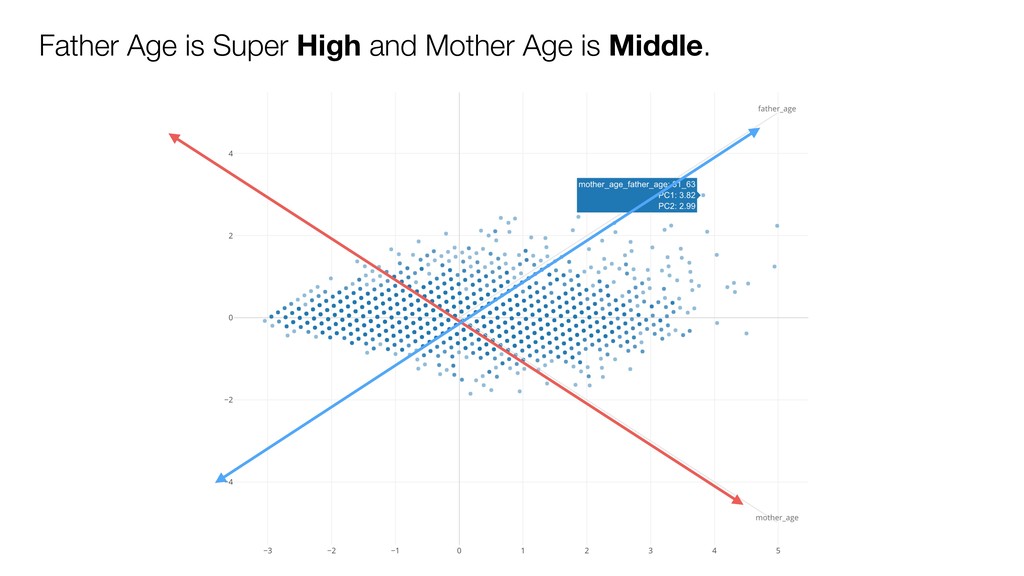
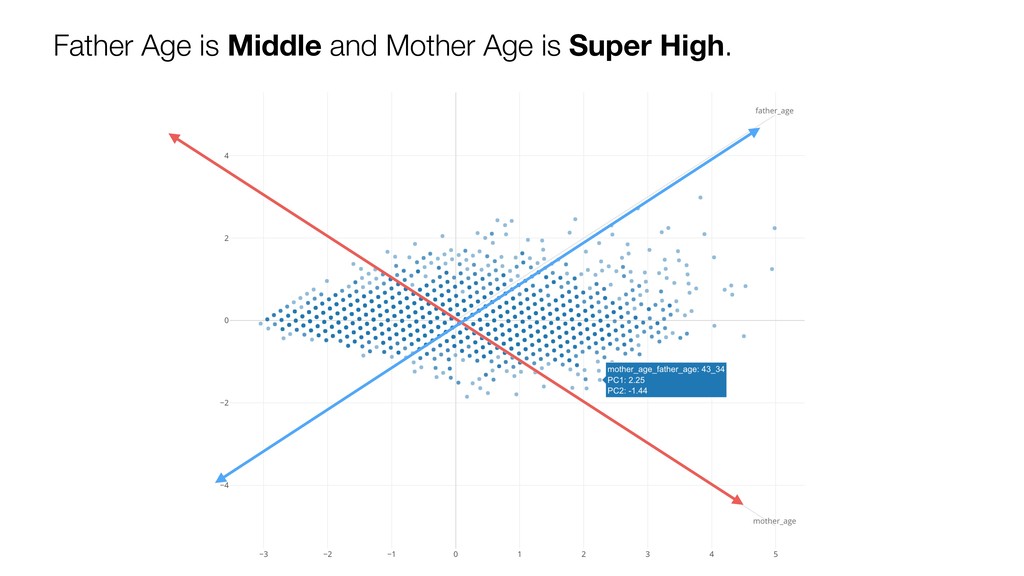
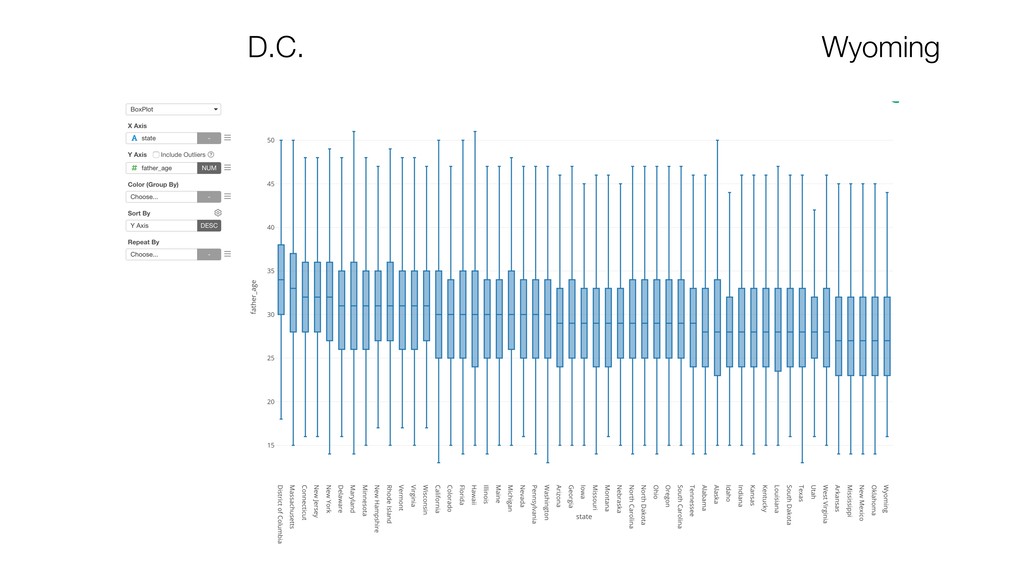
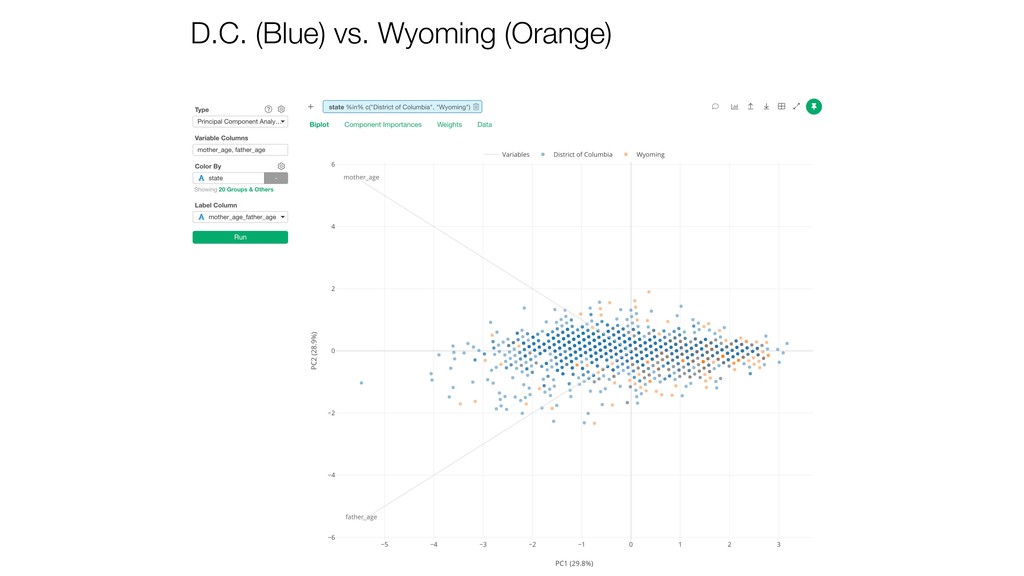
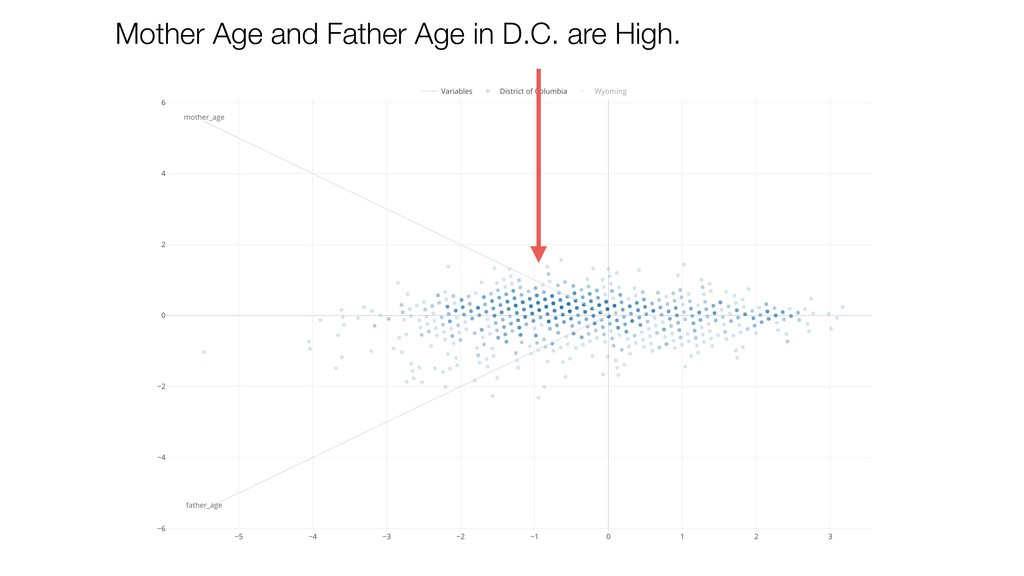
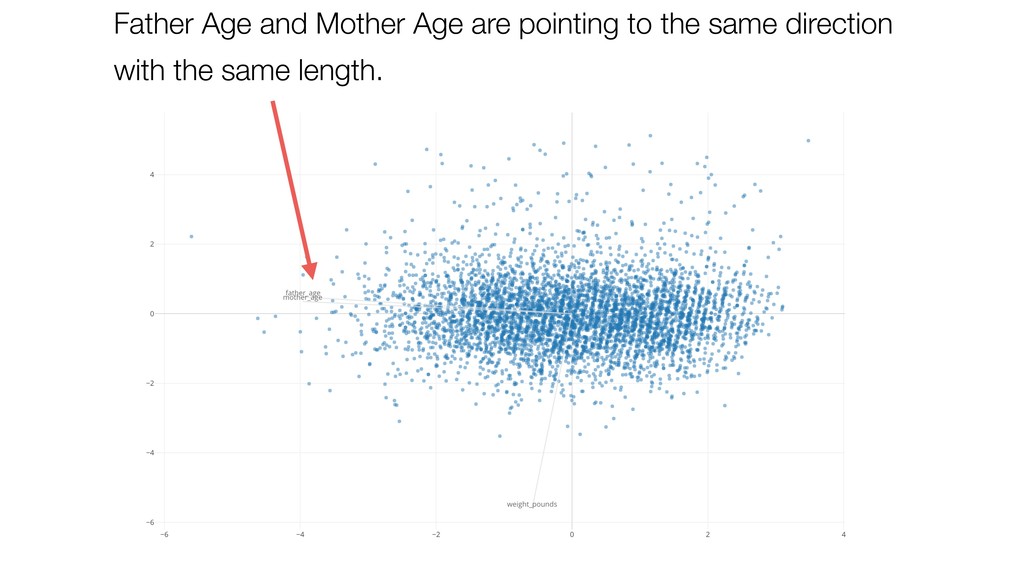
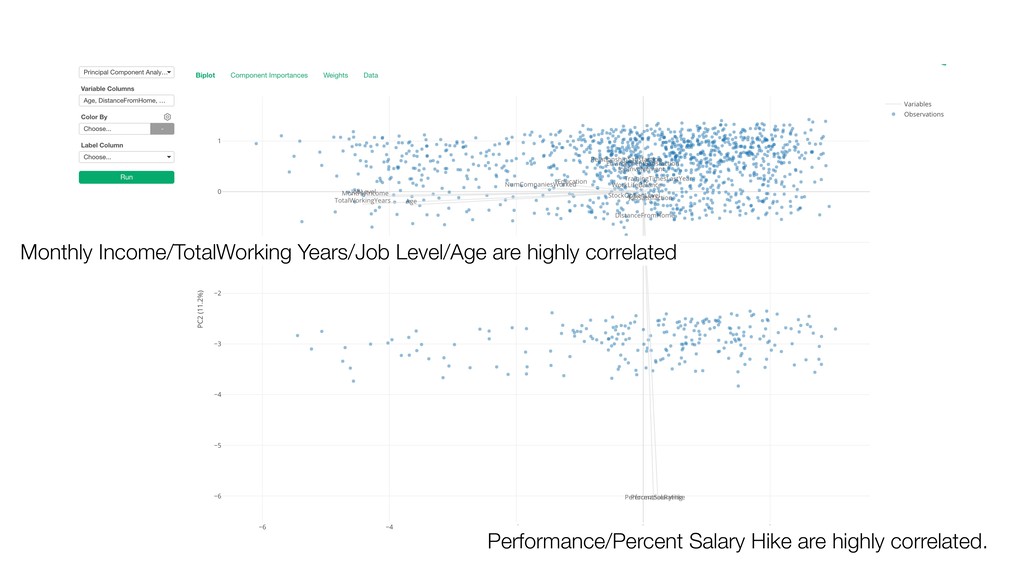
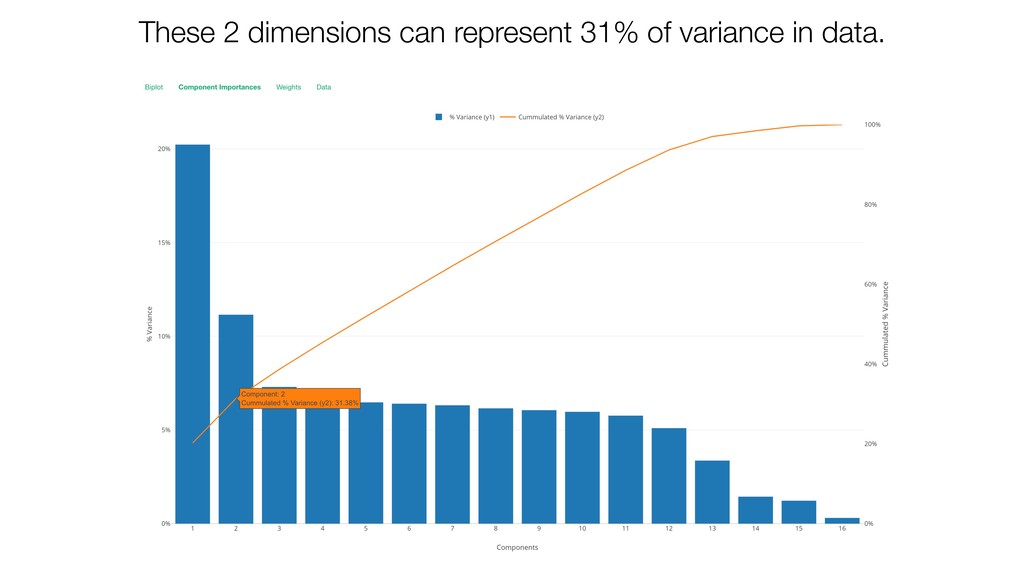
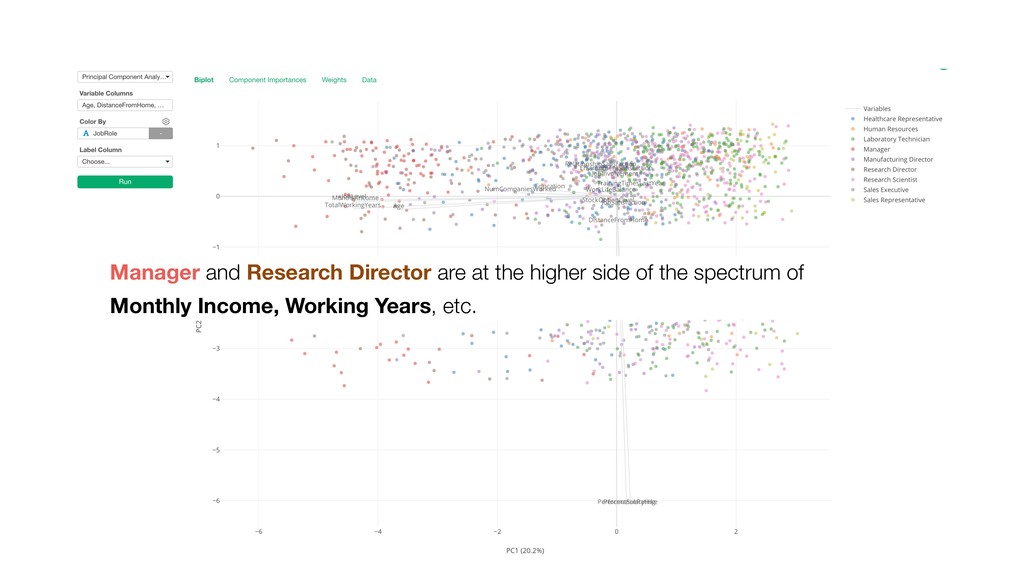
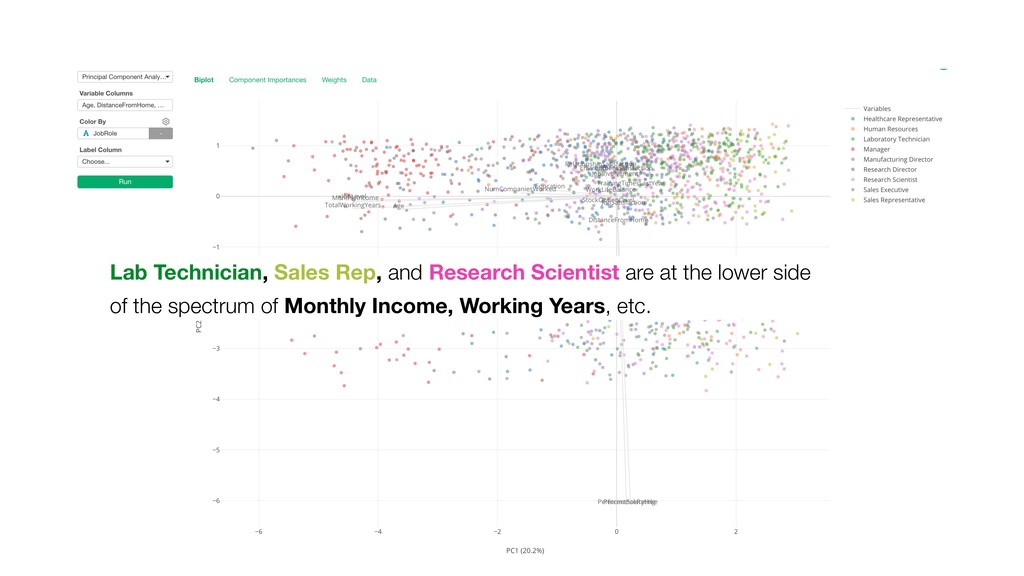
Principal Component Analysis (PCA) is an unsupervised machine learning algorithm and is known as one of the most popular dimensionality reduction technique. It can be also often used to visualize the relationships between the variables or even between the subjects of your interest such as customers, products, countries, etc.

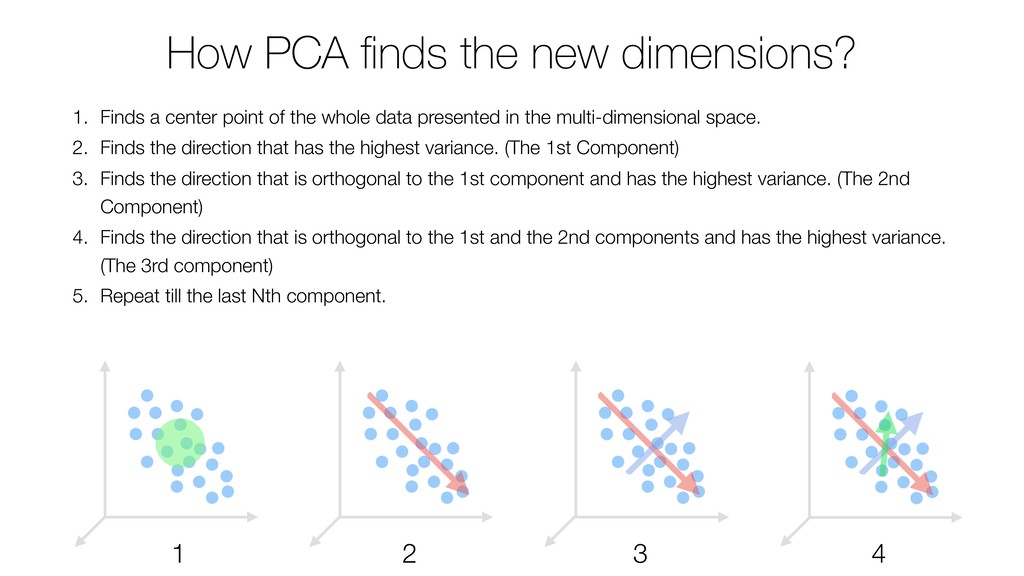
Kan will introduce the basic concept of PCA and demonstrate how to use it to discover the patterns in data and understand the relationships better with many examples.

Kan Nishida

September 11, 2019
Tweet

More Decks by Kan Nishida

Other Decks in Science

Transcript

  1. Kan Nishida co-founder/CEO Exploratory Summary Beginning of 2016, launched Exploratory,

    Inc. to democratize Data Science. Prior to Exploratory, Kan was a director of product development at Oracle leading teams for building various Data Science products in areas including Machine Learning, BI, Data Visualization, Mobile Analytics, Big Data, etc. While at Oracle, Kan also provided training and consulting services to help organizations transform with data. @KanAugust Speaker
  2. Data Science is not just for Engineers and Statisticians. Exploratory

    makes it possible for Everyone to do Data Science. The Third Wave
  3. First Wave Second Wave Third Wave Proprietary Open Source UI

    & Programming Programming 2016 2000 1976 Monetization Commoditization Democratization Statisticians Data Scientists Democratization of Data Science Algorithms Experience Tools Open Source UI & Automation Business Users Theme Users
  4. Questions Communication (Dashboard, Note, Slides) Data Access Data Wrangling Visualization

    Analytics (Statistics / Machine Learning) Exploratory Data Analysis
  5. PCA • Unsupervised Statistical Learning (Machine Learning) algorithm. • Often

    used as Dimensionality Reduction technique, which is to represent the original information with fewer dimensions while minimizing the loss of information. • Also, it’s useful to visualize the relationships between the variables and characterize the subjects of your interest such as customers, products, countries, etc.
  6. 13 Age Monthly Income The bigger the Age is, the

    bigger the Monthly Income is. Correlation
  7. When we have a set of variables that are highly

    correlated, do we need to keep all of them?
  8. If we can represent the data with fewer variables… it’s

    easier to visualize the relationship in the data.
  9. If we can represent the data with fewer variables… it’s

    easier to visualize the relationship in the data. This makes easier to discover and understand the relationship in the data
  10. Generates a new set of artificial dimensions (components) that are

    created in a way that they are not correlated to one another and that can carry as much information of the original data as possible with fewer dimensions. PCA
  11. How PCA finds the new dimensions? 1. Finds a center

    point of the whole data presented in the multi-dimensional space. 2. Finds the direction that has the highest variance. (The 1st Component) 3. Finds the direction that is orthogonal to the 1st component and has the highest variance. (The 2nd Component) 4. Finds the direction that is orthogonal to the 1st and the 2nd components and has the highest variance. (The 3rd component) 5. Repeat till the last Nth component. 1 2 3 4
  12. PCA • Find the directions (Components) in data that has

    high variance. • Find a few components with high variance that can explain the most variance of data. (Principal Components)
  13. PCA

  14. Why do we need to create new 2 dimensions to

    try to express 2 original dimensions?
  15. Father Age and Mother Age are pointing to the same

    direction with the same length.
  16. A combination of PC 1 and PC2 can express 92%

    of the original information.
  17. The 2nd component is explaining the difference between the counties

    that care about Adult Film and the counties that don’t care.
  18. Manager and Research Director are at the higher side of

    the spectrum of Monthly Income, Working Years, etc.
  19. Lab Technician, Sales Rep, and Research Scientist are at the

    lower side of the spectrum of Monthly Income, Working Years, etc.
  20. Why PCA? • Dimensionality Reduction. • Make it easier to

    visualize high dimensional data. • Understand the patterns and characteristics inside the Data better.