Upgrade to Pro — share decks privately, control downloads, hide ads and more …

Data Processing with Dr Kat

Data Processing with Dr Kat

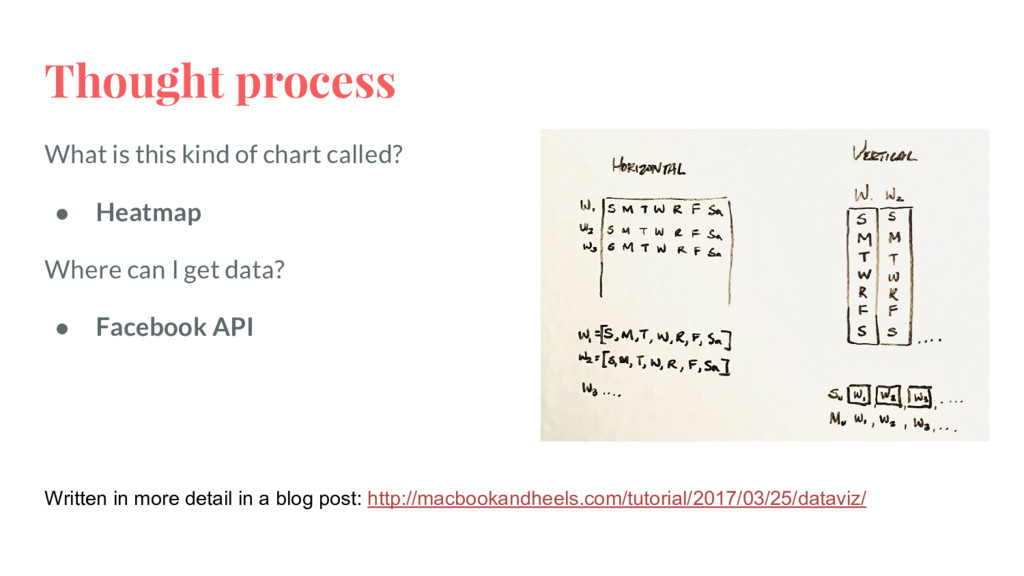
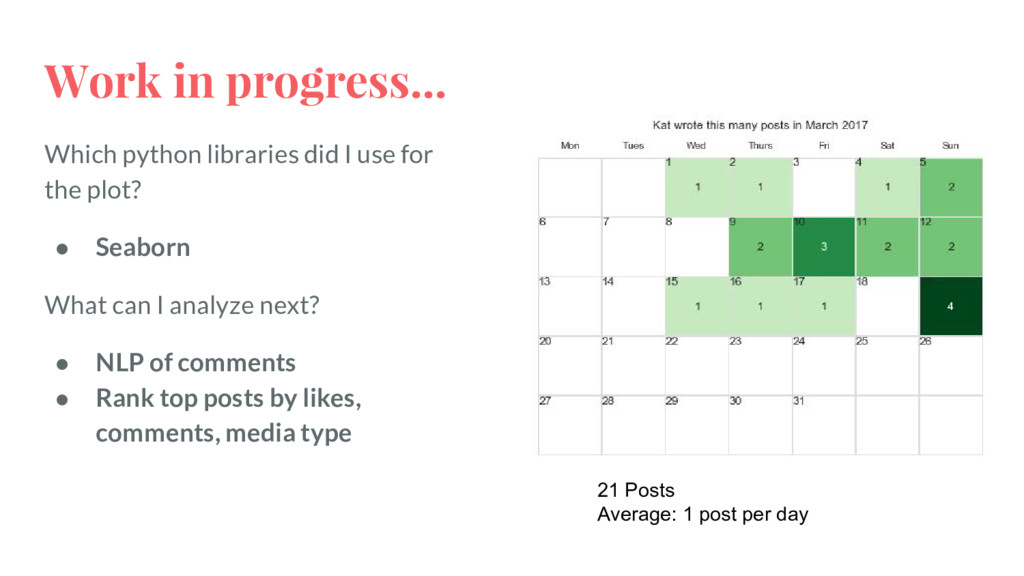
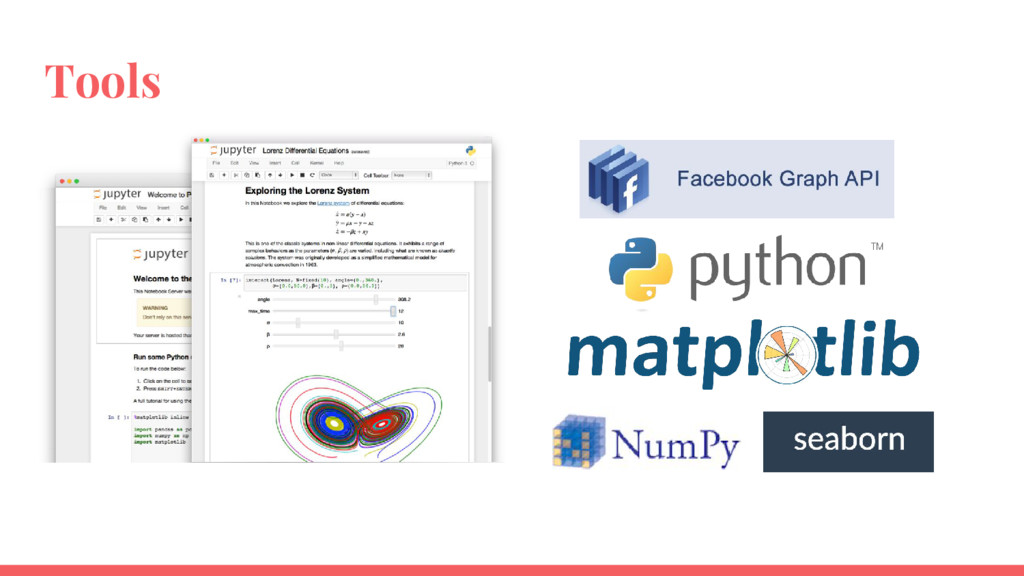
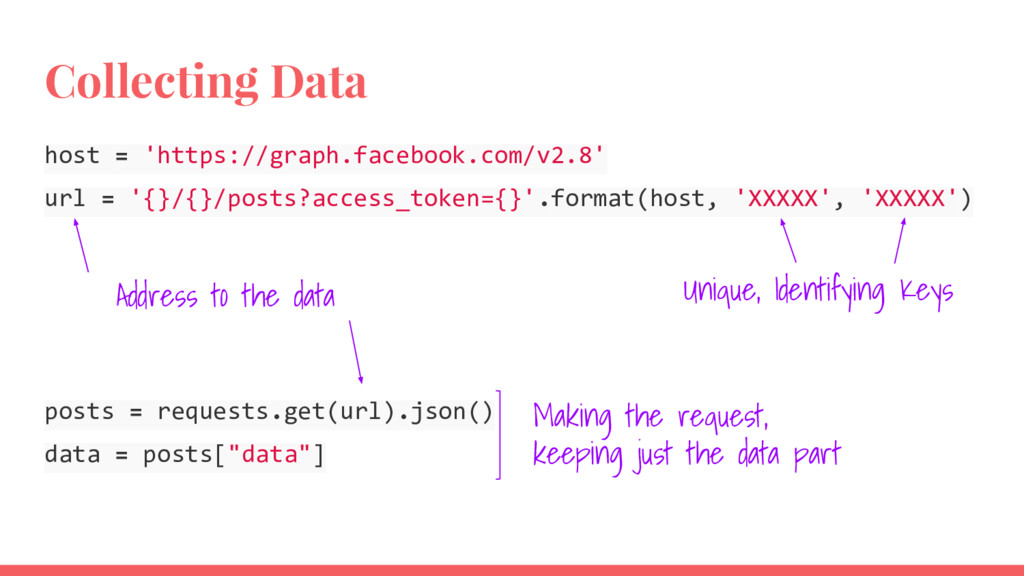
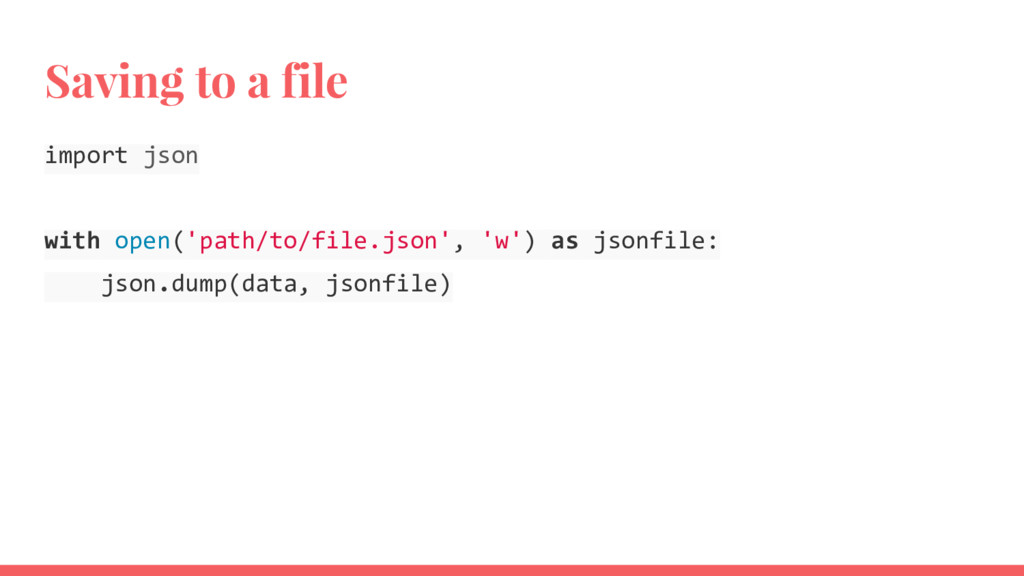
Ask not just what data your computer can track -- ask what you can do with tangible data. I invite you to take a journey with me thru an application of coding to help form new habits. I will show you how you can turn data into informational graphics that can transform your ability to self-assess. We will walk thru the process step by step, from the initial brainstorming steps, thru processing raw JSON data from Facebook's Graph API, to visualizing it with seaborn, a Python visualization library based on matplotlib.

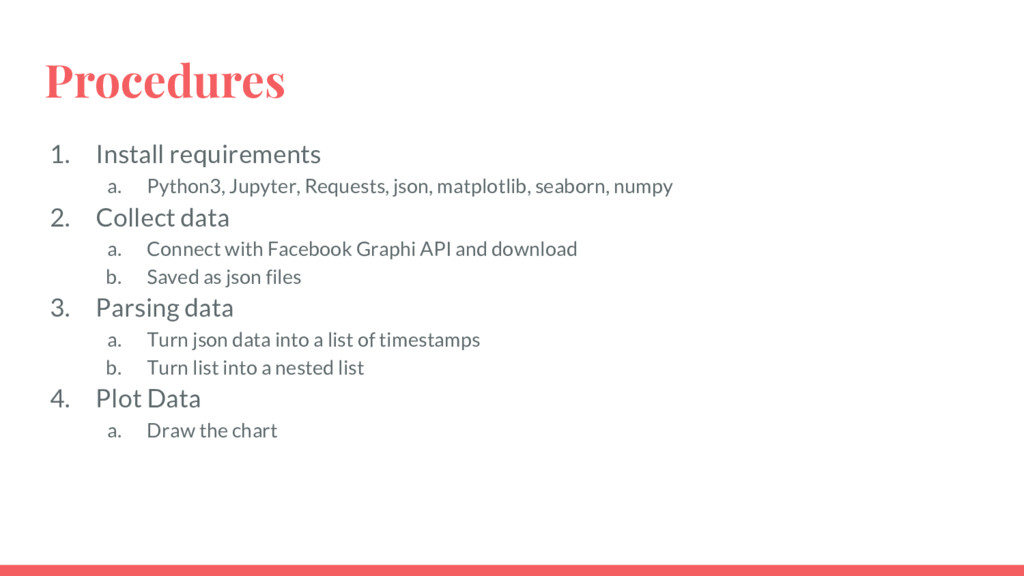
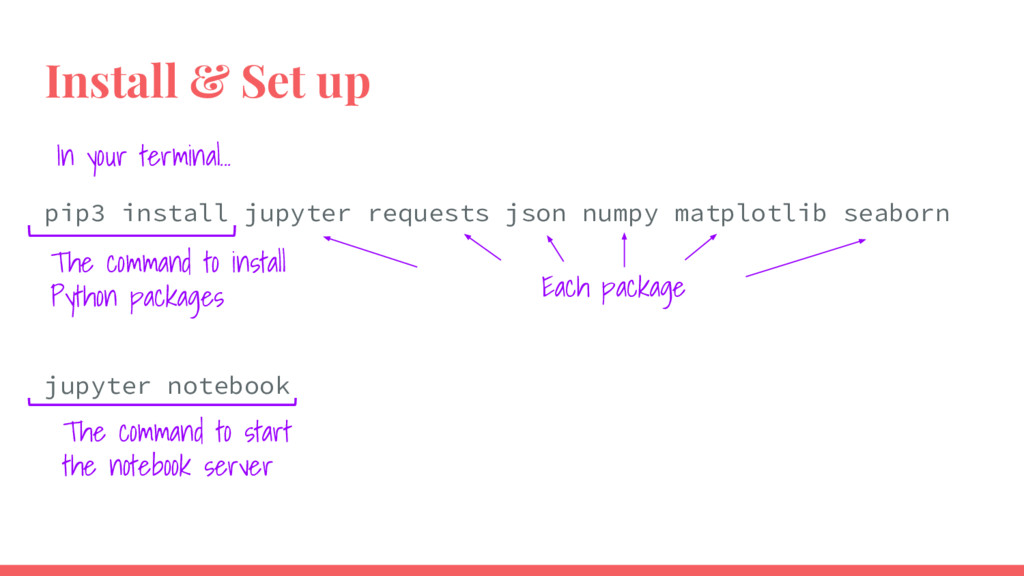
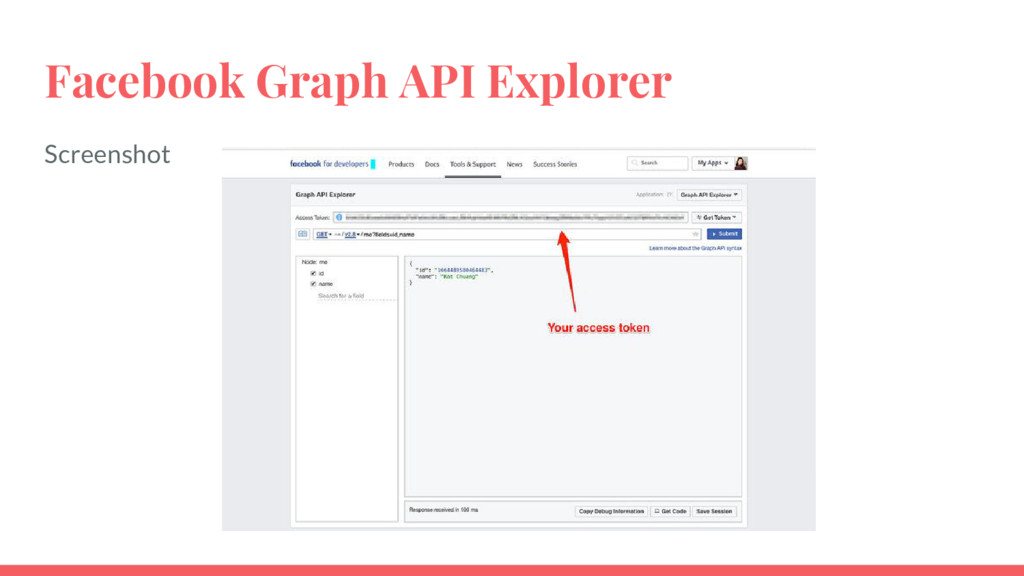
This talk is designed to be beginner friendly, so you do not need to have experience with coding. The code shown in this demonstration will be in Python. It is not a workshop but you are welcome to bring your laptop to follow along during code demonstrations. If you choose to do this, please have Python 3 and the dependences (jupyter notebook, matplotlib, numpy, and seaborn) installed before the workshop and have a personal, local copy of JSON data from the api (to sidestep potential wifi issues). A pared down example of how to do this was written on my blog. (Link: https://goo.gl/5PKaCx)

Kat Chuang

May 01, 2017
Tweet

More Decks by Kat Chuang

Other Decks in Programming

Transcript

  1. Hello, I’m Kat I design and code. Data-driven decisions! Everyone

    shall make. I help make events happen for these groups http://katychuang.com [email protected] katychuang = annotations = main content #haikus #haikubio
  2. Background Ph.D. Research • Studied patient support communities. • Research

    Goals: see how UI design affected supportive communication behavior • Methods: social network analysis, text analysis As of lately, • Front-end web development & UX design for an analytics consulting firm • Primarily with Haskell, CSS
  3. Lots of Hobbies • I like photography • I like

    dancing • I like coding • I like teaching • I like minimalism macbookandheels.com Team Treehouse Lei Pasifika
  4. Introduction & Motivations Some of my new year resolutions... -

    Write more this year - Create data visualizations Jan 1 Feb 1 Mar 1 Apr 1 May 1 Figuring out priorities Writing Coding MacbookandHeels.com my blog =)
  5. Reflecting on activities ... maybe like this chart At two

    weeks of writing, I realized I could measure my progress…. + An opportunity to write code + Create a data visualization
  6. Thought process What is this kind of chart called? •

    Heatmap Where can I get data? • Facebook API Written in more detail in a blog post: http://macbookandheels.com/tutorial/2017/03/25/dataviz/
  7. Work in progress... Which python libraries did I use for

    the plot? • Seaborn What can I analyze next? • NLP of comments • Rank top posts by likes, comments, media type 21 Posts Average: 1 post per day
  8. Procedures 1. Install requirements a. Python3, Jupyter, Requests, json, matplotlib,

    seaborn, numpy 2. Collect data a. Connect with Facebook Graphi API and download b. Saved as json files 3. Parsing data a. Turn json data into a list of timestamps b. Turn list into a nested list 4. Plot Data a. Draw the chart
  9. Install & Set up pip3 install jupyter requests json numpy

    matplotlib seaborn jupyter notebook The command to install Python packages Each package The command to start the notebook server In your terminal...
  10. Collecting Data host = 'https://graph.facebook.com/v2.8' url = '{}/{}/posts?access_token={}'.format(host, 'XXXXX', 'XXXXX')

    posts = requests.get(url).json() data = posts["data"] Address to the data Unique, Identifying Keys Making the request, keeping just the data part
  11. Reading from a file import json with open('path/to/file.json') as json_data:

    data = json.load(json_data) Not the same ‘data’ variable as before!!
  12. Parsing Data for status in data: timestamp = status['created_time'] day_of_week

    = timestamp.strftime("%A") return day_of_week list(map((lambda x: parse(x['created_time']).strftime('%A')),data)) The above can also be written as:
  13. Filter m = datetime(2017, 3, 1) march_posts = list( filter(

    lambda x: parse(x['created_time'][:-5]) >= m , data ))
  14. Demo Get the list of timestamps for facebook status updates

    made in March • Filter by date • Extract timestamps
  15. Plotting Data on a Heatmap import seaborn ax = seaborn.heatmap(activity)

    To better understand settings and configuration, read the docs: http://seaborn.pydata.org/generated/sea born.heatmap.html
  16. Basic chart sns.set(font_scale=1.2) sns.set_style({"savefig.dpi": 100}) ax = sns.heatmap( activity ,

    cmap=plt.cm.Greens , linewidths=.1 , cbar=False) ax.xaxis.tick_top() ax.set_xticklabels(column_labels, minor=False) ax.set_yticklabels(list(''), minor=False) fig = ax.get_figure()
  17. Reflections What did I learn from this project? • Didn’t

    write on Mondays and Tuesdays • This took a lot of time! • Great way to refresh Python knowledge What are the next steps? • Replicating this in Haskell • More data analysis
  18. Thank You! “By three methods we may learn wisdom: First,

    by reflection, which is noblest; Second, by imitation, which is easiest; and third by experience, which is the bitterest.” - Confucius Questions? Comments?
  19. Contact Info For more content like this, follow my blog!

    http://macbookandheels.com MacbookandHeels To contact me directly: http://katychuang.com [email protected] katychuang Tutorials