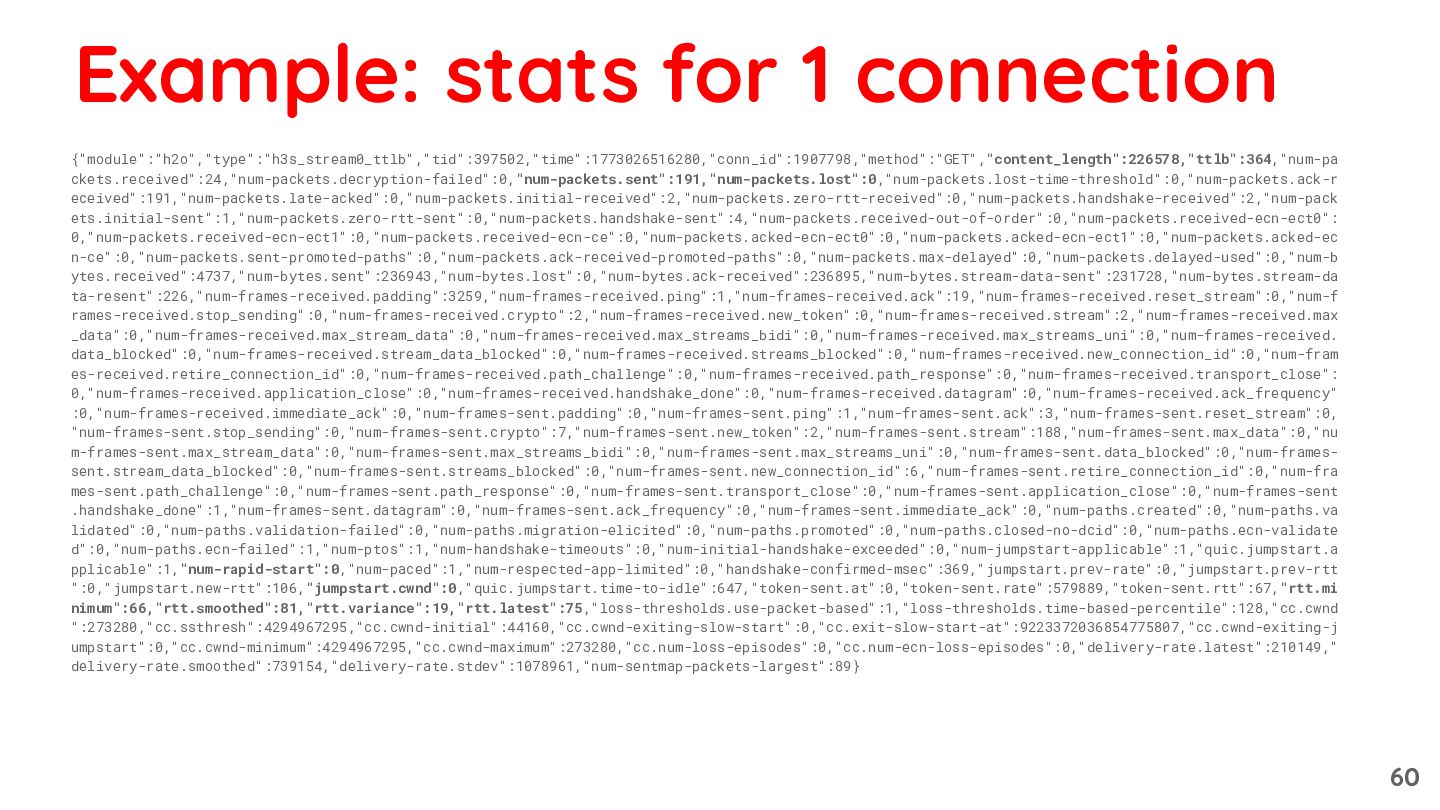
data_blocked":0,"num-frames-received.stream_data_blocked":0,"num-frames-received.streams_blocked":0,"num-frames-received.new_connection_id":0,"num-fram es-received.retire_connection_id":0,"num-frames-received.path_challenge":0,"num-frames-received.path_response":0,"num-frames-received.transport_close": 0,"num-frames-received.application_close":0,"num-frames-received.handshake_done":0,"num-frames-received.datagram":0,"num-frames-received.ack_frequency" :0,"num-frames-received.immediate_ack":0,"num-frames-sent.padding":0,"num-frames-sent.ping":1,"num-frames-sent.ack":3,"num-frames-sent.reset_stream":0, "num-frames-sent.stop_sending":0,"num-frames-sent.crypto":7,"num-frames-sent.new_token":2,"num-frames-sent.stream":188,"num-frames-sent.max_data":0,"nu m-frames-sent.max_stream_data":0,"num-frames-sent.max_streams_bidi":0,"num-frames-sent.max_streams_uni":0,"num-frames-sent.data_blocked":0,"num-frames- sent.stream_data_blocked":0,"num-frames-sent.streams_blocked":0,"num-frames-sent.new_connection_id":6,"num-frames-sent.retire_connection_id":0,"num-fra mes-sent.path_challenge":0,"num-frames-sent.path_response":0,"num-frames-sent.transport_close":0,"num-frames-sent.application_close":0,"num-frames-sent .handshake_done":1,"num-frames-sent.datagram":0,"num-frames-sent.ack_frequency":0,"num-frames-sent.immediate_ack":0,"num-paths.created":0,"num-paths.va lidated":0,"num-paths.validation-failed":0,"num-paths.migration-elicited":0,"num-paths.promoted":0,"num-paths.closed-no-dcid":0,"num-paths.ecn-validate d":0,"num-paths.ecn-failed":1,"num-ptos":1,"num-handshake-timeouts":0,"num-initial-handshake-exceeded":0,"num-jumpstart-applicable":1,"quic.jumpstart.a pplicable":1,"num-rapid-start":0,"num-paced":1,"num-respected-app-limited":0,"handshake-confirmed-msec":369,"jumpstart.prev-rate":0,"jumpstart.prev-rtt ":0,"jumpstart.new-rtt":106,"jumpstart.cwnd":0,"quic.jumpstart.time-to-idle":647,"token-sent.at":0,"token-sent.rate":579889,"token-sent.rtt":67,"rtt.mi nimum":66,"rtt.smoothed":81,"rtt.variance":19,"rtt.latest":75,"loss-thresholds.use-packet-based":1,"loss-thresholds.time-based-percentile":128,"cc.cwnd ":273280,"cc.ssthresh":4294967295,"cc.cwnd-initial":44160,"cc.cwnd-exiting-slow-start":0,"cc.exit-slow-start-at":9223372036854775807,"cc.cwnd-exiting-j umpstart":0,"cc.cwnd-minimum":4294967295,"cc.cwnd-maximum":273280,"cc.num-loss-episodes":0,"cc.num-ecn-loss-episodes":0,"delivery-rate.latest":210149," delivery-rate.smoothed":739154,"delivery-rate.stdev":1078961,"num-sentmap-packets-largest":89} Example: stats for 1 connection 60
![jrf '{ "min" => min(_["rtt.minimum"]), "max" => max(_["rtt.minimum"]), "avg" =>](https://files.speakerdeck.com/presentations/6cdcc3bc3d194d5088faa3f001d3ea25/slide_72.jpg)
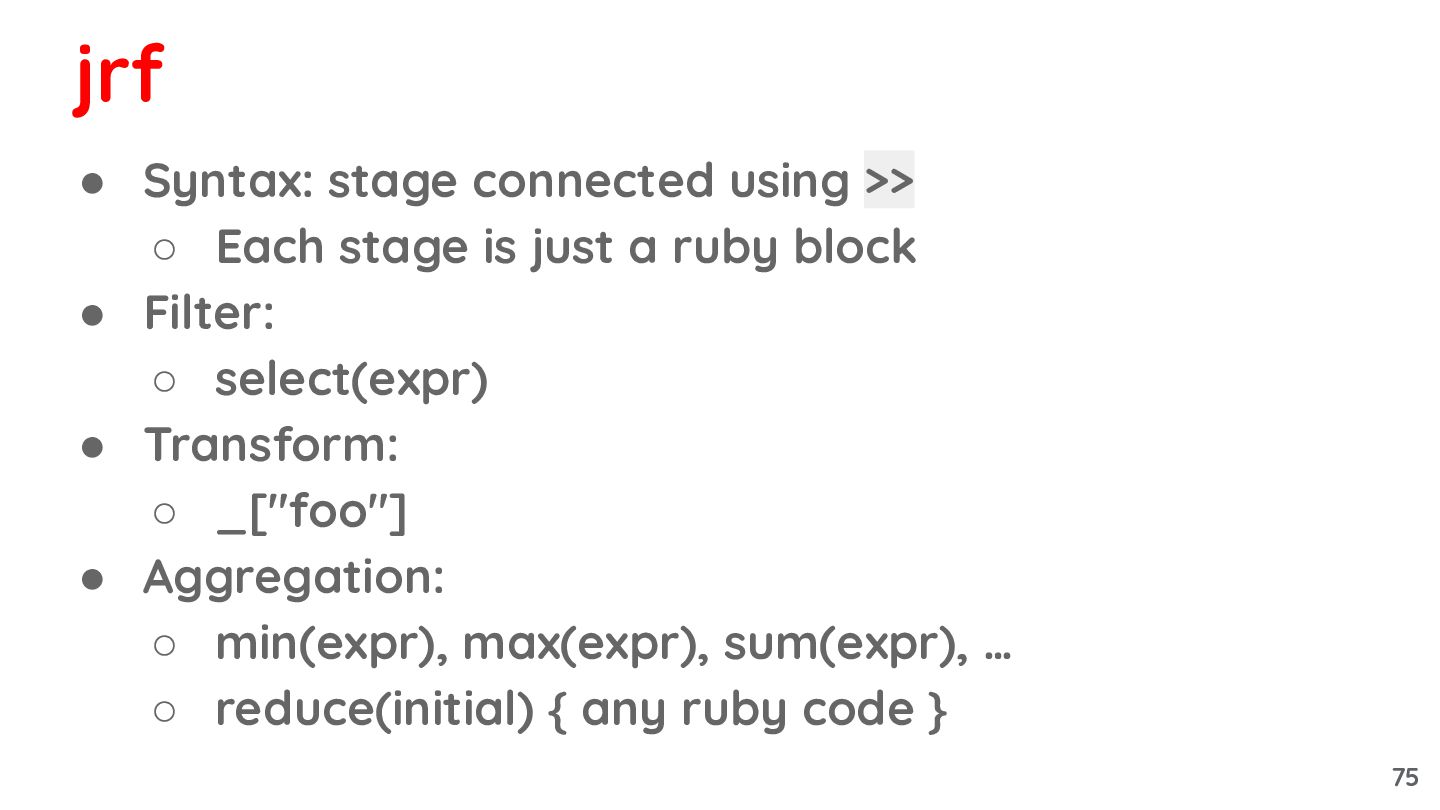
![# Filter then extract jrf 'select(_["x"] > 10) >> _["foo"]'](https://files.speakerdeck.com/presentations/6cdcc3bc3d194d5088faa3f001d3ea25/slide_73.jpg)