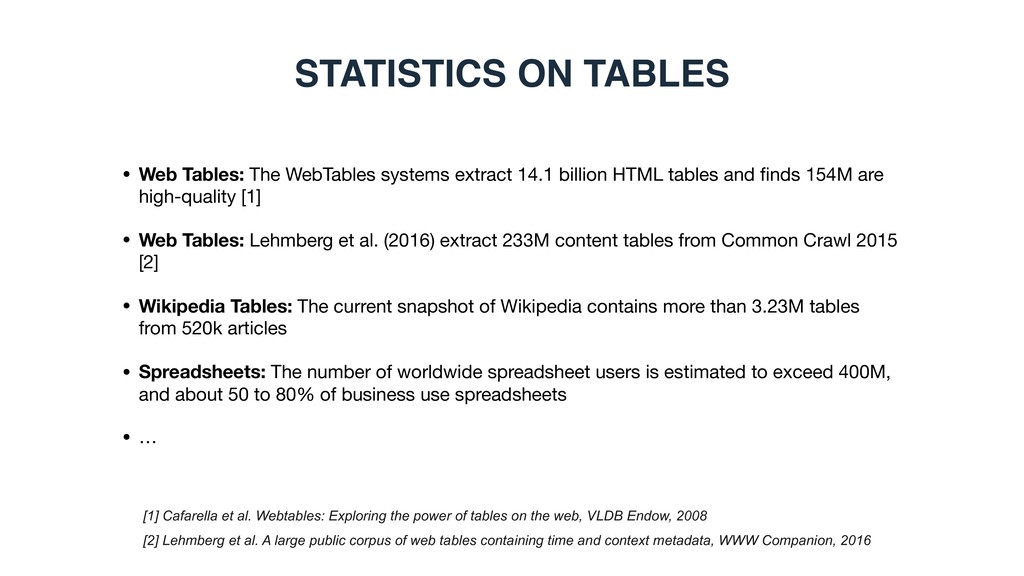
tables and finds 154M are high-quality [1] • Web Tables: Lehmberg et al. (2016) extract 233M content tables from Common Crawl 2015 [2] • Wikipedia Tables: The current snapshot of Wikipedia contains more than 3.23M tables from 520k articles • Spreadsheets: The number of worldwide spreadsheet users is estimated to exceed 400M, and about 50 to 80% of business use spreadsheets • … STATISTICS ON TABLES [1] Cafarella et al. Webtables: Exploring the power of tables on the web, VLDB Endow, 2008 [2] Lehmberg et al. A large public corpus of web tables containing time and context metadata, WWW Companion, 2016
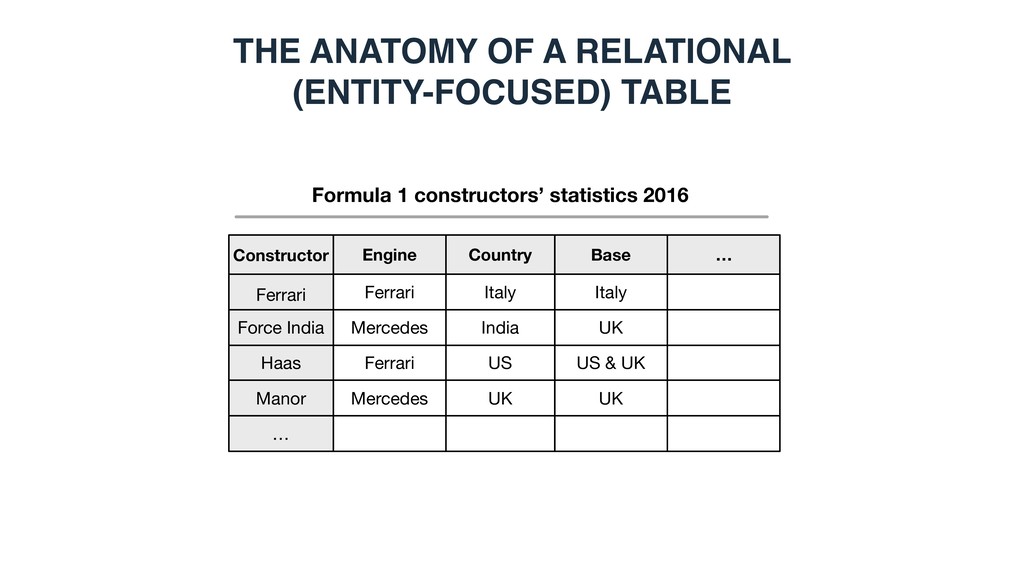
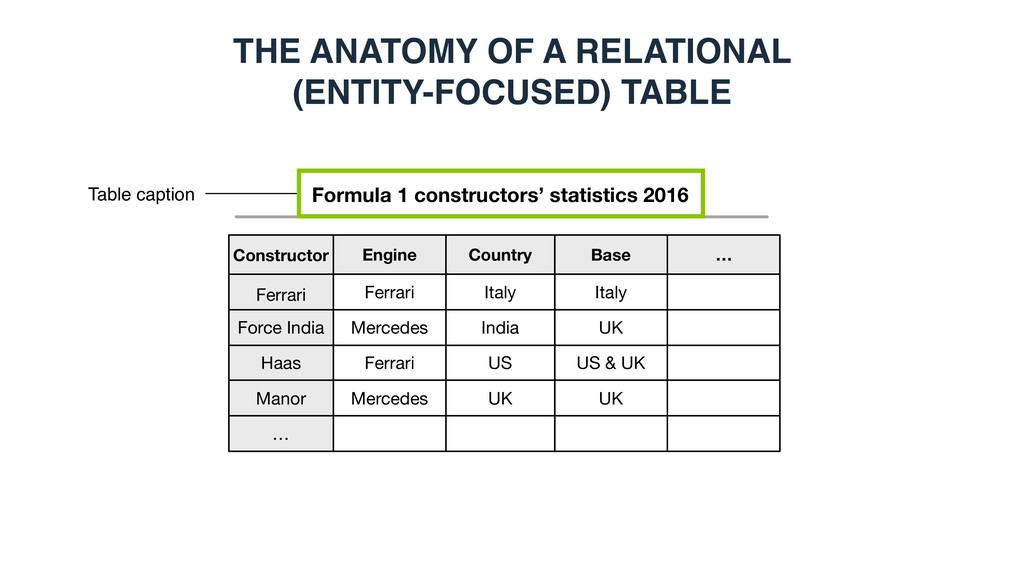
constructors’ statistics 2016 Constructor Ferrari Engine Country Base Force India Haas Ferrari Mercedes Ferrari Italy India US Italy UK US & UK Manor Mercedes UK UK … …
Force India Haas Ferrari Mercedes Ferrari Italy India US Italy UK US & UK Manor Mercedes UK UK … … Table caption THE ANATOMY OF A RELATIONAL (ENTITY-FOCUSED) TABLE
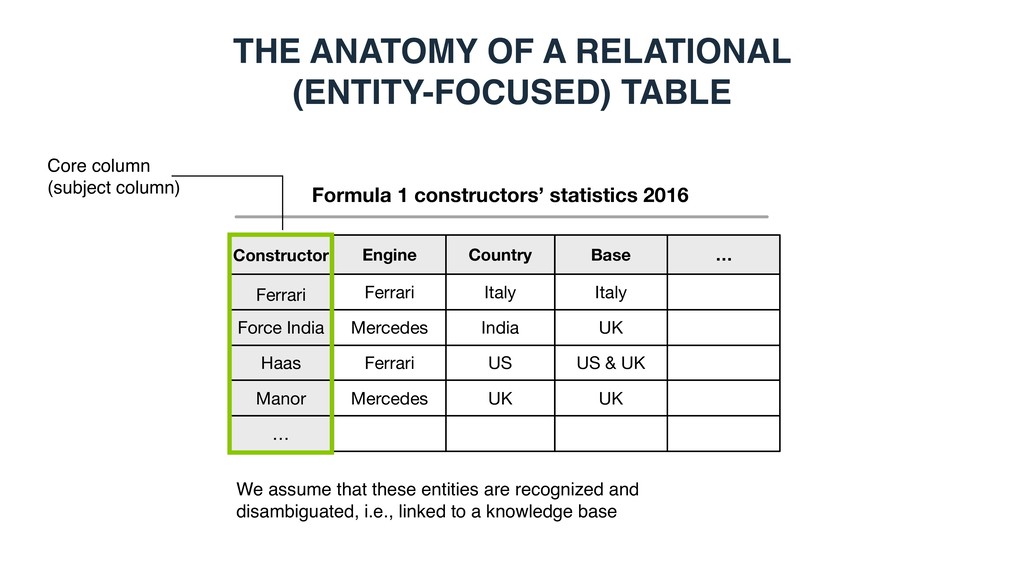
Force India Haas Ferrari Mercedes Ferrari Italy India US Italy UK US & UK Manor Mercedes UK UK … … Core column (subject column) THE ANATOMY OF A RELATIONAL (ENTITY-FOCUSED) TABLE We assume that these entities are recognized and disambiguated, i.e., linked to a knowledge base
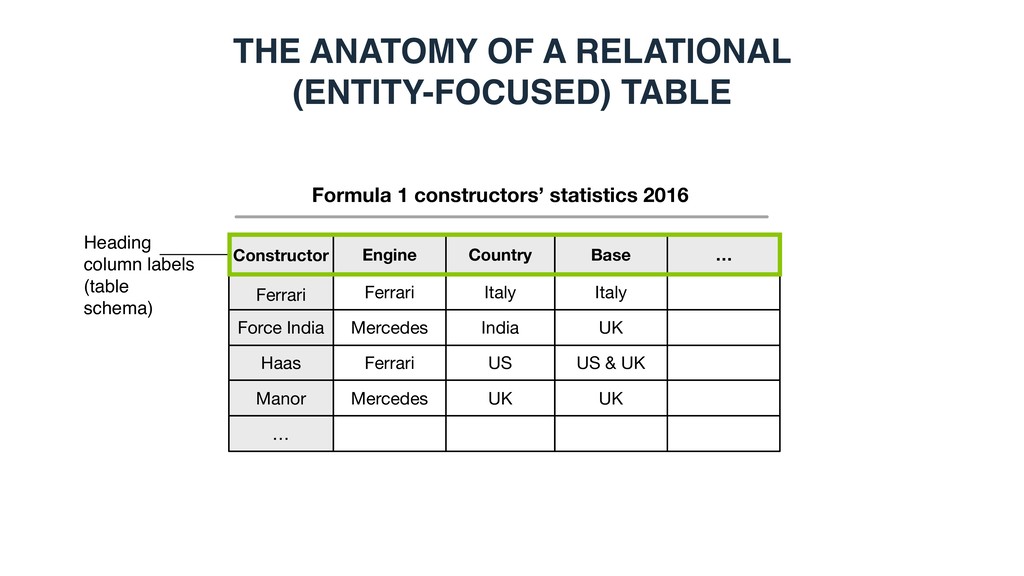
Constructor Ferrari Engine Country Base Force India Haas Ferrari Mercedes Ferrari Italy India US Italy UK US & UK Manor Mercedes UK UK … … THE ANATOMY OF A RELATIONAL (ENTITY-FOCUSED) TABLE
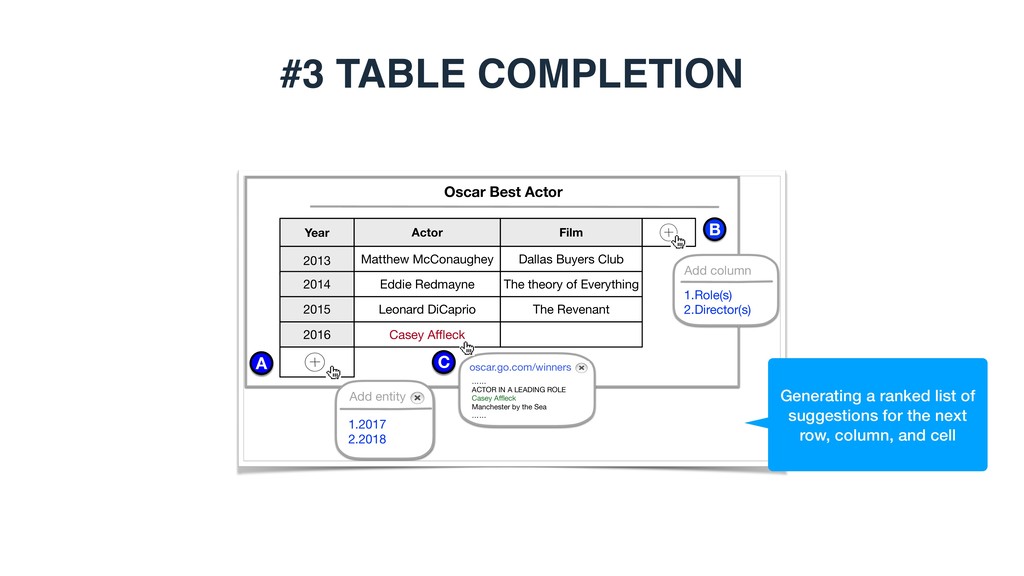
LEADING ROLE Casey Affleck Manchester by the Sea …… oscar.go.com/winners Year 2013 Actor Film 2014 2015 Matthew McConaughey Eddie Redmayne Leonard DiCaprio Dallas Buyers Club The theory of Everything The Revenant 2016 Casey Affleck A 1.2017 2.2018 Add entity B Add column 1.Role(s) 2.Director(s) C Generating a ranked list of suggestions for the next row, column, and cell
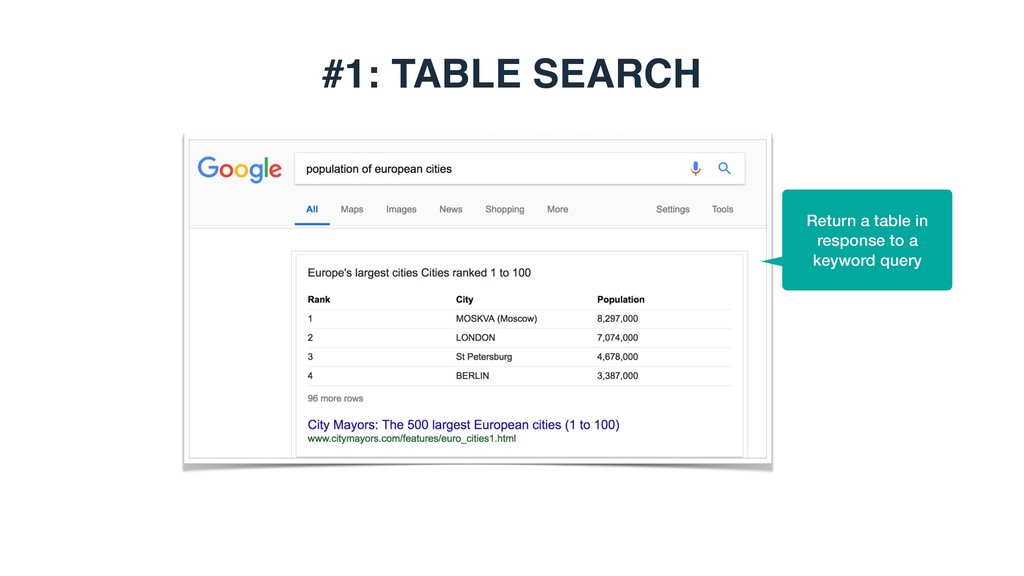
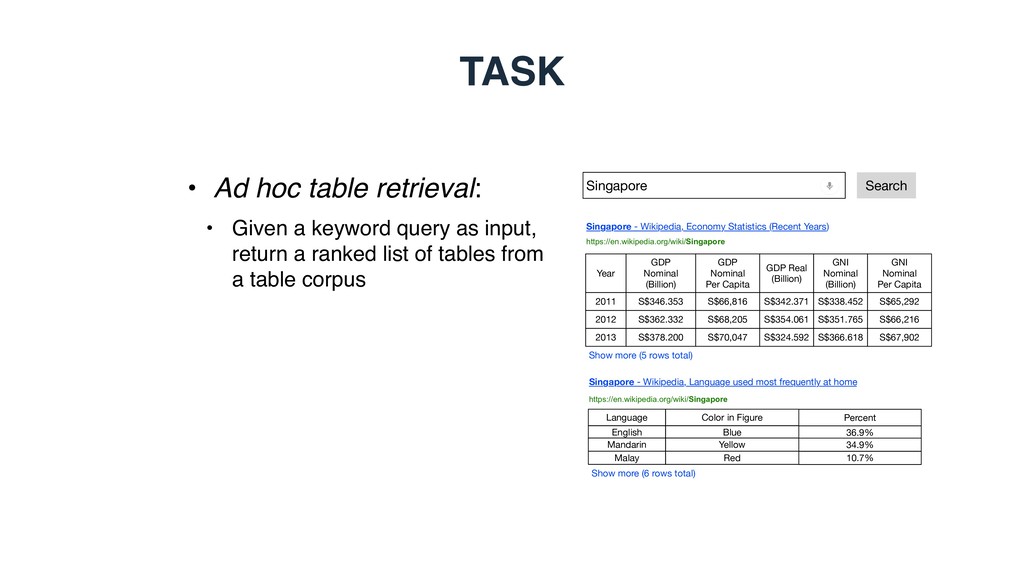
query as input, return a ranked list of tables from a table corpus Singapore Search Year GDP Nominal (Billion) GDP Nominal Per Capita GDP Real (Billion) Singapore - Wikipedia, Economy Statistics (Recent Years) GNI Nominal (Billion) GNI Nominal Per Capita 2011 S$346.353 S$66,816 S$342.371 S$338.452 S$65,292 https://en.wikipedia.org/wiki/Singapore Show more (5 rows total) Singapore - Wikipedia, Language used most frequently at home Language Color in Figure Percent English Blue 36.9% Show more (6 rows total) https://en.wikipedia.org/wiki/Singapore 2012 S$362.332 S$68,205 S$354.061 S$351.765 S$66,216 2013 S$378.200 S$70,047 S$324.592 S$366.618 S$67,902 Mandarin Yellow 34.9% Malay Red 10.7%
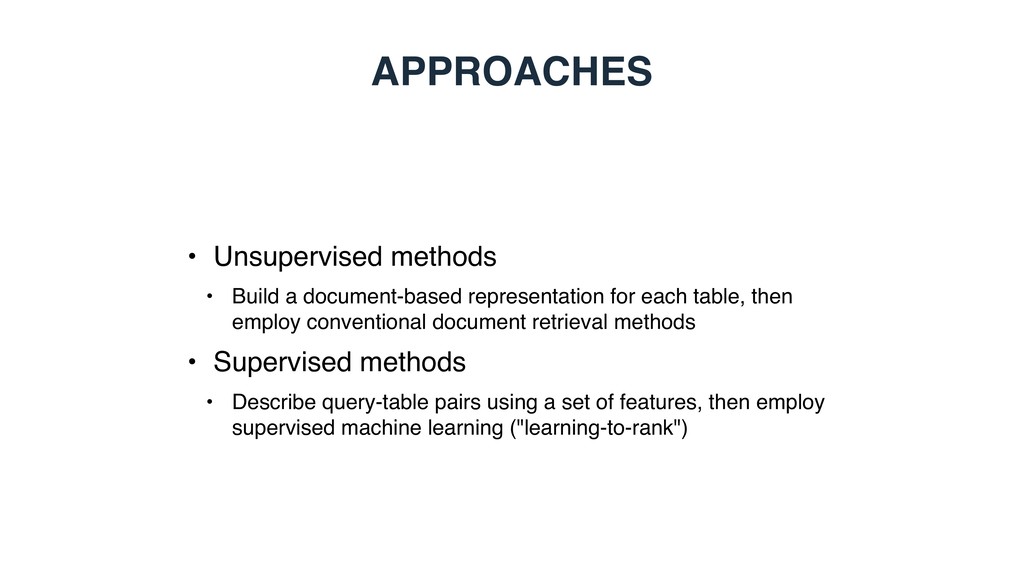
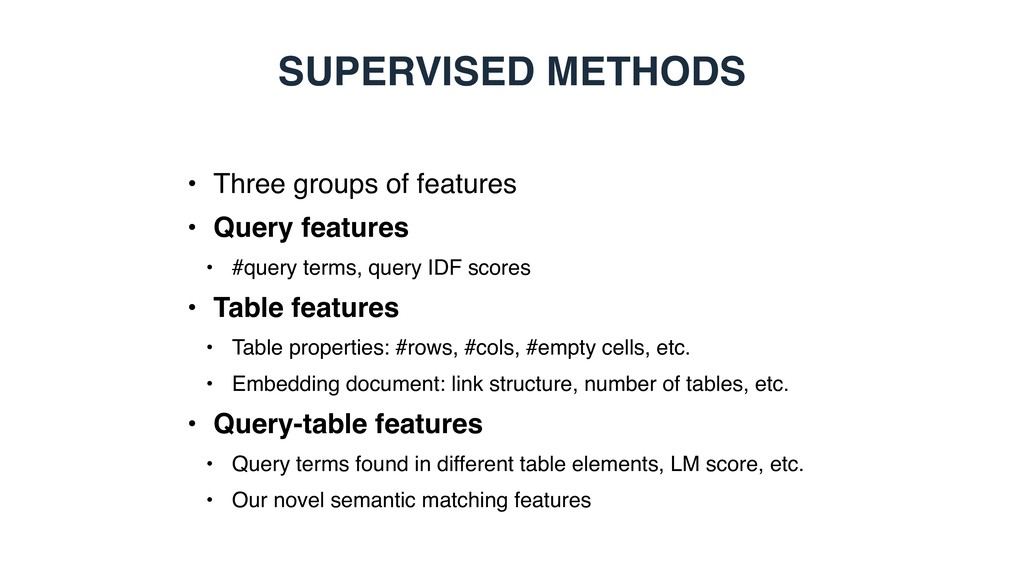
each table, then employ conventional document retrieval methods • Supervised methods • Describe query-table pairs using a set of features, then employ supervised machine learning ("learning-to-rank")
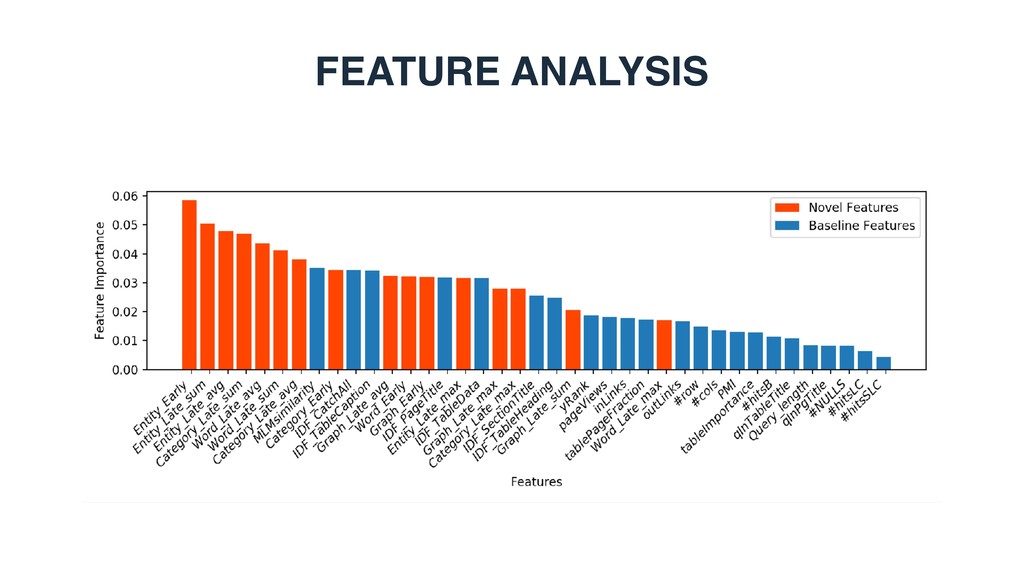
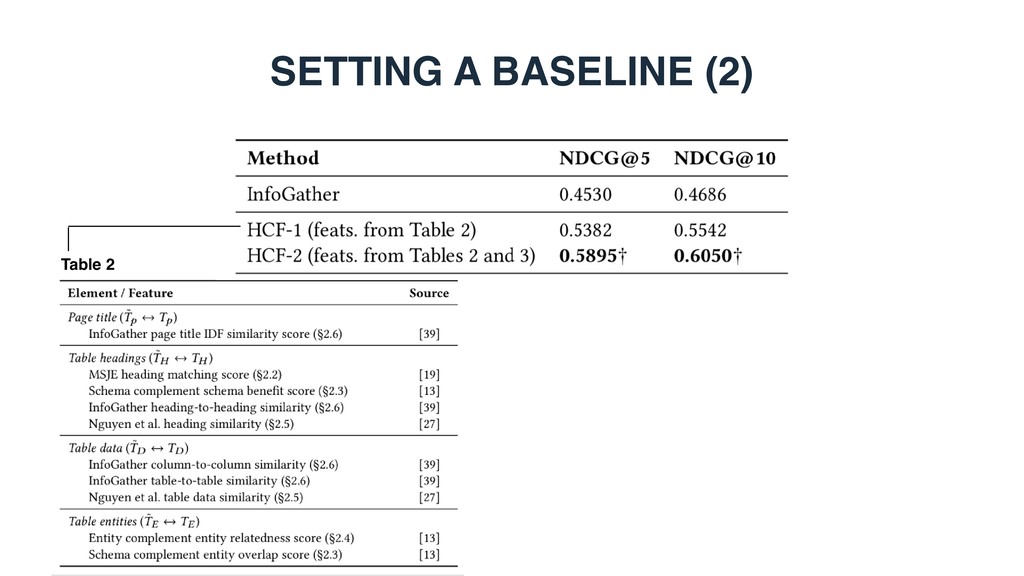
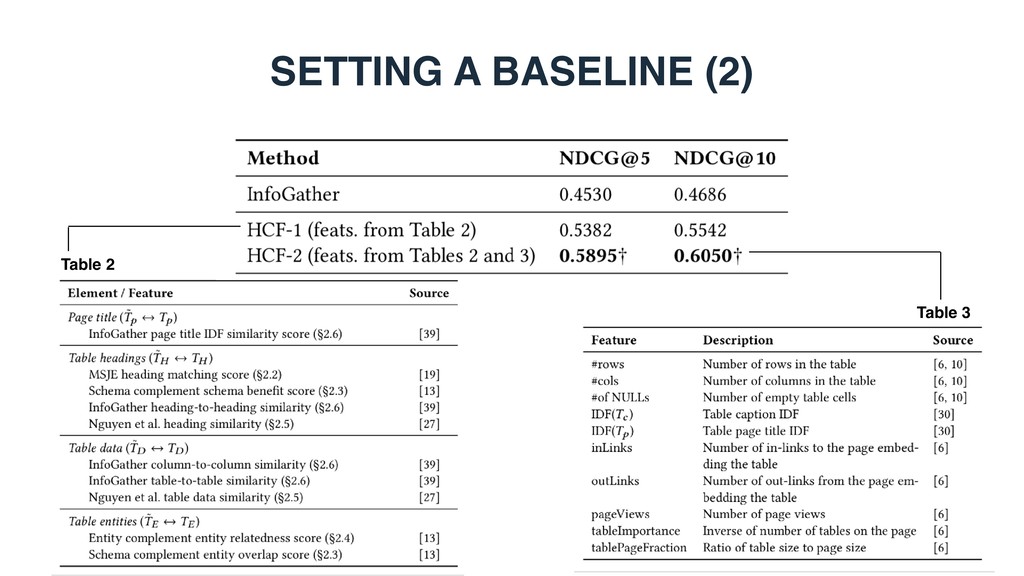
• #query terms, query IDF scores • Table features • Table properties: #rows, #cols, #empty cells, etc. • Embedding document: link structure, number of tables, etc. • Query-table features • Query terms found in different table elements, LM score, etc. • Our novel semantic matching features
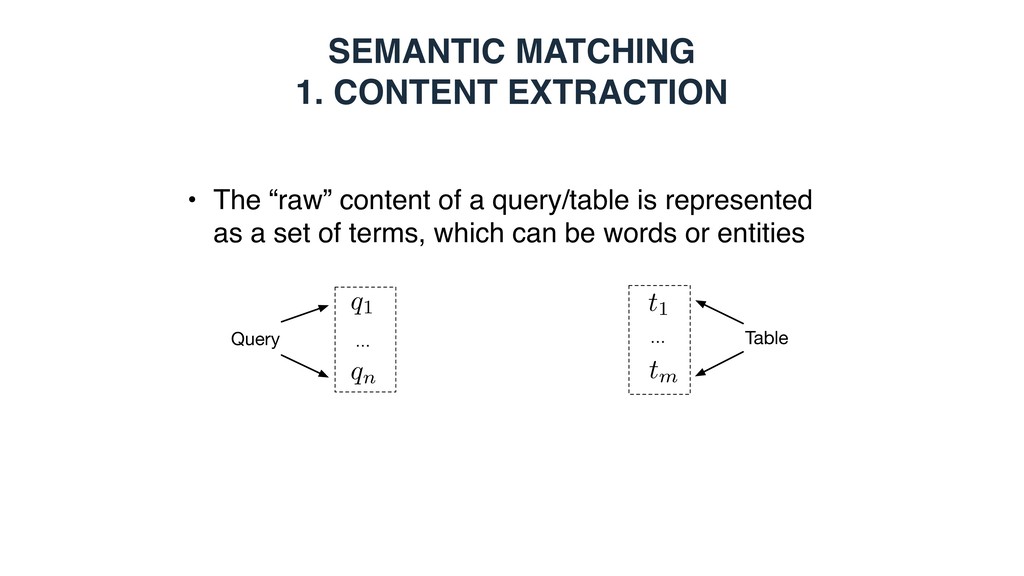
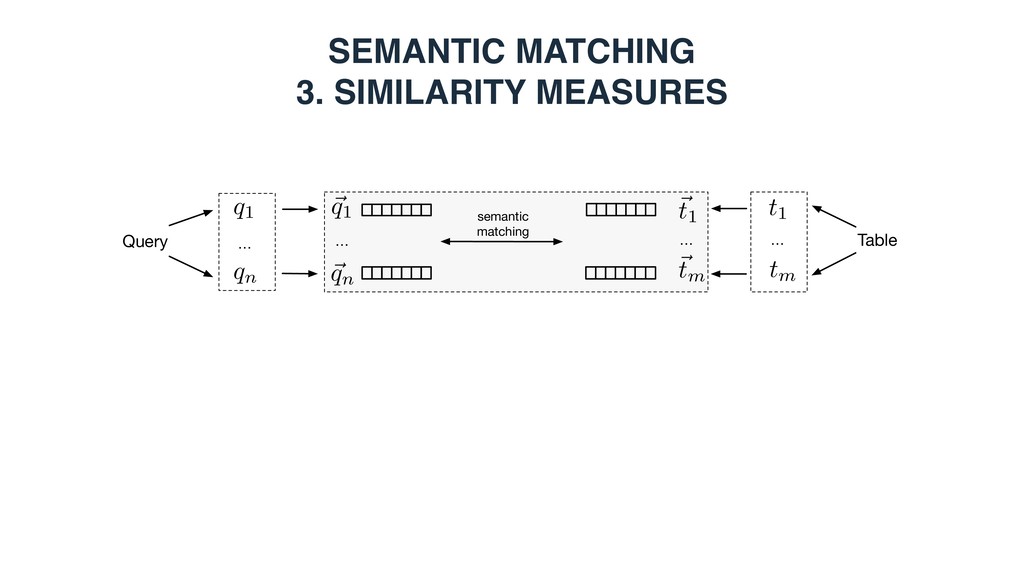
a query/table is represented as a set of terms, which can be words or entities Query … q1 qn … Table t1 tm Entity-based: - Top-k ranked entities from a knowledge base - Entities in the core table column - Top-k ranked entities using the embedding document/section title as a query
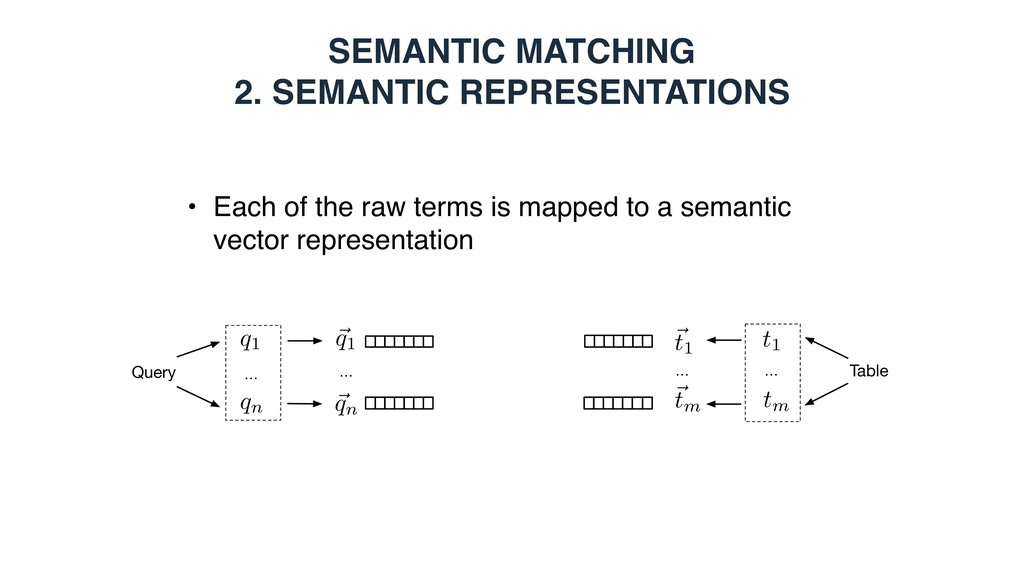
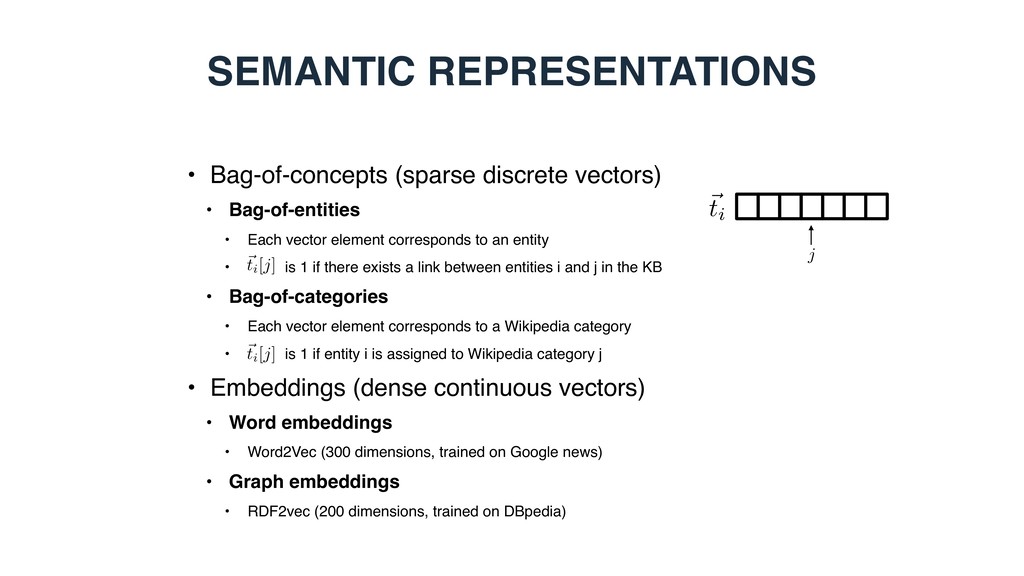
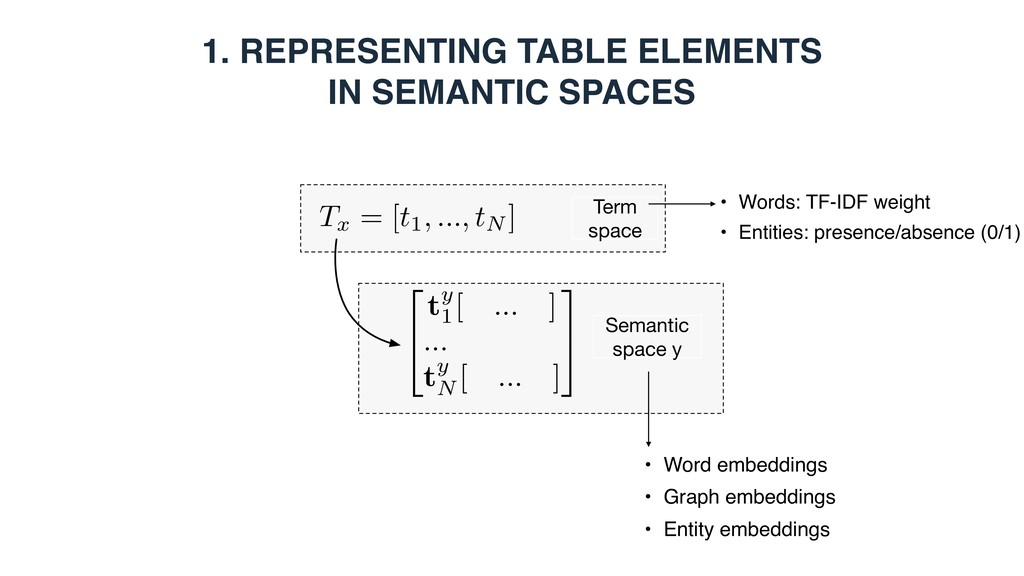
Each vector element corresponds to an entity • is 1 if there exists a link between entities i and j in the KB • Bag-of-categories • Each vector element corresponds to a Wikipedia category • is 1 if entity i is assigned to Wikipedia category j • Embeddings (dense continuous vectors) • Word embeddings • Word2Vec (300 dimensions, trained on Google news) • Graph embeddings • RDF2vec (200 dimensions, trained on DBpedia) ~ ti ~ ti[j] ~ ti[j] j
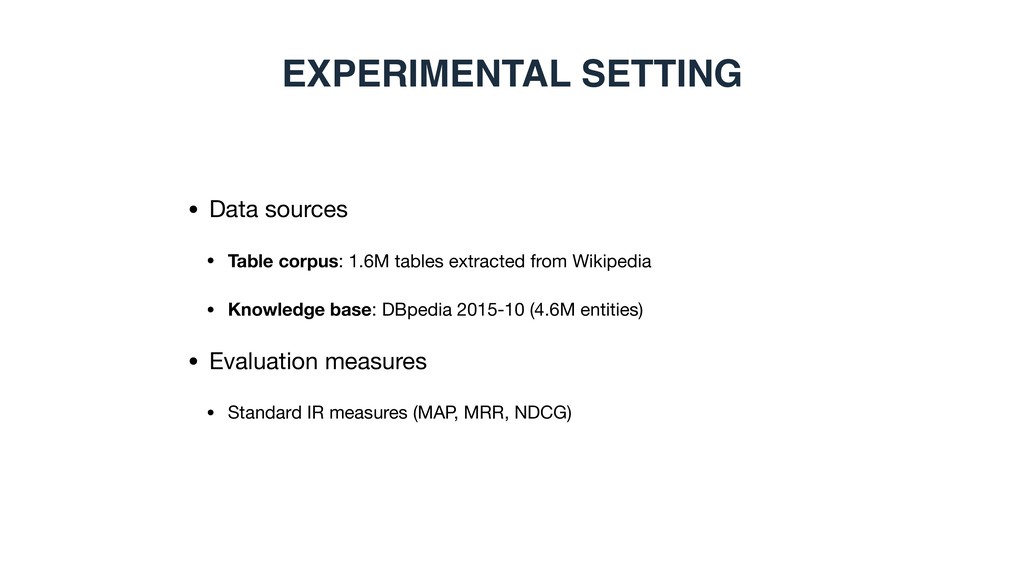
extracted from Wikipedia • Knowledge base • DBpedia (2015-10): 4.6M entities with an English abstract • Queries • Sampled from two sources2,3 • Rank-based evaluation • NDCG@5, 10, 15, 20 1 Bhagavatula et al. TabEL: Entity Linking in Web Tables. In: ISWC ’15. 2 Cafarella et al. Data Integration for the Relational Web. Proc. of VLDB Endow. (2009) 3 Venetis et al. Recovering Semantics of Tables on the Web. Proc. of VLDB Endow. (2011) QS-1 QS-2 video games asian countries currency us cities laptops cpu kings of africa food calories economy gdp guitars manufacturer
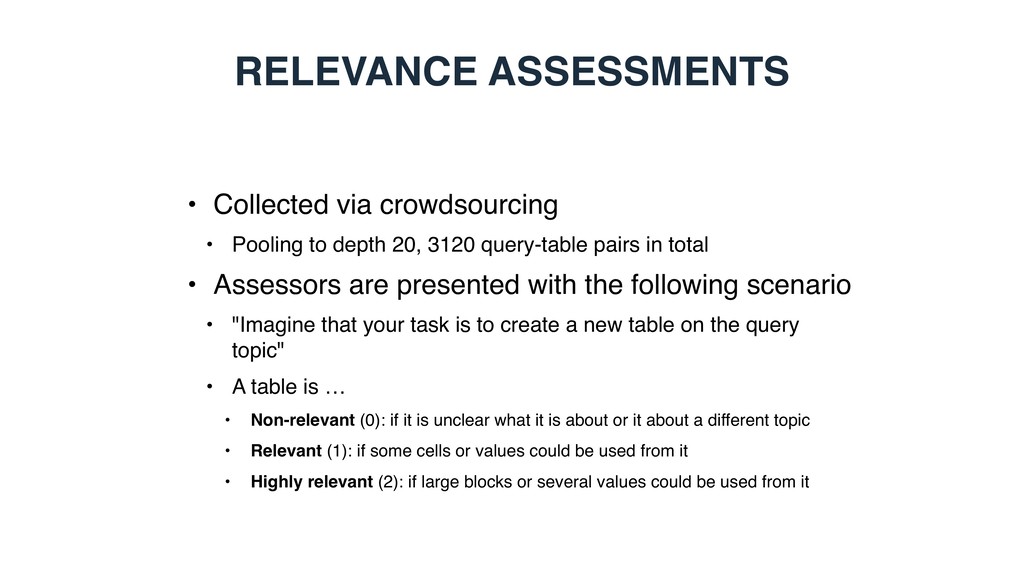
20, 3120 query-table pairs in total • Assessors are presented with the following scenario • "Imagine that your task is to create a new table on the query topic" • A table is … • Non-relevant (0): if it is unclear what it is about or it about a different topic • Relevant (1): if some cells or values could be used from it • Highly relevant (2): if large blocks or several values could be used from it
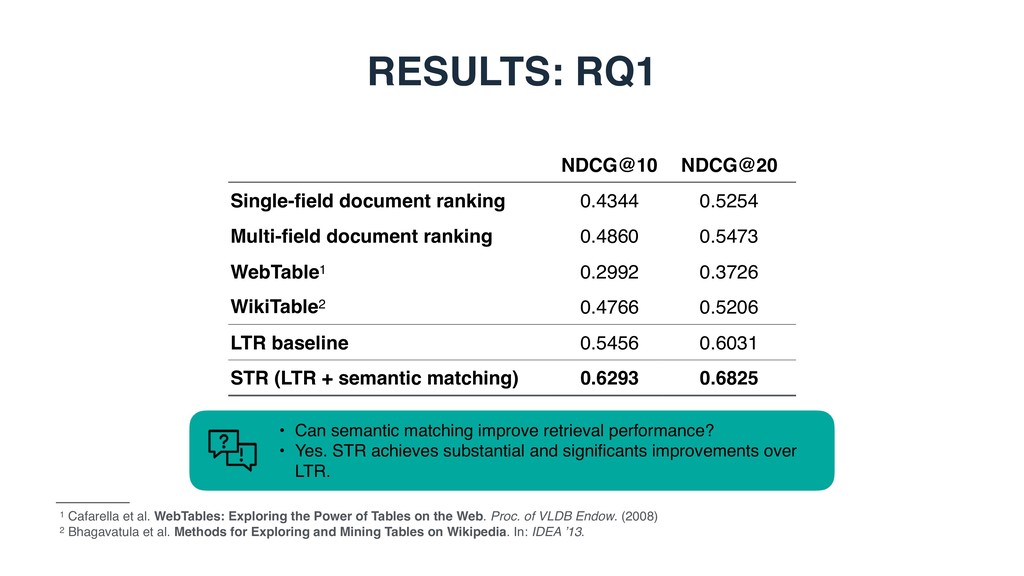
document ranking 0.4860 0.5473 WebTable1 0.2992 0.3726 WikiTable2 0.4766 0.5206 LTR baseline 0.5456 0.6031 STR (LTR + semantic matching) 0.6293 0.6825 1 Cafarella et al. WebTables: Exploring the Power of Tables on the Web. Proc. of VLDB Endow. (2008) 2 Bhagavatula et al. Methods for Exploring and Mining Tables on Wikipedia. In: IDEA ’13. • Can semantic matching improve retrieval performance? • Yes. STR achieves substantial and significants improvements over LTR.
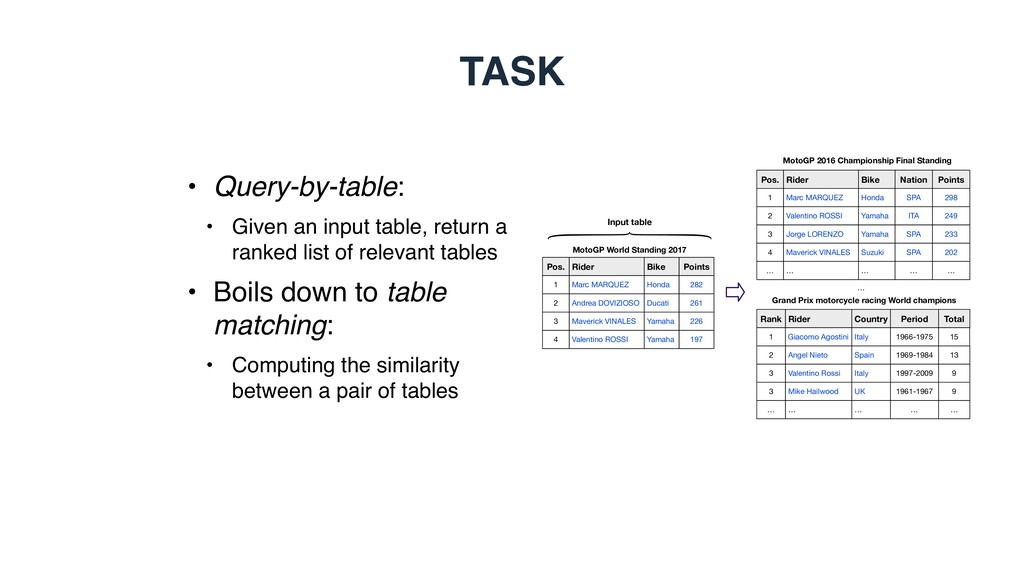
Pos. 1 2 3 4 MotoGP World Standing 2017 Input table Bike Honda Ducati Yamaha Yamaha Rider Giacomo Agostini Angel Nieto Valentino Rossi Mike Hailwood Rank 1 2 3 3 … … Grand Prix motorcycle racing World champions Country Italy Spain Italy UK … Points 282 261 226 197 Rider Marc MARQUEZ Valentino ROSSI Jorge LORENZO Maverick VINALES Pos. 1 2 3 4 MotoGP 2016 Championship Final Standing Bike Honda Yamaha Yamaha Suzuki Nation SPA ITA SPA SPA … … … … Period 1966-1975 1969-1984 1997-2009 1961-1967 … Total 15 13 9 9 … … Points 298 249 233 202 … • Query-by-table: • Given an input table, return a ranked list of relevant tables • Boils down to table matching: • Computing the similarity between a pair of tables
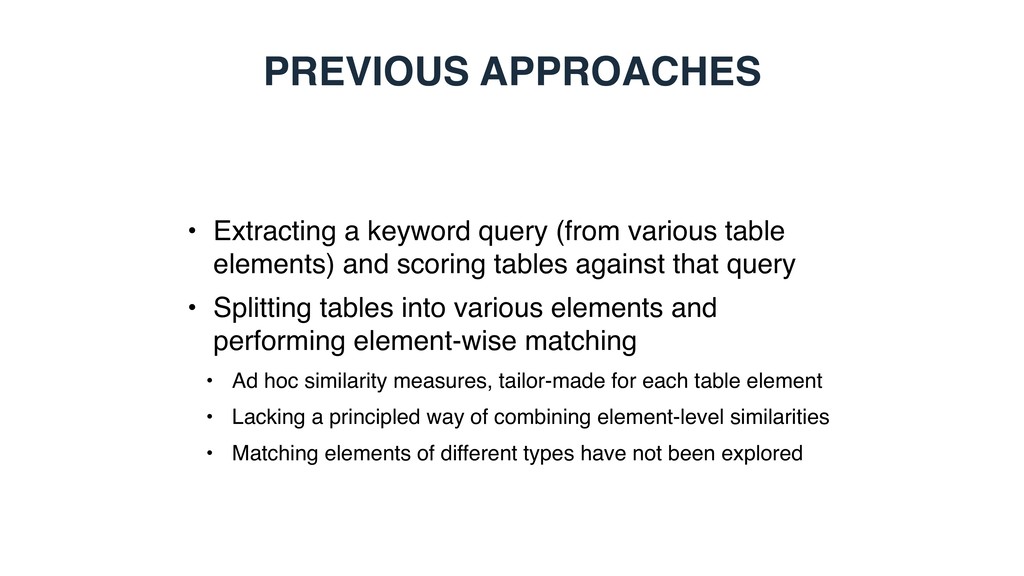
elements) and scoring tables against that query • Splitting tables into various elements and performing element-wise matching • Ad hoc similarity measures, tailor-made for each table element • Lacking a principled way of combining element-level similarities • Matching elements of different types have not been explored
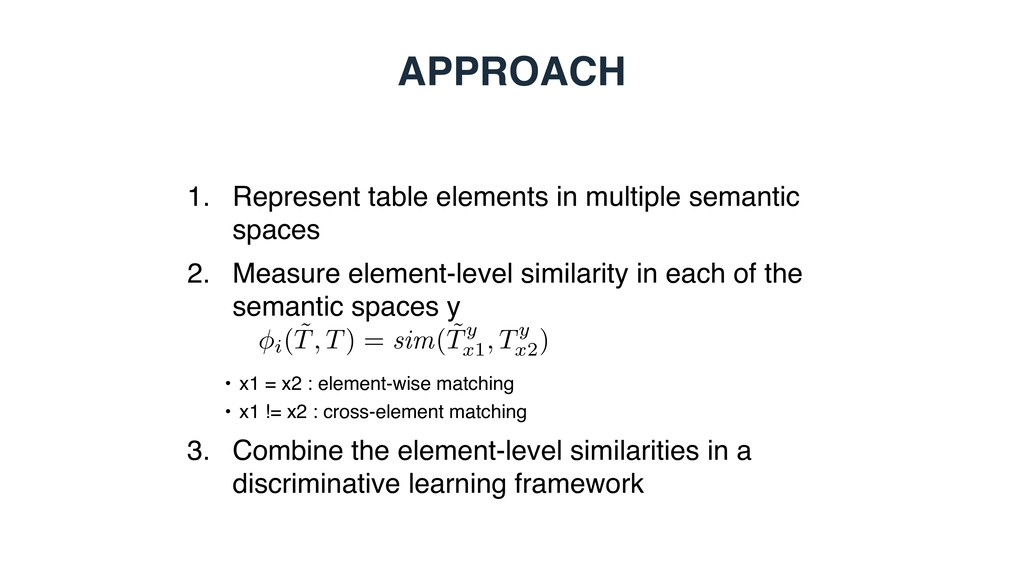
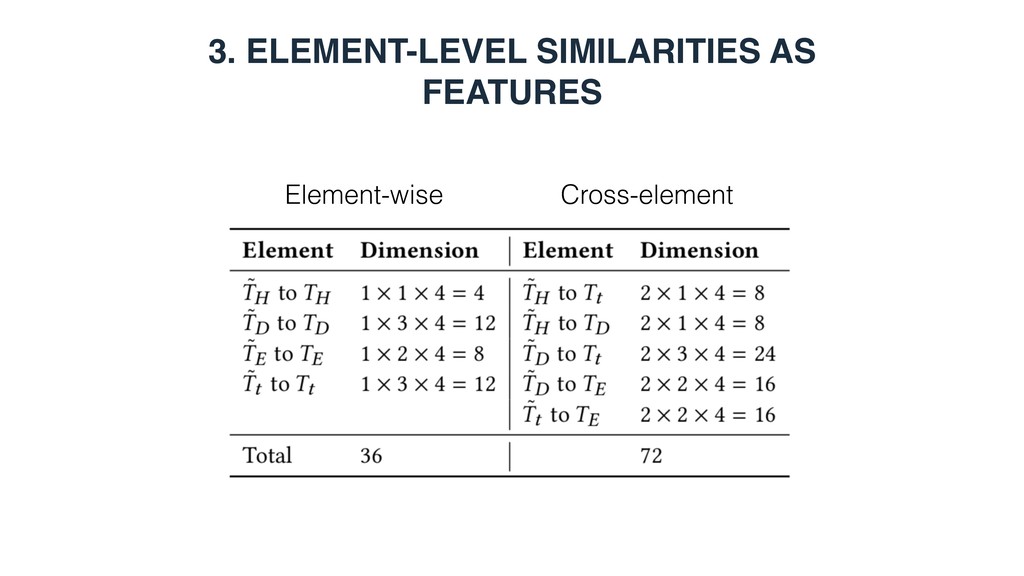
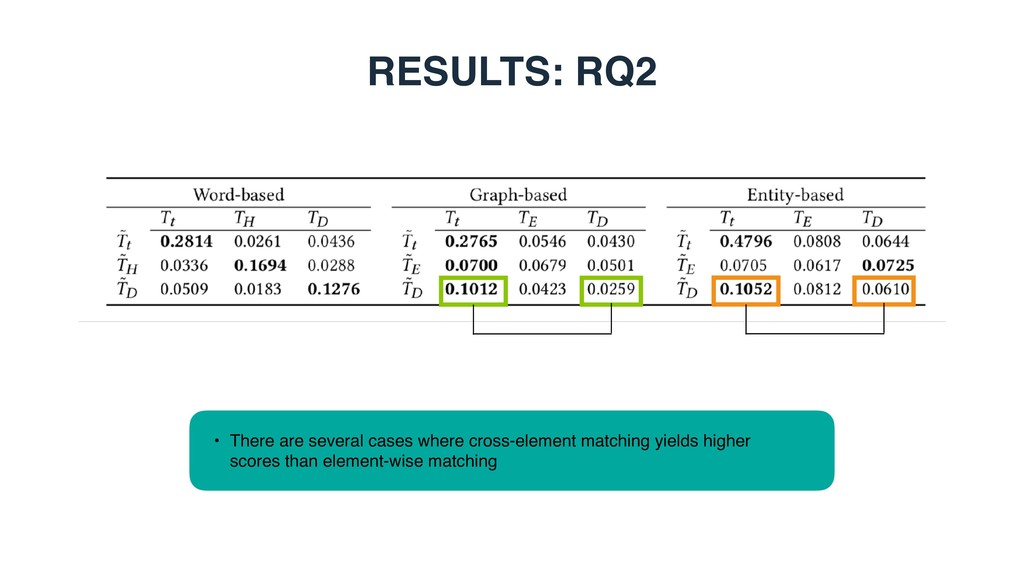
Measure element-level similarity in each of the semantic spaces y • x1 = x2 : element-wise matching • x1 != x2 : cross-element matching 3. Combine the element-level similarities in a discriminative learning framework i( ˜ T, T) = sim( ˜ Ty x1 , Ty x2 )
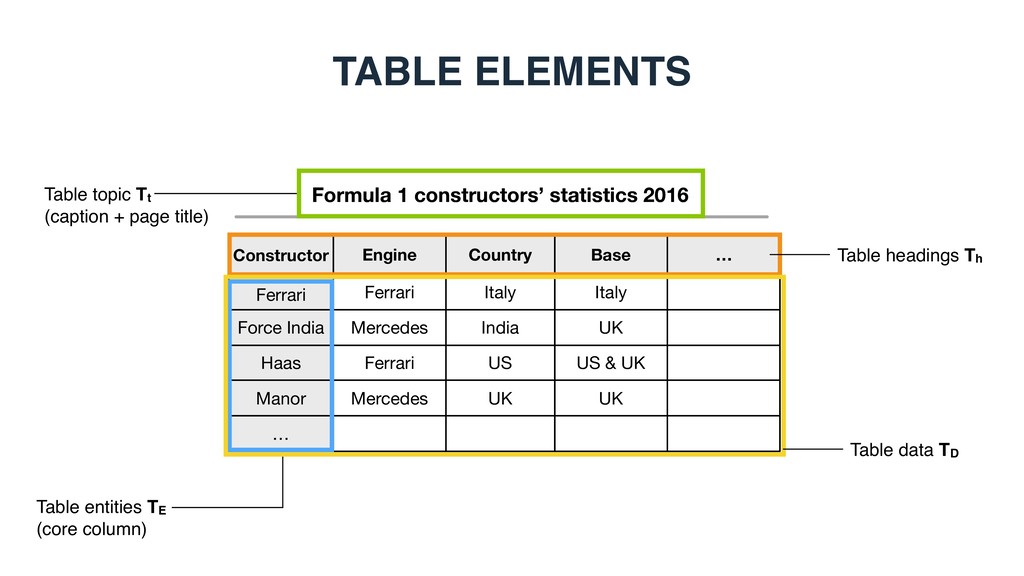
Country Base Force India Haas Ferrari Mercedes Ferrari Italy India US Italy UK US & UK Manor Mercedes UK UK … … Formula 1 constructors’ statistics 2016 Constructor Ferrari Engine Country Base Force India Haas Ferrari Mercedes Ferrari Italy India US Italy UK US & UK Manor Mercedes UK UK … … Table topic Tt (caption + page title) Table entities TE (core column) Table headings Th Table data TD
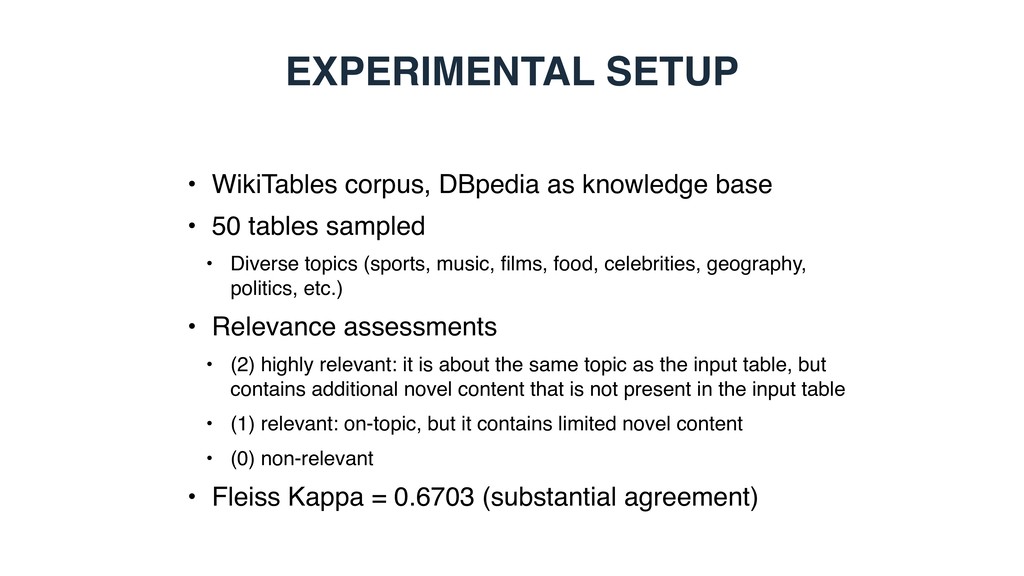
50 tables sampled • Diverse topics (sports, music, films, food, celebrities, geography, politics, etc.) • Relevance assessments • (2) highly relevant: it is about the same topic as the input table, but contains additional novel content that is not present in the input table • (1) relevant: on-topic, but it contains limited novel content • (0) non-relevant • Fleiss Kappa = 0.6703 (substantial agreement)
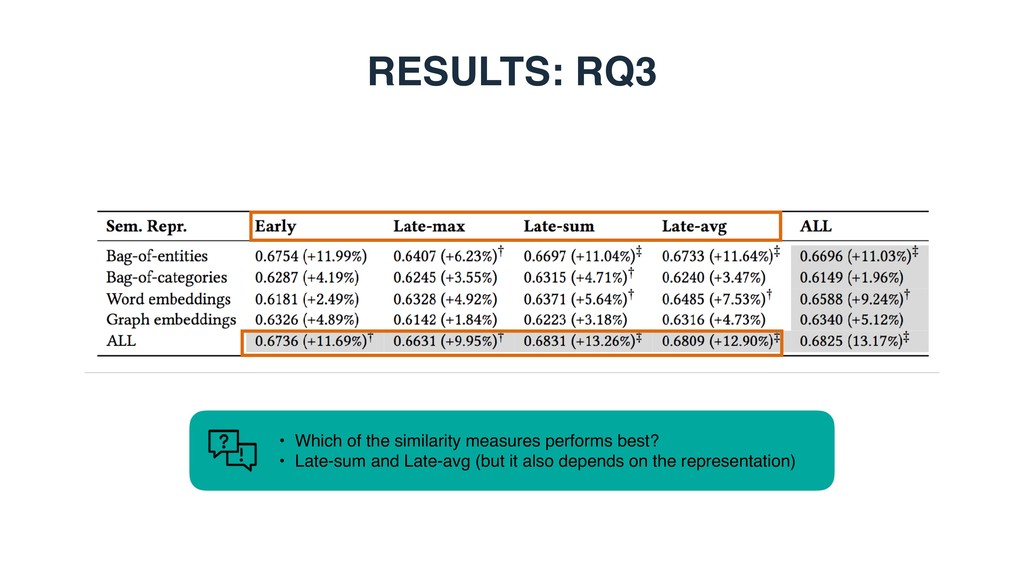
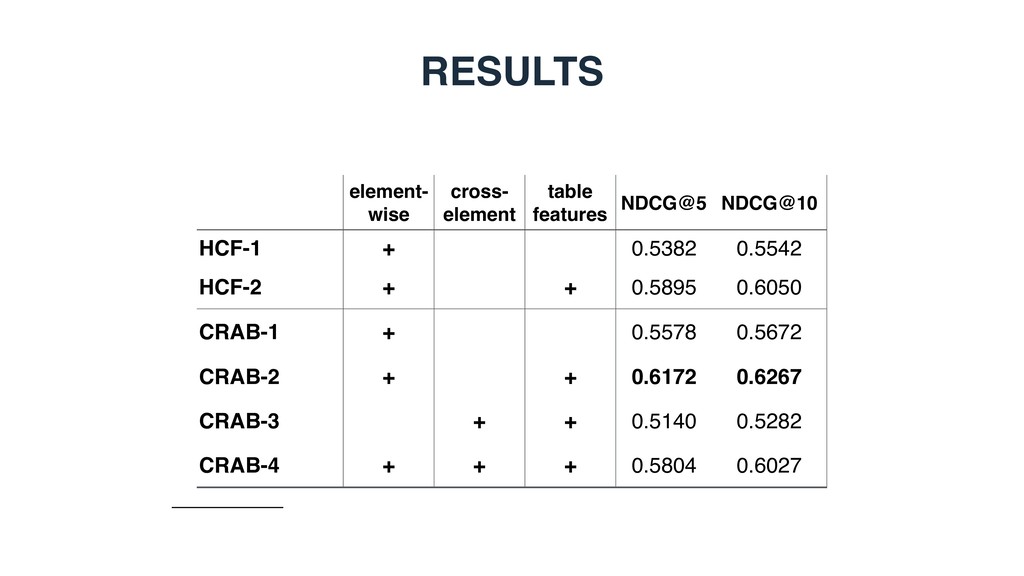
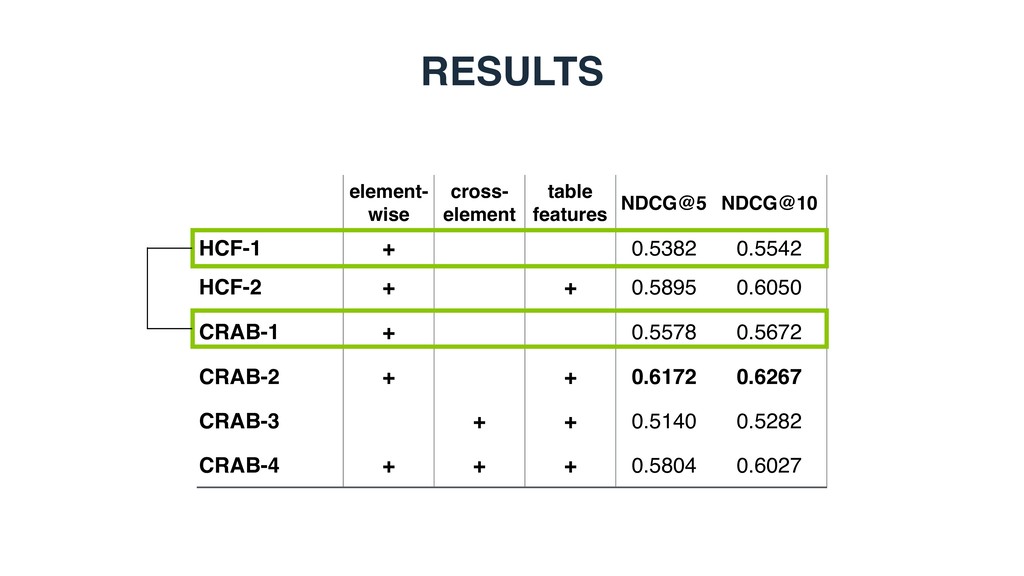
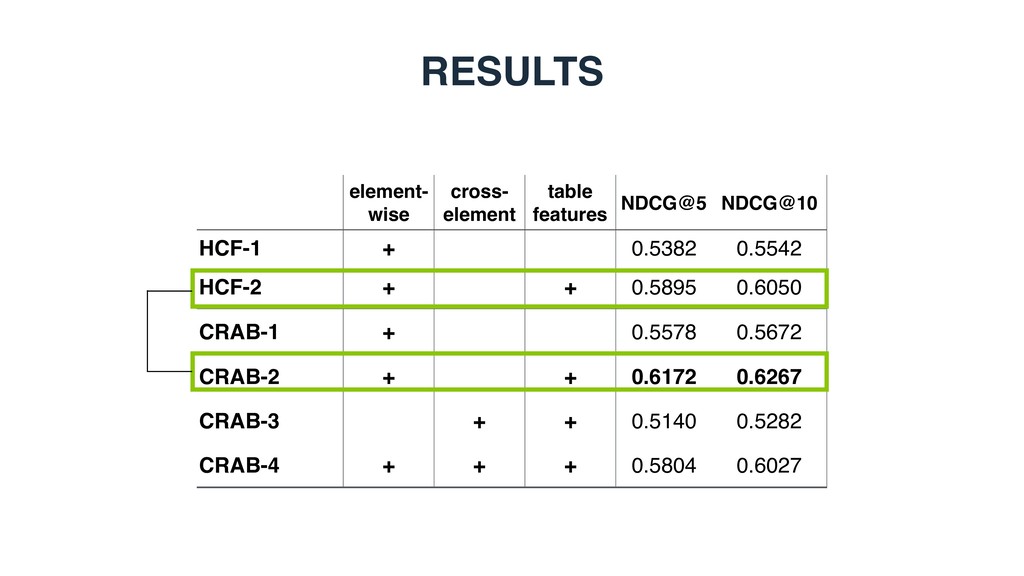
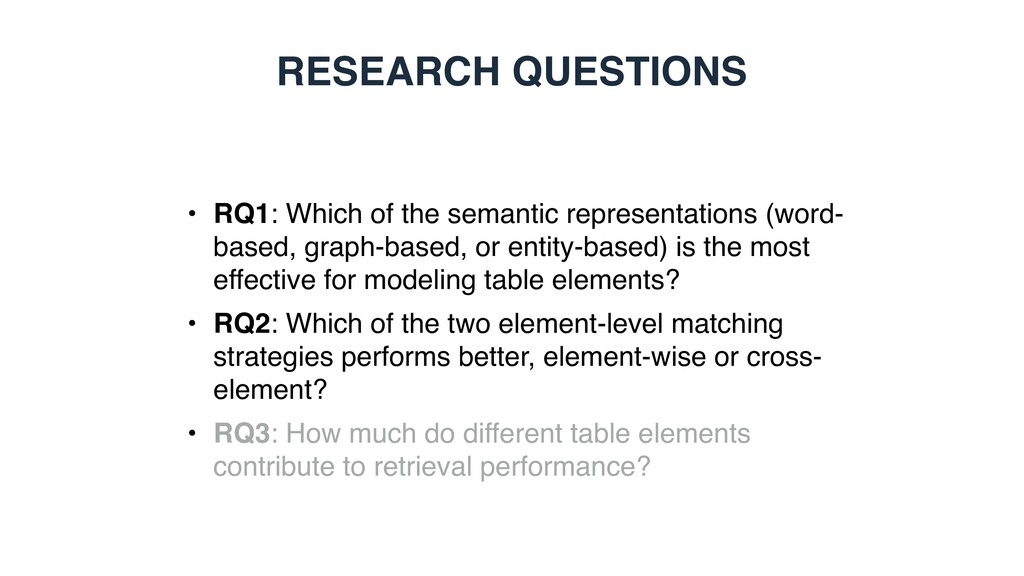
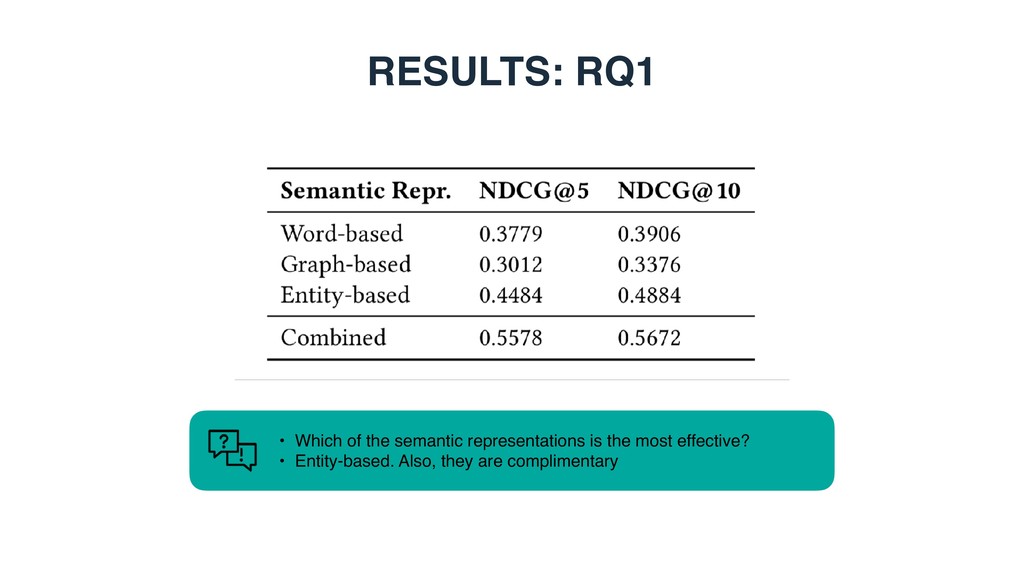
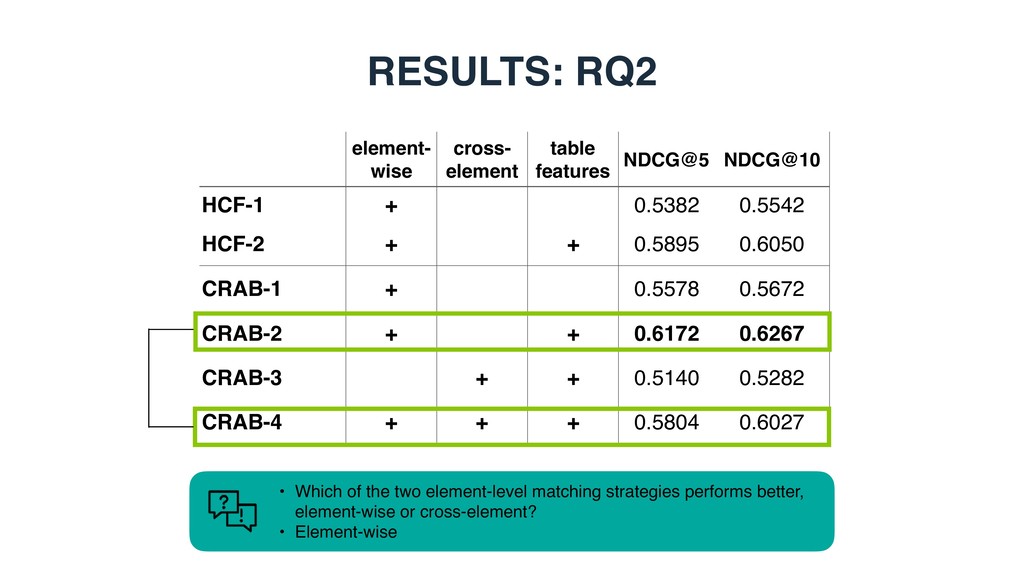
based, graph-based, or entity-based) is the most effective for modeling table elements? • RQ2: Which of the two element-level matching strategies performs better, element-wise or cross- element? • RQ3: How much do different table elements contribute to retrieval performance?
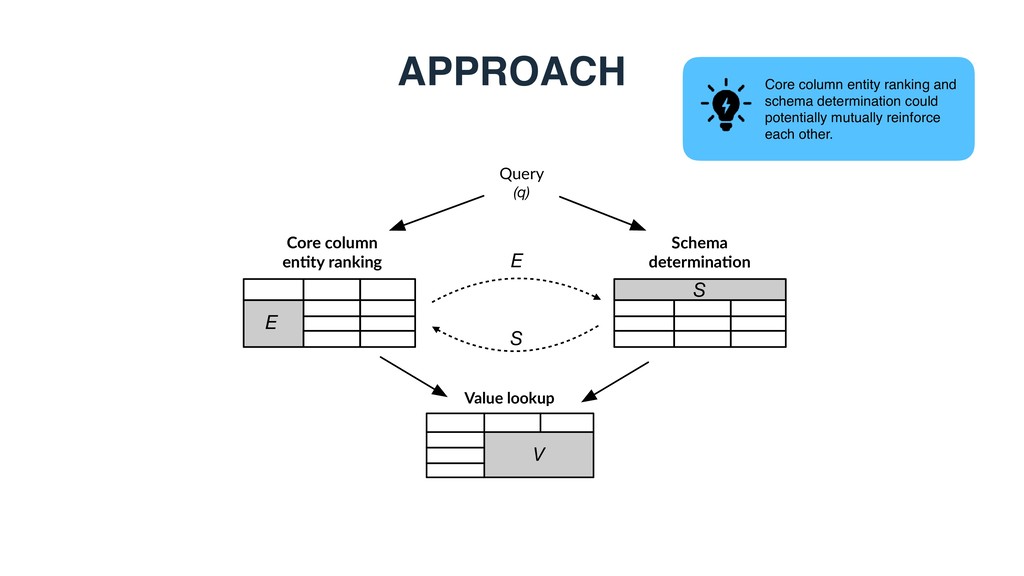
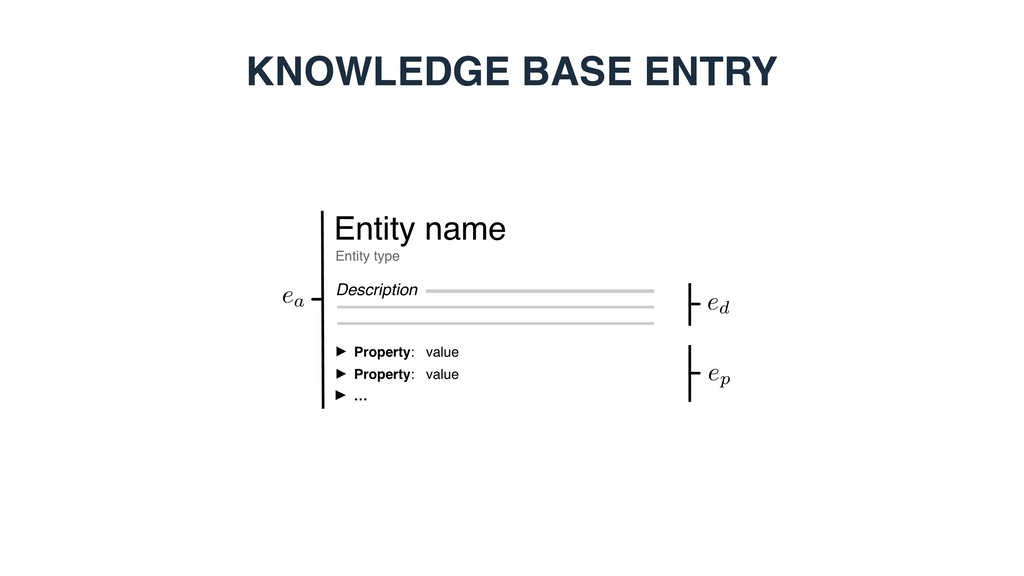
query with a relational table, where • the core column lists all relevant entities; • columns correspond to attributes of those entities; • cells contain the values of the corresponding entity attributes. Video albums of Taylor Swift Search Title Released data Label CMT Crossroads: Taylor Swift and … Formats Journey to Fearless Speak Now World Tour-Live The 1989 World Tour Live Jun 16, 2009 Oct 11, 2011 Nov 21, 2011 Dec 20, 2015 Big Machine Shout! Factory Big Machine Big Machine DVD Blu-ray, DVD CD/Blu-ray, … Streaming E V S
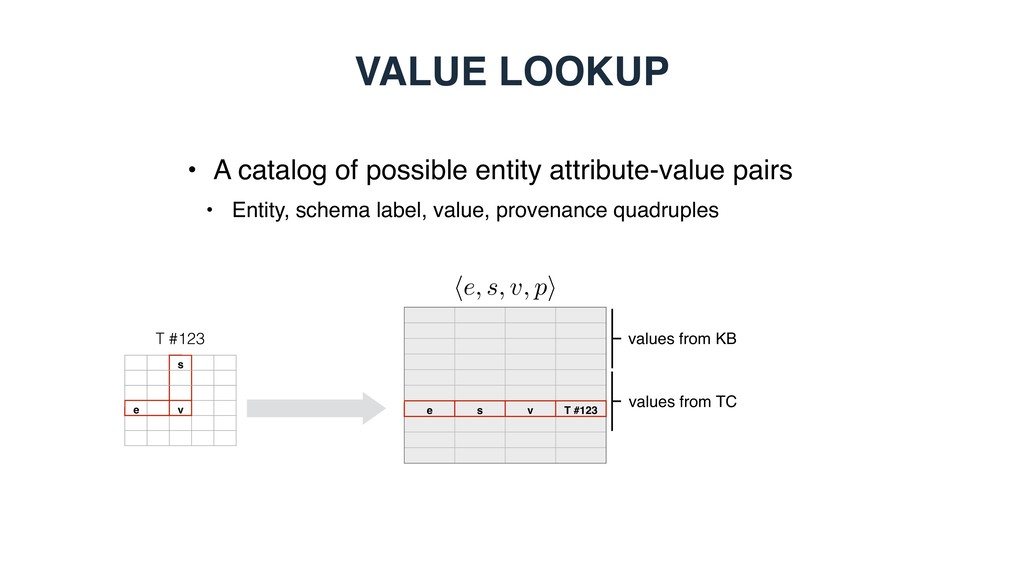
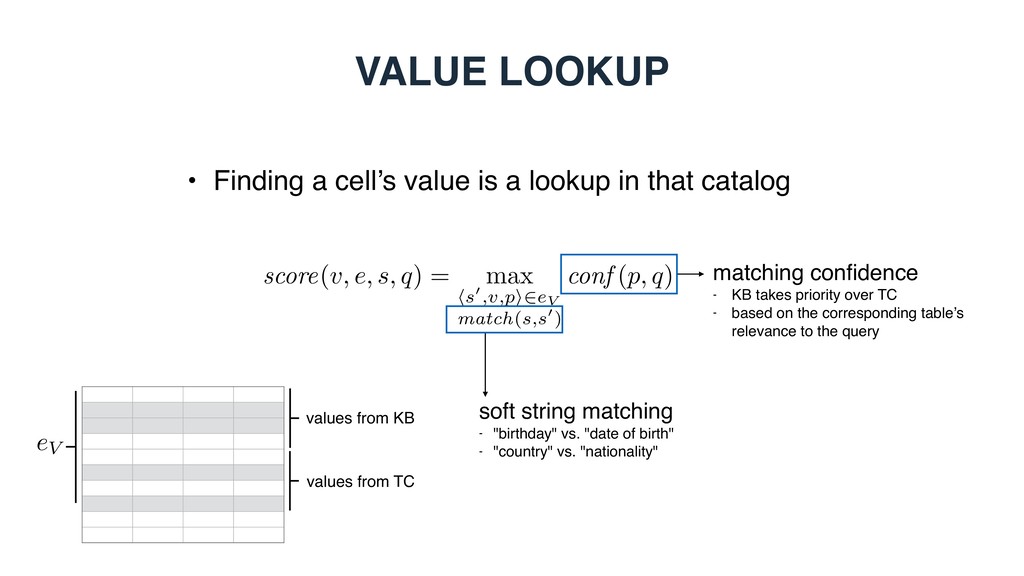
in that catalog score(v, e, s, q) = max hs0,v,pi2eV match(s,s0) conf (p, q) eV values from KB values from TC soft string matching - "birthday" vs. "date of birth" - "country" vs. "nationality" matching confidence - KB takes priority over TC - based on the corresponding table’s relevance to the query
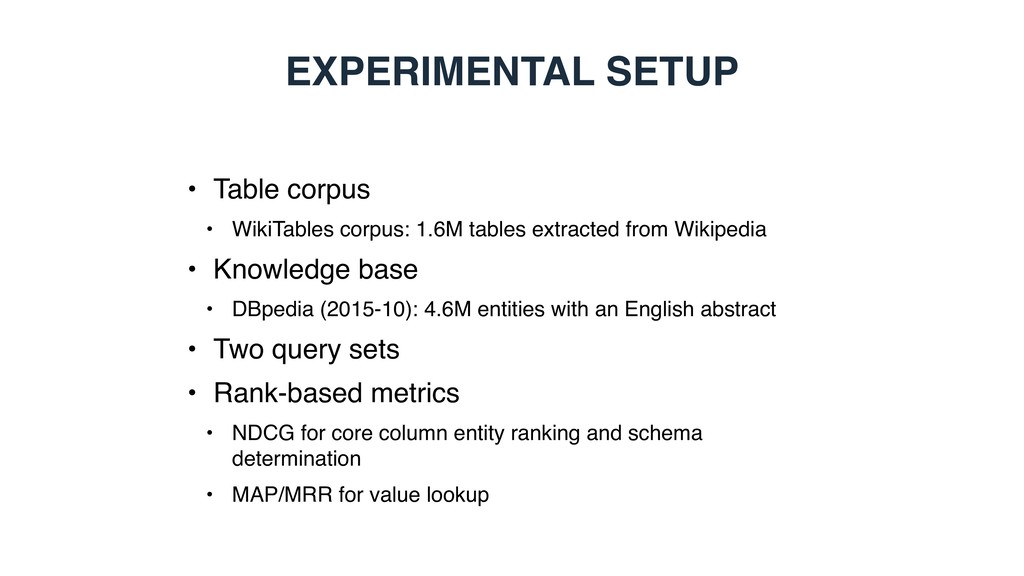
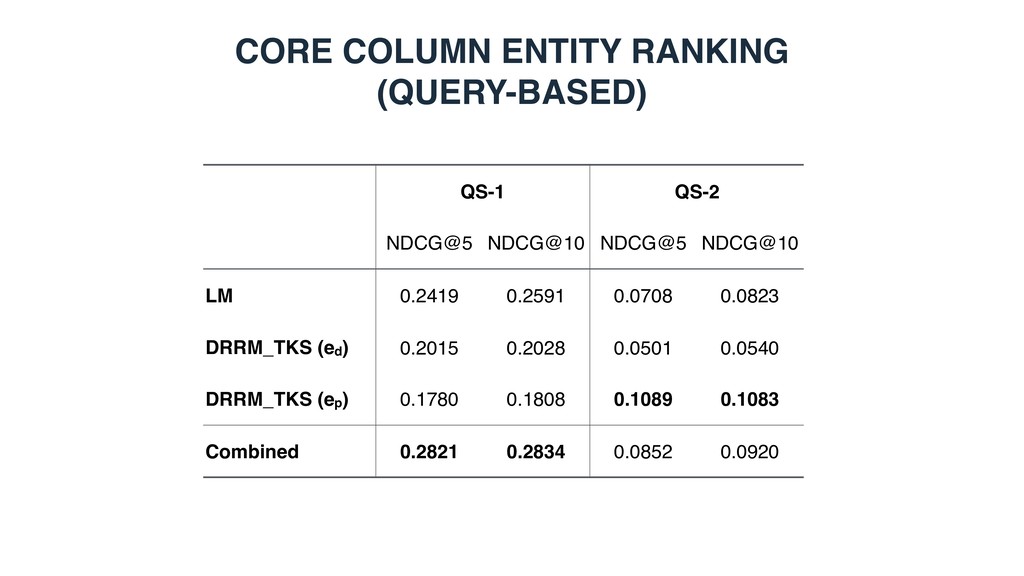
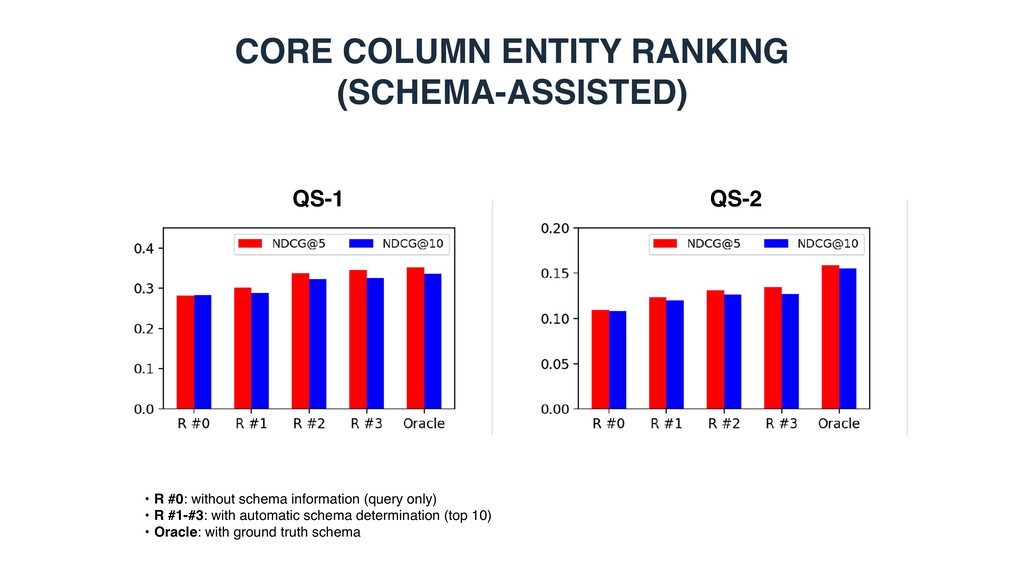
extracted from Wikipedia • Knowledge base • DBpedia (2015-10): 4.6M entities with an English abstract • Two query sets • Rank-based metrics • NDCG for core column entity ranking and schema determination • MAP/MRR for value lookup
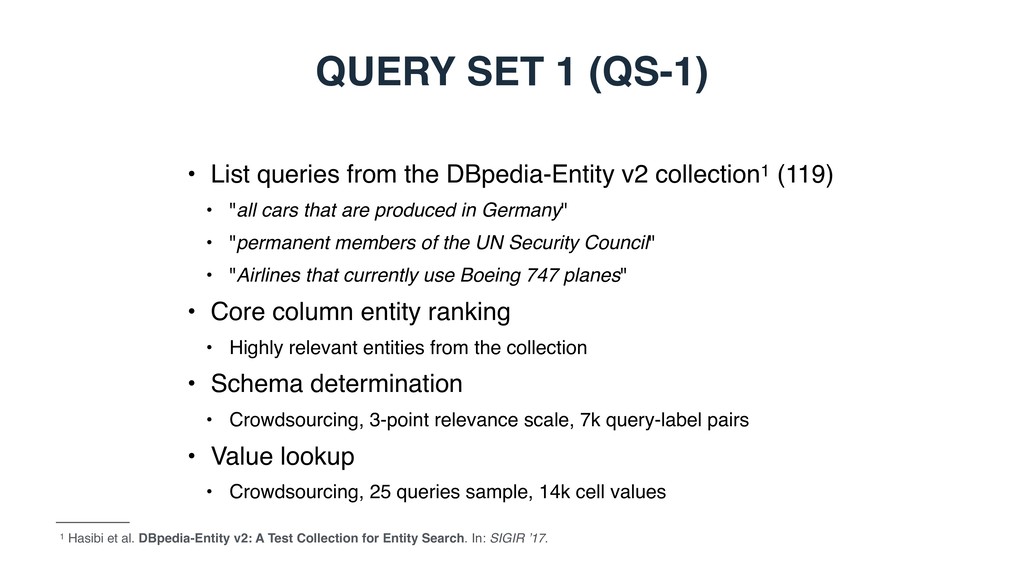
v2 collection1 (119) • "all cars that are produced in Germany" • "permanent members of the UN Security Council" • "Airlines that currently use Boeing 747 planes" • Core column entity ranking • Highly relevant entities from the collection • Schema determination • Crowdsourcing, 3-point relevance scale, 7k query-label pairs • Value lookup • Crowdsourcing, 25 queries sample, 14k cell values 1 Hasibi et al. DBpedia-Entity v2: A Test Collection for Entity Search. In: SIGIR ’17.
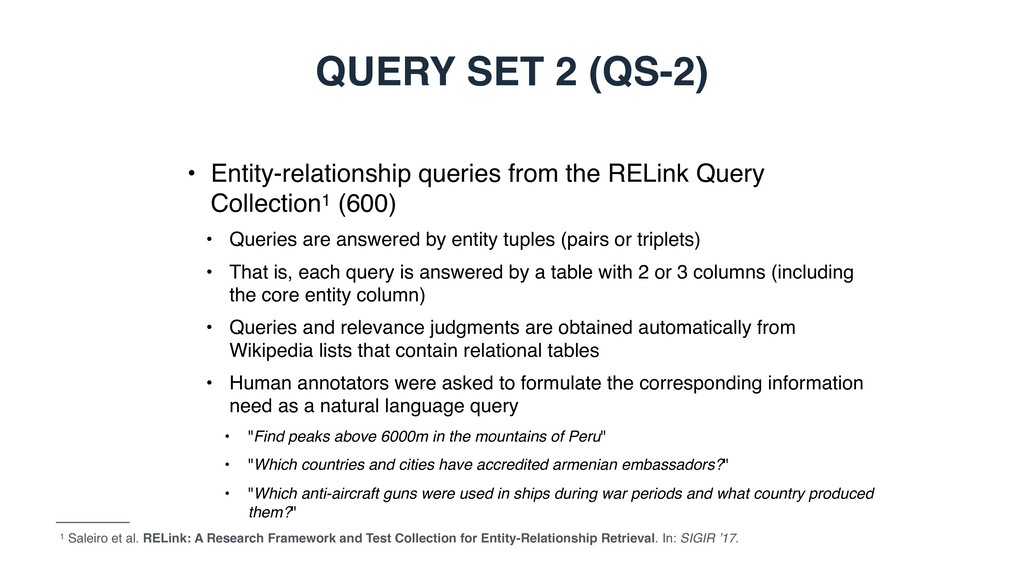
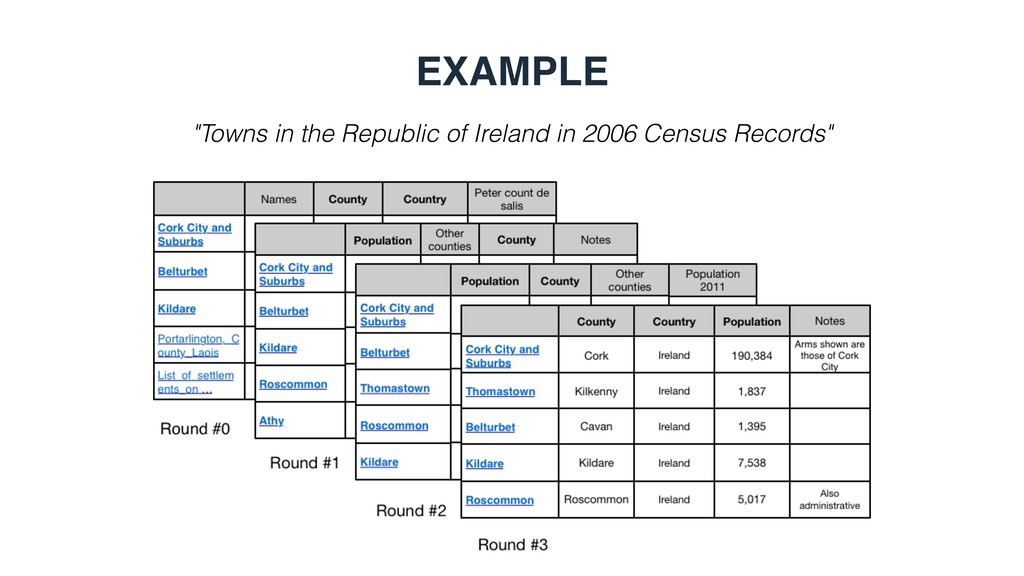
Query Collection1 (600) • Queries are answered by entity tuples (pairs or triplets) • That is, each query is answered by a table with 2 or 3 columns (including the core entity column) • Queries and relevance judgments are obtained automatically from Wikipedia lists that contain relational tables • Human annotators were asked to formulate the corresponding information need as a natural language query • "Find peaks above 6000m in the mountains of Peru" • "Which countries and cities have accredited armenian embassadors?" • "Which anti-aircraft guns were used in ships during war periods and what country produced them?" 1 Saleiro et al. RELink: A Research Framework and Test Collection for Entity-Relationship Retrieval. In: SIGIR ’17.
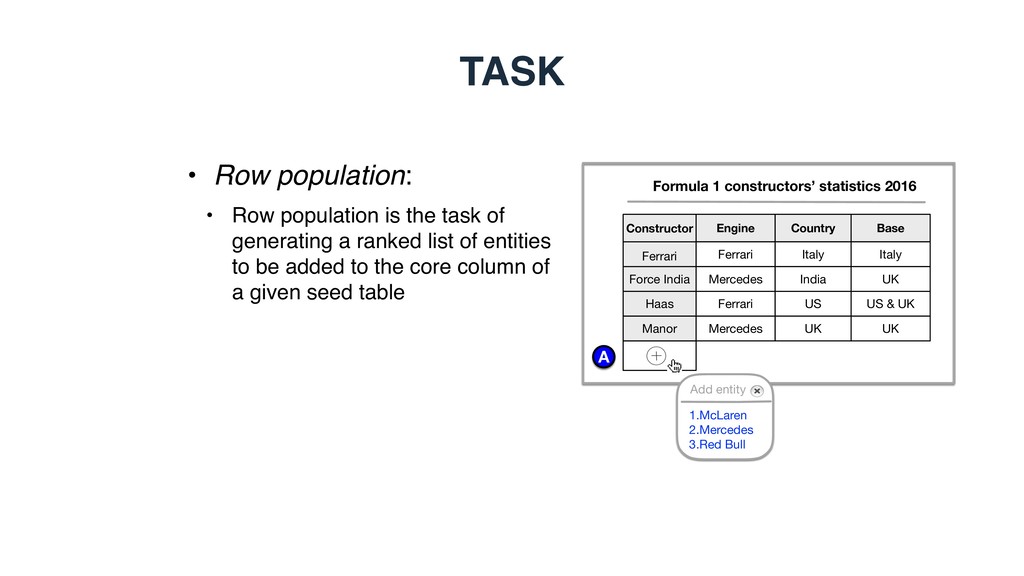
of generating a ranked list of entities to be added to the core column of a given seed table A Formula 1 constructors’ statistics 2016 1.McLaren 2.Mercedes 3.Red Bull Add entity Constructor Ferrari Engine Country Base Force India Haas Ferrari Mercedes Ferrari Italy India US Italy UK US & UK Manor Mercedes UK UK
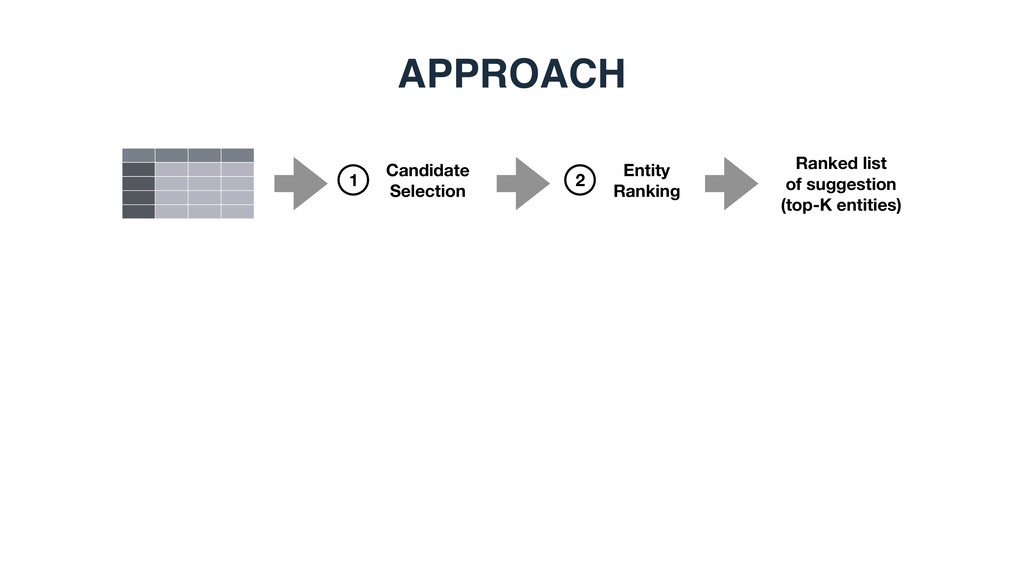
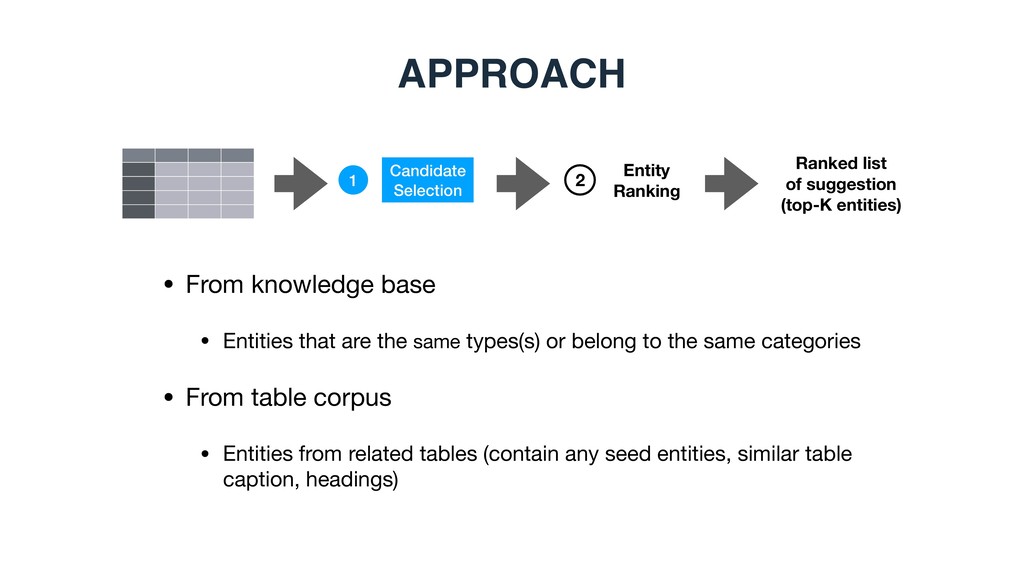
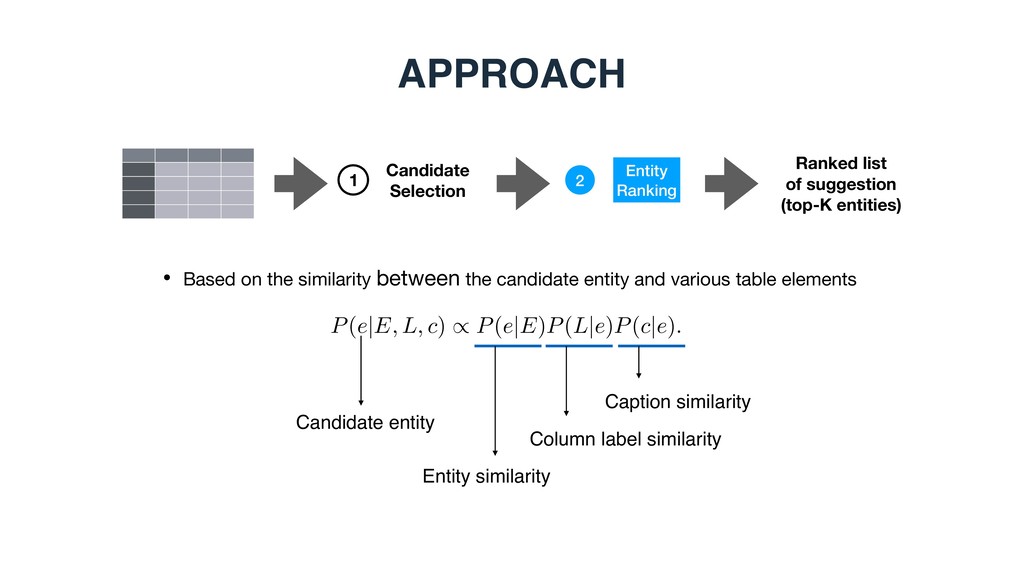
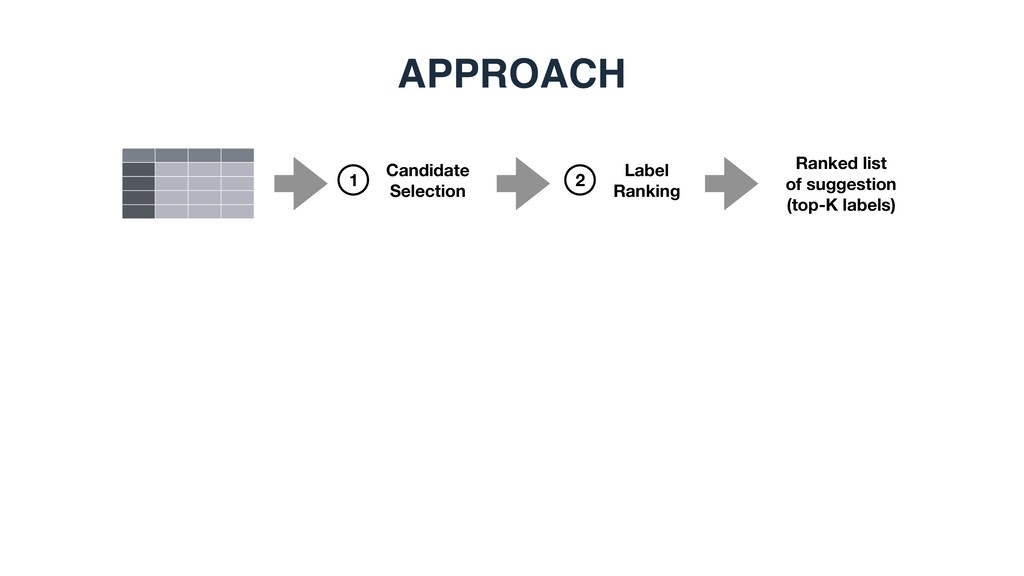
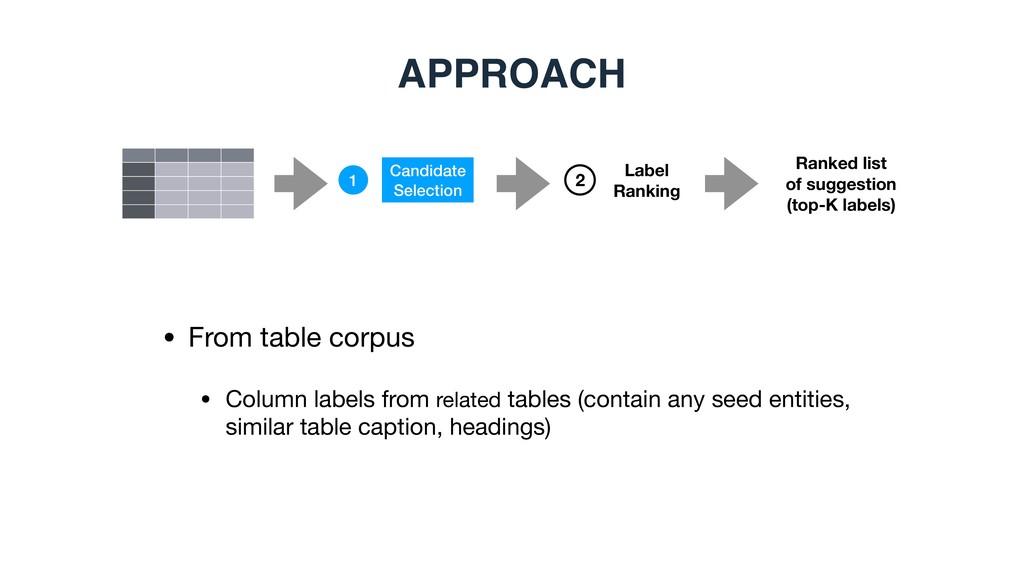
(top-K entities) 1 2 • From knowledge base • Entities that are the same types(s) or belong to the same categories • From table corpus • Entities from related tables (contain any seed entities, similar table caption, headings)
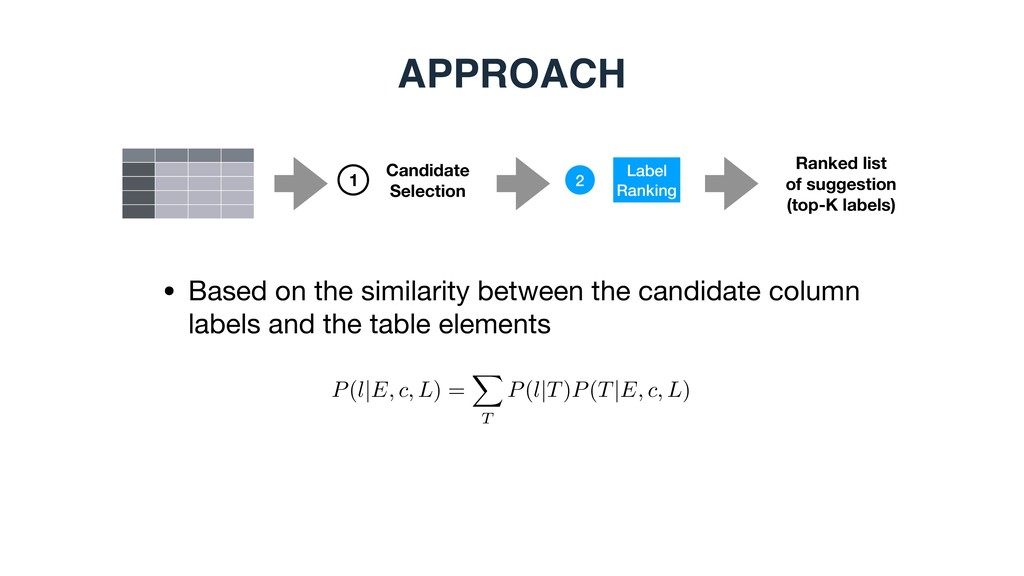
2 • Based on the similarity between the candidate entity and various table elements 1 Candidate Selection P(e|E, L, c) / P(e|E)P(L|e)P(c|e). Entity similarity Column label similarity Caption similarity Candidate entity
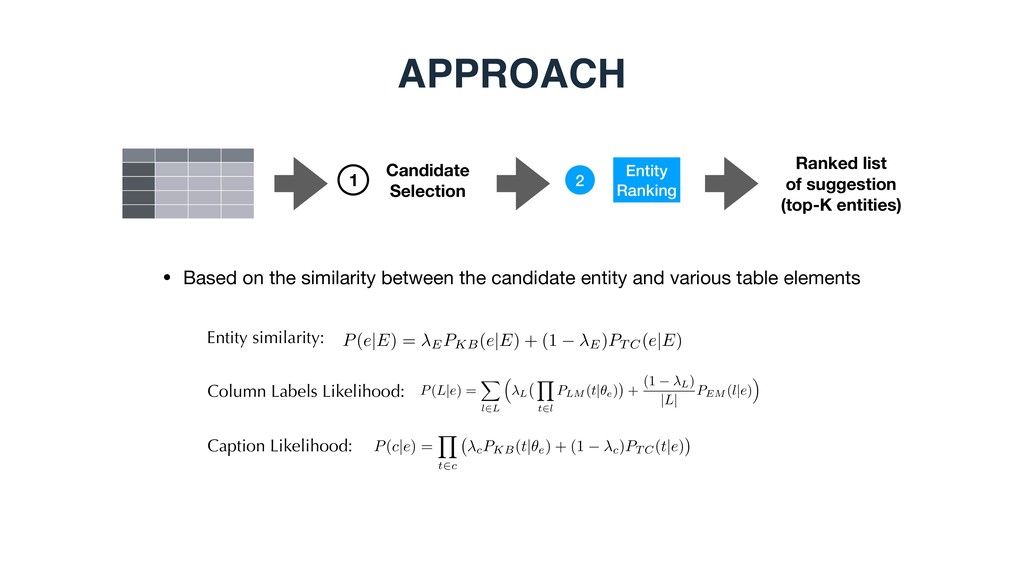
2 • Based on the similarity between the candidate entity and various table elements 1 Candidate Selection P(e|E) = EPKB(e|E) + (1 E)PT C(e|E) P(L|e) = X l2L ⇣ L Y t2l PLM (t|✓e) + (1 L) |L| PEM (l|e) ⌘ P(c|e) = Y t2c cPKB(t|✓e) + (1 c)PT C(t|e) Entity similarity: Column Labels Likelihood: Caption Likelihood:
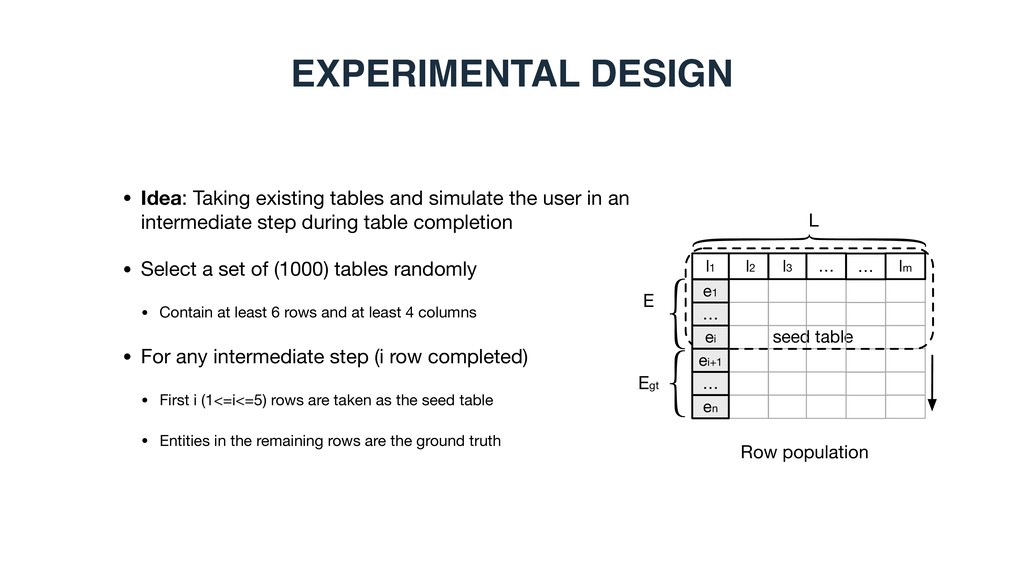
an intermediate step during table completion • Select a set of (1000) tables randomly • Contain at least 6 rows and at least 4 columns • For any intermediate step (i row completed) • First i (1<=i<=5) rows are taken as the seed table • Entities in the remaining rows are the ground truth EXPERIMENTAL DESIGN Row population E Egt L seed table l1 e1 l2 l3 … … ei ei+1 … en … lm
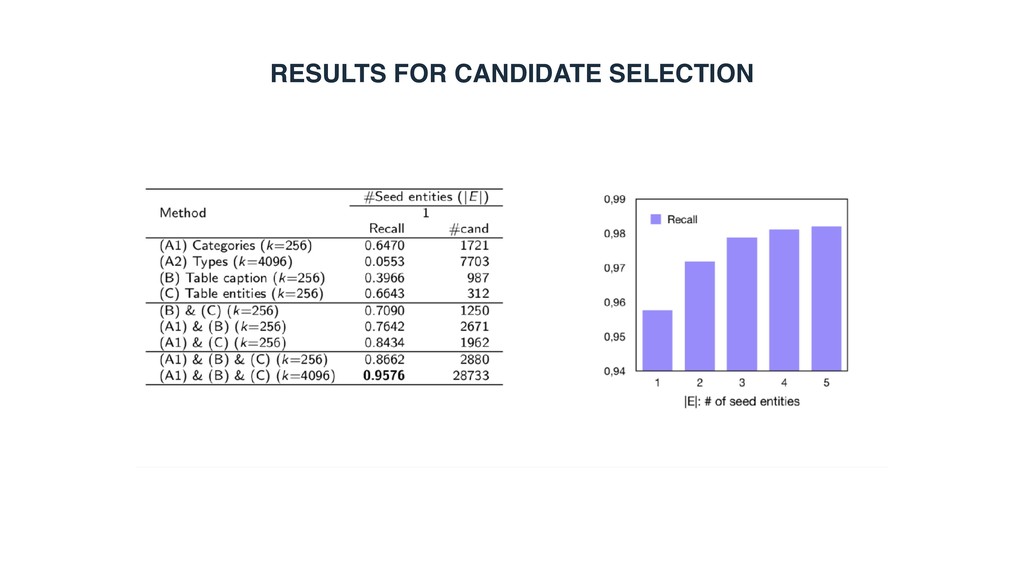
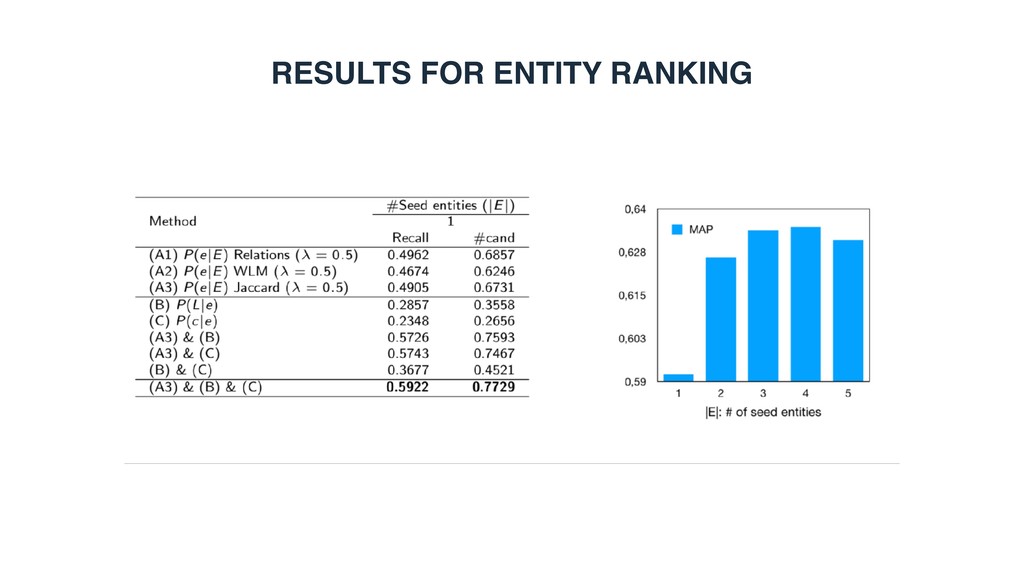
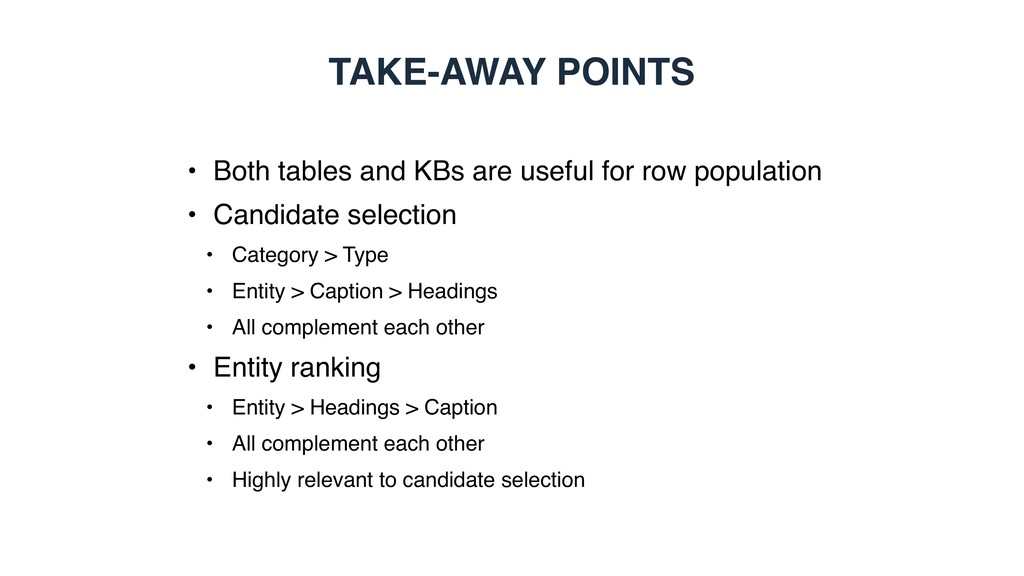
row population • Candidate selection • Category > Type • Entity > Caption > Headings • All complement each other • Entity ranking • Entity > Headings > Caption • All complement each other • Highly relevant to candidate selection
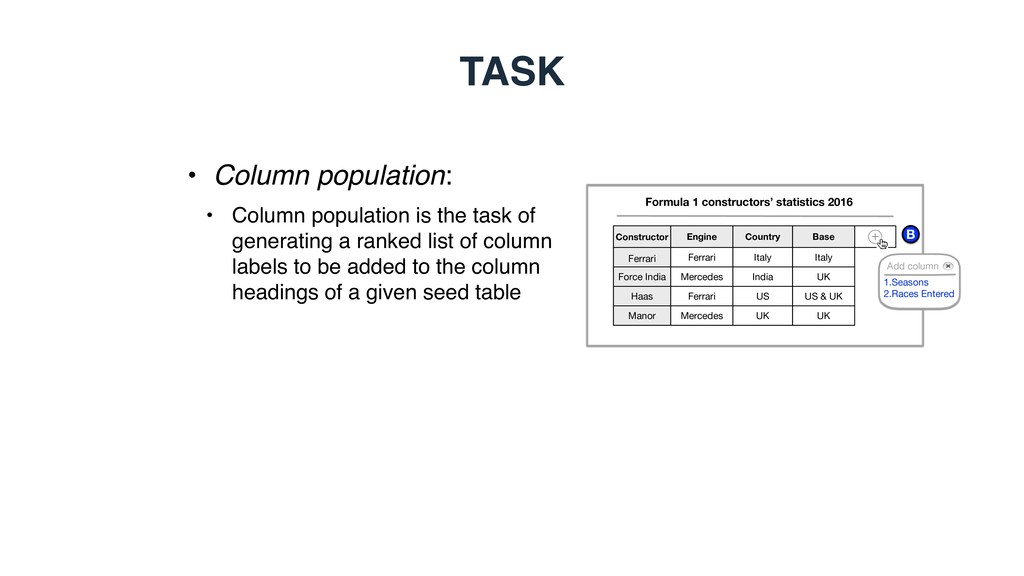
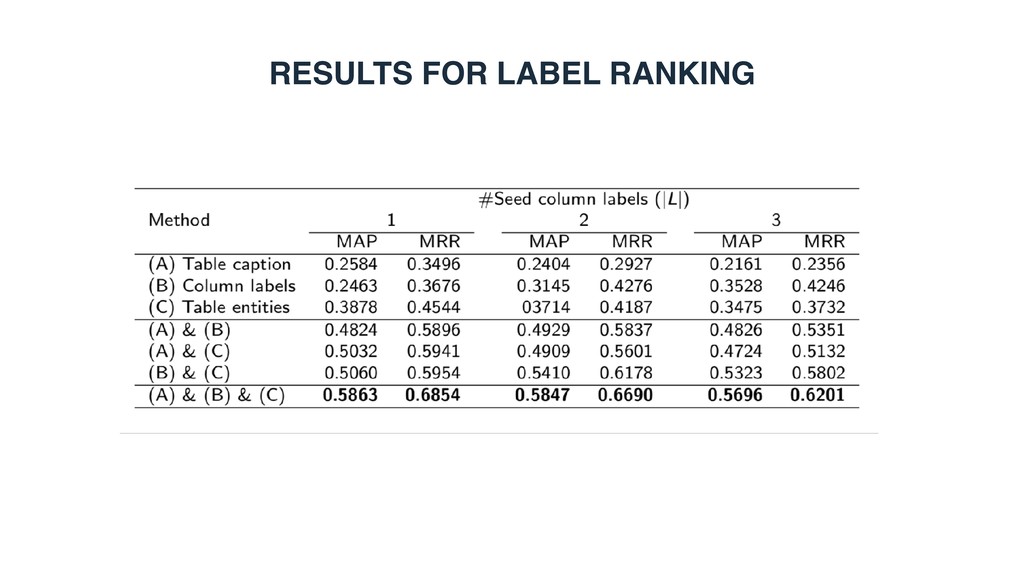
of generating a ranked list of column labels to be added to the column headings of a given seed table B Formula 1 constructors’ statistics 2016 Add column 1.Seasons 2.Races Entered Constructor Ferrari Engine Country Base Force India Haas Ferrari Mercedes Ferrari Italy India US Italy UK US & UK Manor Mercedes UK UK
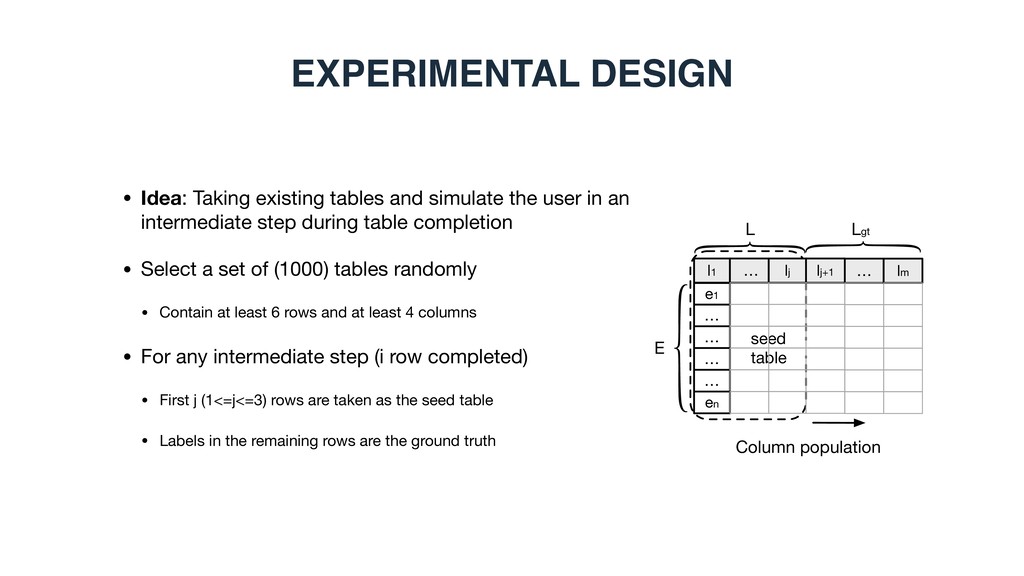
an intermediate step during table completion • Select a set of (1000) tables randomly • Contain at least 6 rows and at least 4 columns • For any intermediate step (i row completed) • First j (1<=j<=3) rows are taken as the seed table • Labels in the remaining rows are the ground truth EXPERIMENTAL DESIGN Column population E L seed table l1 e1 … lj lj+1 … … … … en … lm Lgt
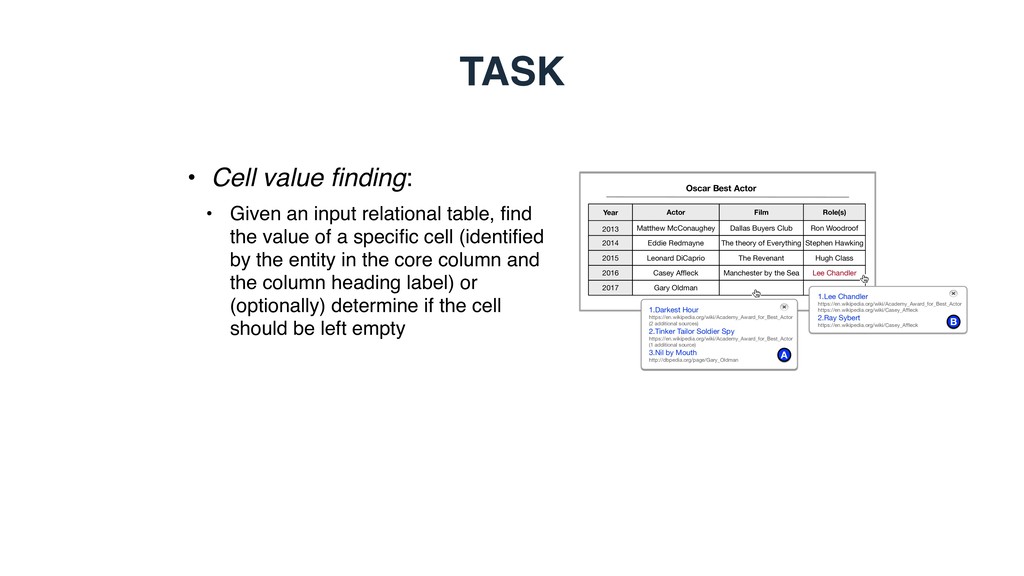
table, find the value of a specific cell (identified by the entity in the core column and the column heading label) or (optionally) determine if the cell should be left empty Oscar Best Actor Year 2013 Actor Film Role(s) 2014 2015 Matthew McConaughey Eddie Redmayne Leonard DiCaprio Dallas Buyers Club The theory of Everything The Revenant Ron Woodroof Stephen Hawking Hugh Class 2016 Casey Affleck Manchester by the Sea Lee Chandler 2017 Gary Oldman 1.Darkest Hour https://en.wikipedia.org/wiki/Academy_Award_for_Best_Actor (2 additional sources) 2.Tinker Tailor Soldier Spy https://en.wikipedia.org/wiki/Academy_Award_for_Best_Actor (1 additional source) 3.Nil by Mouth http://dbpedia.org/page/Gary_Oldman A 1.Lee Chandler https://en.wikipedia.org/wiki/Academy_Award_for_Best_Actor https://en.wikipedia.org/wiki/Casey_Affleck 2.Ray Sybert https://en.wikipedia.org/wiki/Casey_Affleck B
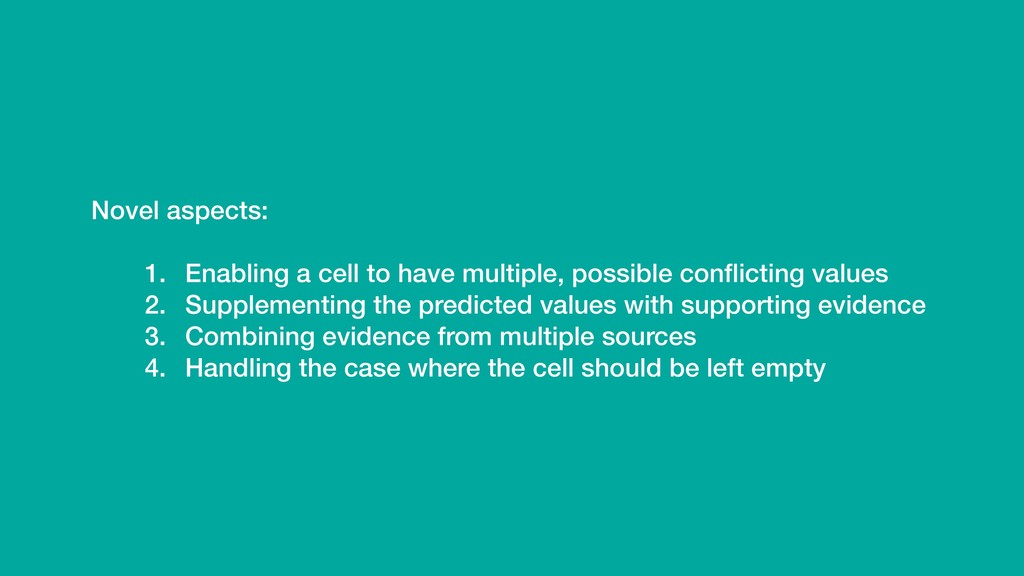
conflicting values 2. Supplementing the predicted values with supporting evidence 3. Combining evidence from multiple sources 4. Handling the case where the cell should be left empty
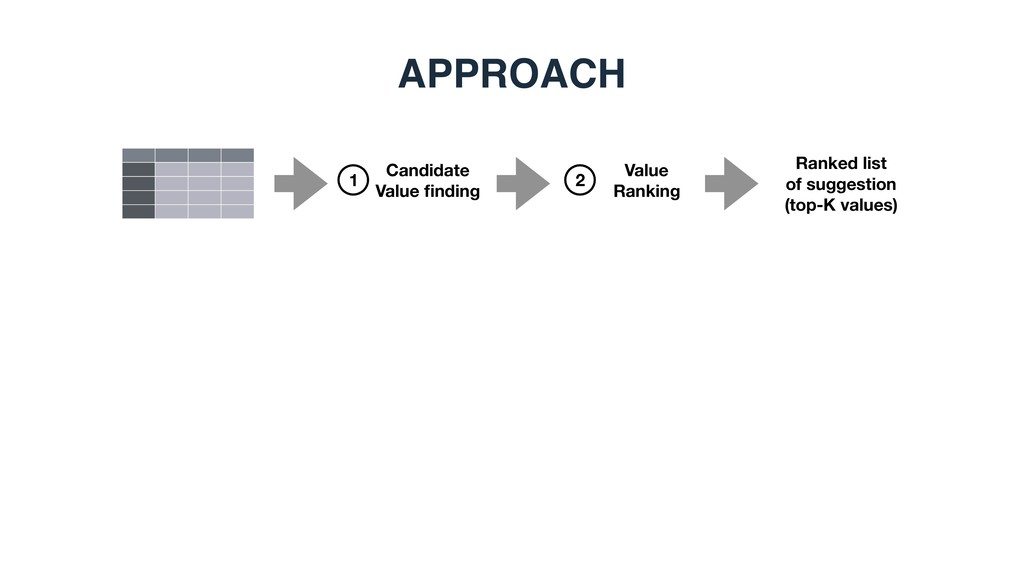
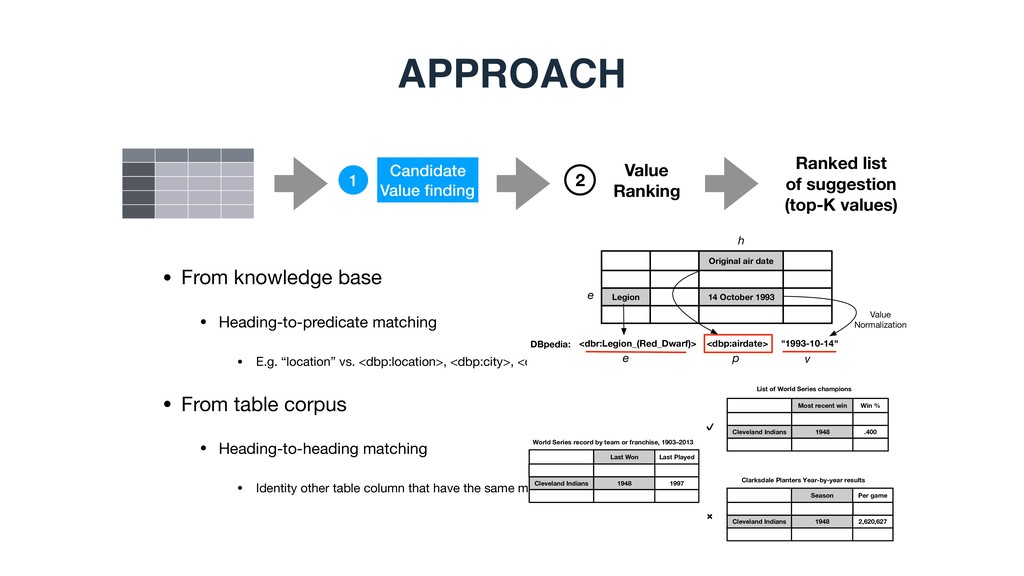
suggestion (top-K values) 1 2 • From knowledge base • Heading-to-predicate matching • E.g. “location” vs. <dbp:location>, <dbp:city>, <dbp:country> • From table corpus • Heading-to-heading matching • Identity other table column that have the same meaning, e.g., nation vs. country Cleveland Indians Last Won 1948 Last Played 1997 World Series record by team or franchise, 1903–2013 Cleveland Indians Most recent win 1948 Win % .400 Cleveland Indians Season 1948 Per game 2,620,627 List of World Series champions Clarksdale Planters Year-by-year results ✔ ✖ Legion Original air date 14 October 1993 <dbr:Legion_(Red_Dwarf)> <dbp:airdate> "1993-10-14" Value Normalization DBpedia: e h e p v
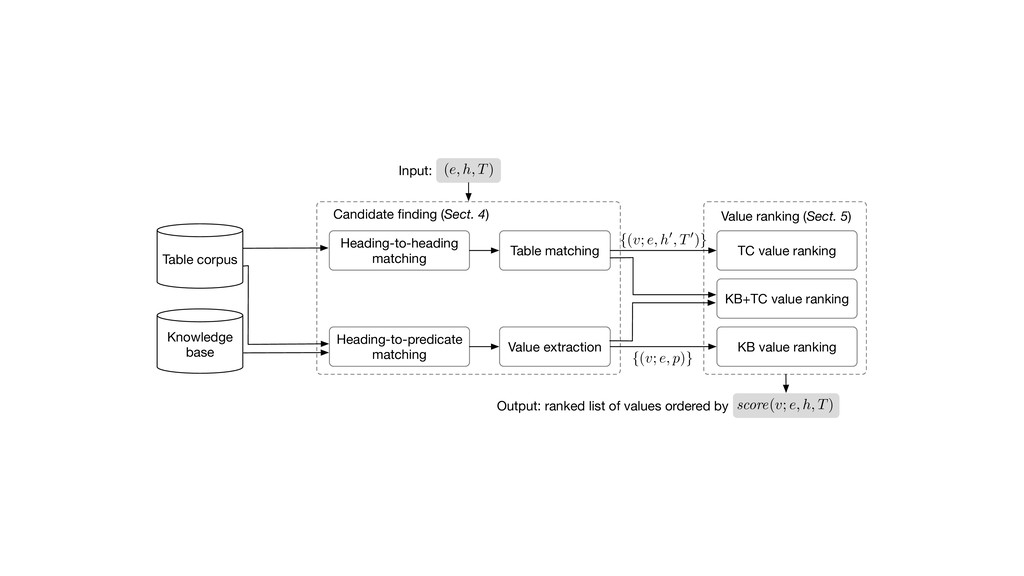
(Sect. 4) Heading-to-heading matching Heading-to-predicate matching TC value ranking KB value ranking Value ranking (Sect. 5) {(v; e, h0, T0)} {(v; e, p)} KB+TC value ranking (e, h, T) score(v; e, h, T) Input: Output: ranked list of values ordered by
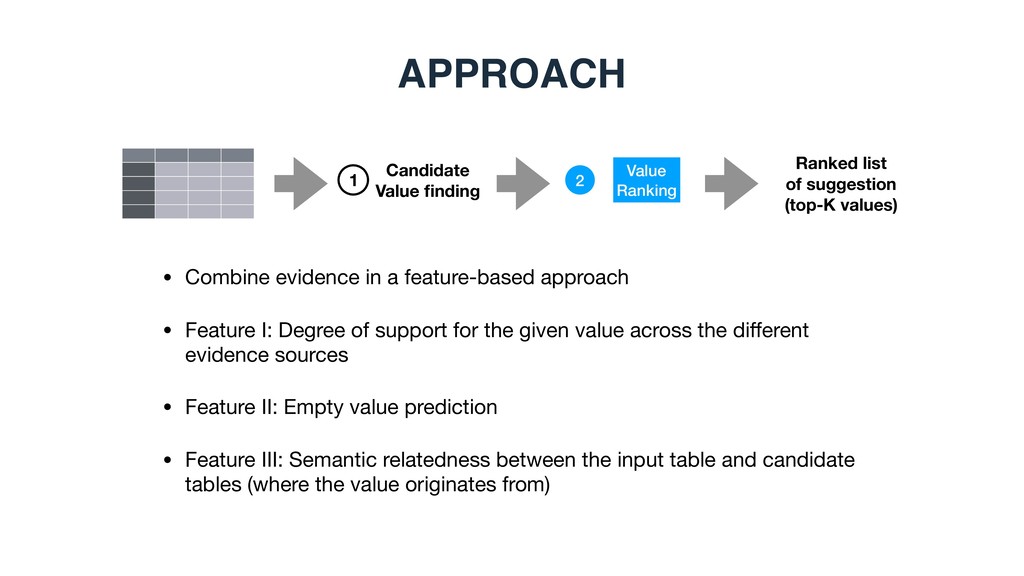
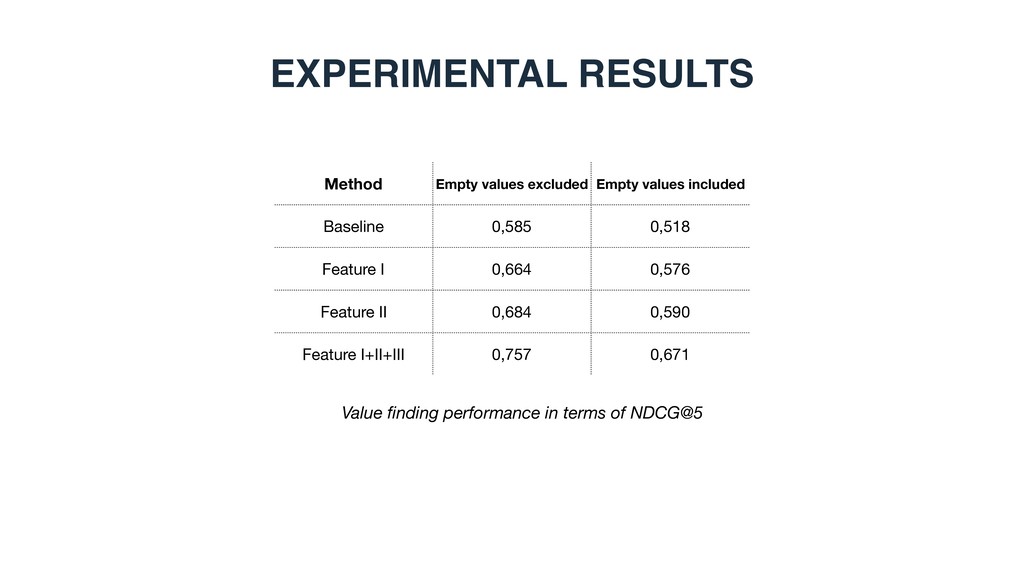
(top-K values) 1 1 2 • Combine evidence in a feature-based approach • Feature I: Degree of support for the given value across the different evidence sources • Feature II: Empty value prediction • Feature III: Semantic relatedness between the input table and candidate tables (where the value originates from)
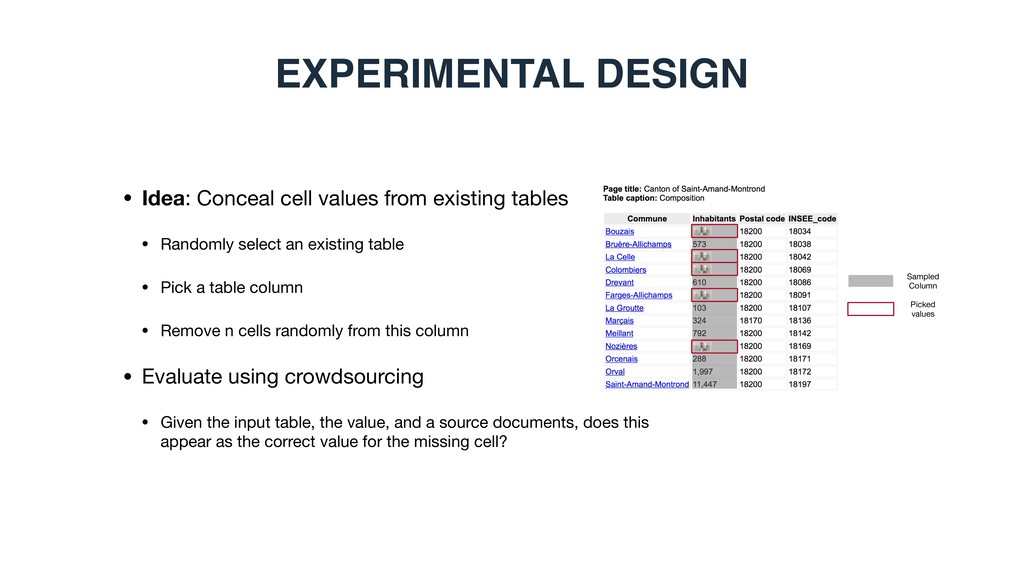
select an existing table • Pick a table column • Remove n cells randomly from this column • Evaluate using crowdsourcing • Given the input table, the value, and a source documents, does this appear as the correct value for the missing cell? EXPERIMENTAL DESIGN Sampled Column Picked values
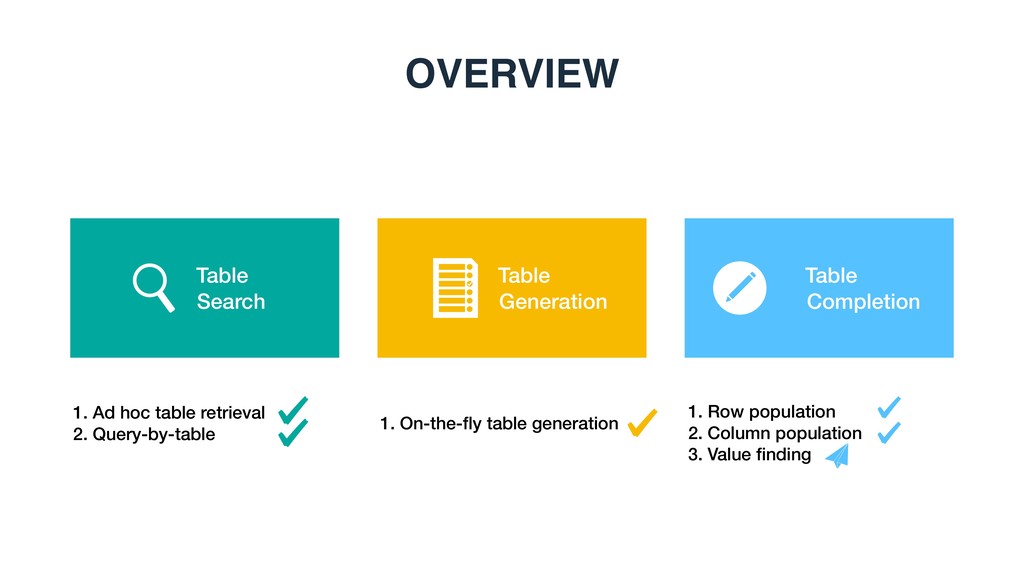
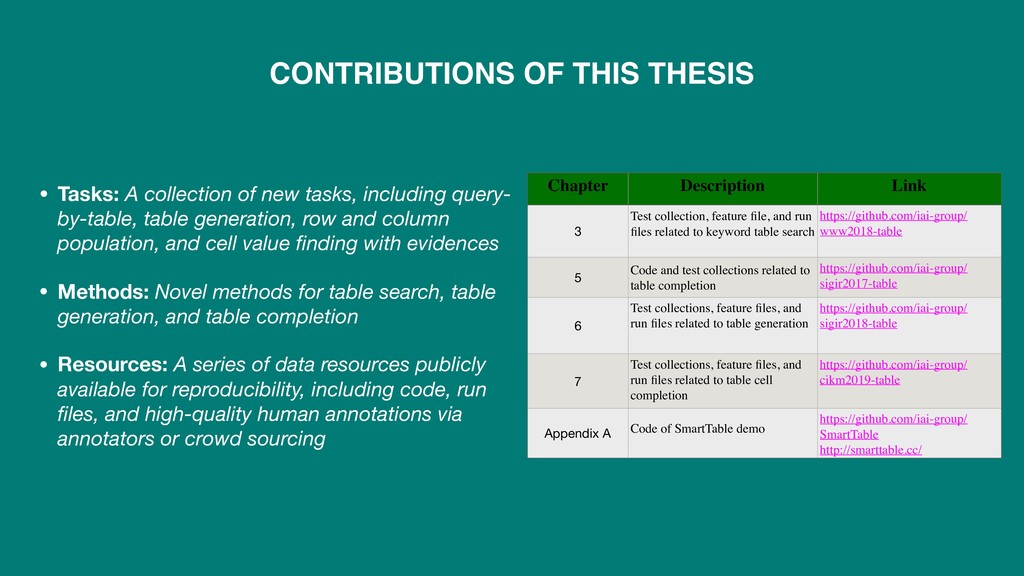
table generation, row and column population, and cell value finding with evidences • Methods: Novel methods for table search, table generation, and table completion • Resources: A series of data resources publicly available for reproducibility, including code, run files, and high-quality human annotations via annotators or crowd sourcing CONTRIBUTIONS OF THIS THESIS Chapter Description Link 3 Test collection, feature file, and run files related to keyword table search https://github.com/iai-group/ www2018-table 5 Code and test collections related to table completion https://github.com/iai-group/ sigir2017-table 6 Test collections, feature files, and run files related to table generation https://github.com/iai-group/ sigir2018-table 7 Test collections, feature files, and run files related to table cell completion https://github.com/iai-group/ cikm2019-table Appendix A Code of SmartTable demo https://github.com/iai-group/ SmartTable http://smarttable.cc/
![2. MEASURING ELEMENT-LEVEL SIMILARITY [ ... ] Cy x2 ˜](https://files.speakerdeck.com/presentations/ca41ccf5fe4444bf9adefe251725a59b/slide_43.jpg)