coding, hell yeah!!! JDD, 4Developers and one more conference (still under development) where I serve as a dictator for life JVM, bytecode, parsers, graphs and other cool things (like ponies) owner at Symentis trainings, former chief architect, development manager, head of development, backend developer and performance guy
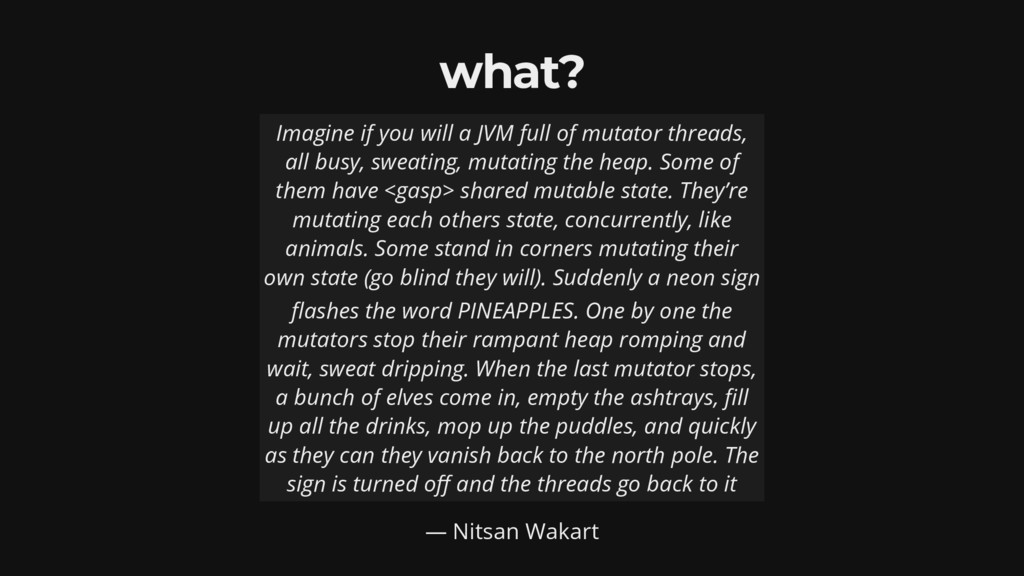
full of mutator threads, all busy, sweating, mutating the heap. Some of them have <gasp> shared mutable state. They’re mutating each others state, concurrently, like animals. Some stand in corners mutating their own state (go blind they will). Suddenly a neon sign ashes the word PINEAPPLES. One by one the mutators stop their rampant heap romping and wait, sweat dripping. When the last mutator stops, a bunch of elves come in, empty the ashtrays, ll up all the drinks, mop up the puddles, and quickly as they can they vanish back to the north pole. The sign is turned o and the threads go back to it
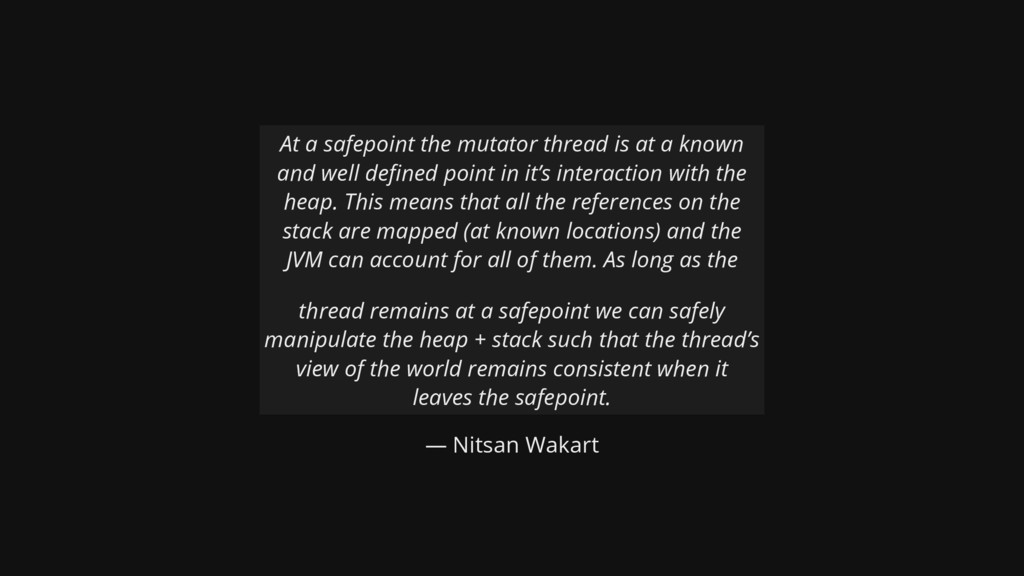
at a known and well de ned point in it’s interaction with the heap. This means that all the references on the stack are mapped (at known locations) and the JVM can account for all of them. As long as the thread remains at a safepoint we can safely manipulate the heap + stack such that the thread’s view of the world remains consistent when it leaves the safepoint.
(TLAB) is a region of Eden that is used for allocation by a single thread. It enables a thread to do object allocation using thread local top and limit pointers, which is faster than doing an atomic operation on a top pointer that is shared across threads. A thread acquires a TLAB at it’s rst object allocation after a GC scavenge. The size of the TLAB is computed via a somewhat complex process discribed below. The TLAB is released when it is full (or nearly so), or the next GC scavenge occurs. TLABs are allocated only in Eden, never from From-Space or the OldGen.
a tool for collecting diagnostic and pro ling data about a running Java application. It is integrated into the Java Virtual Machine (JVM) and causes almost no performance overhead, so it can be used even in heavily loaded production environments.
avoiding an inherent bias towards places that have safepoints. It pro les applications with signi cantly lower overhead than traditional pro ling techniques, making it suitable for use in production.
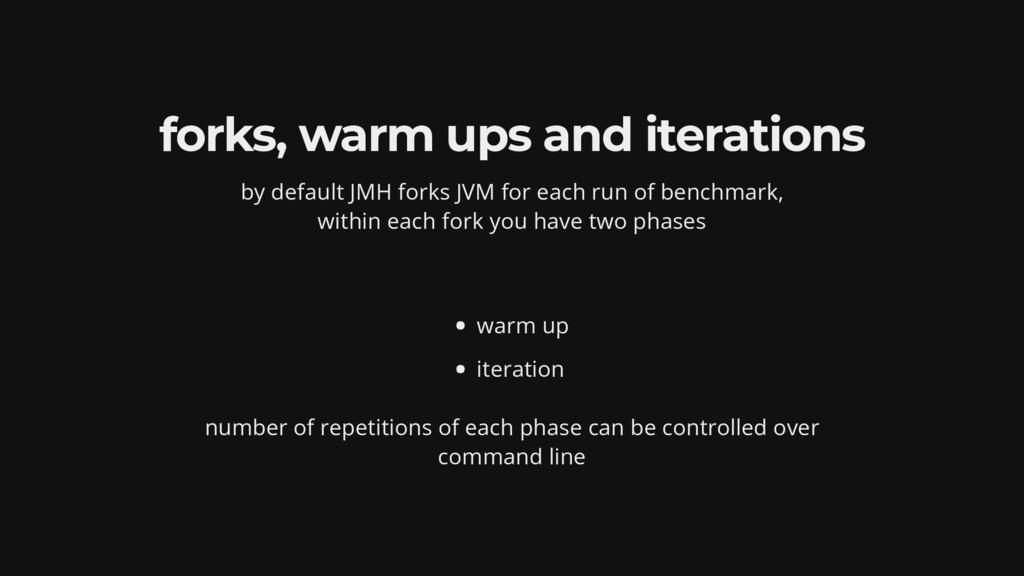
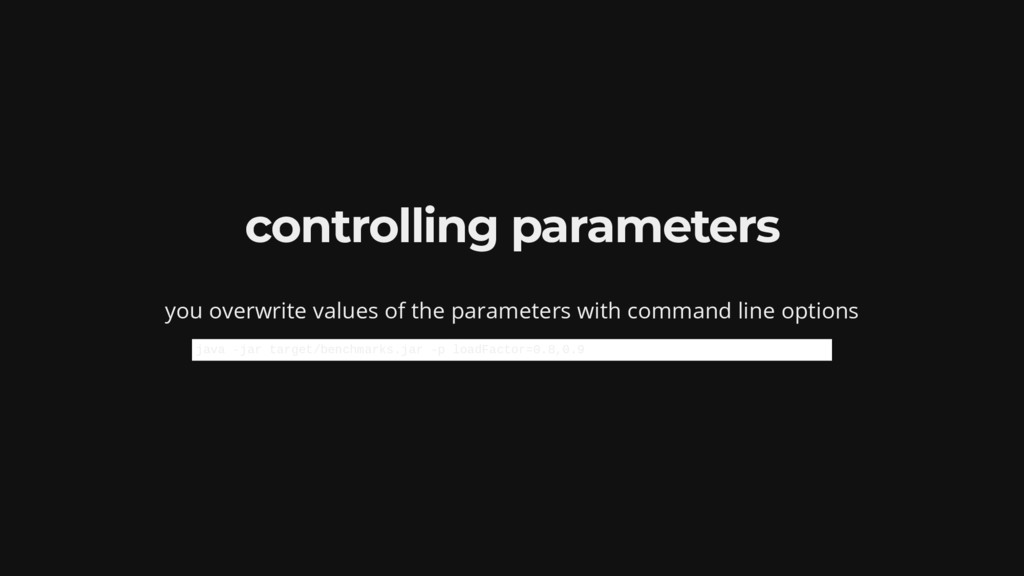
for each run of benchmark, within each fork you have two phases warm up iteration number of repetitions of each phase can be controlled over command line
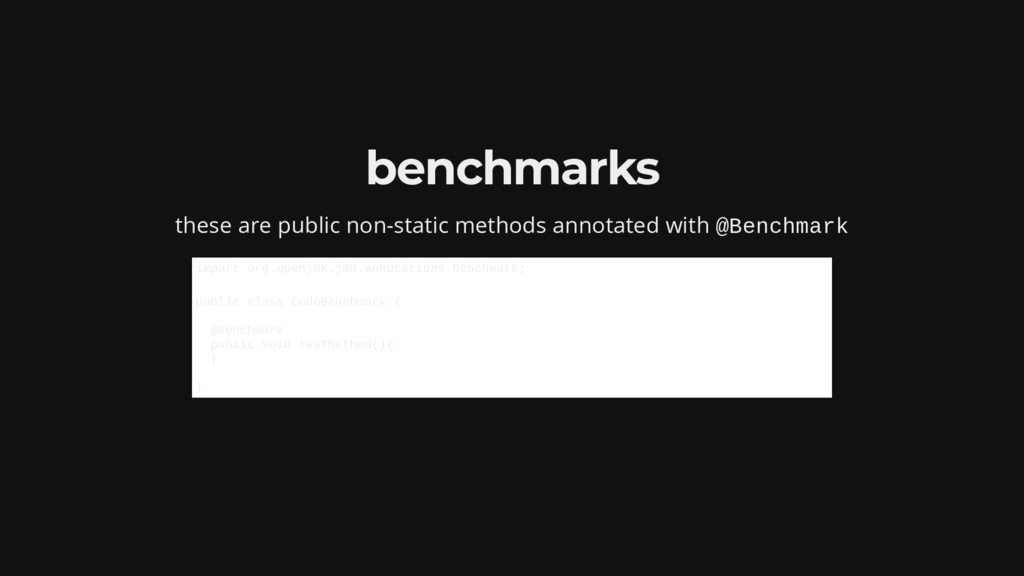
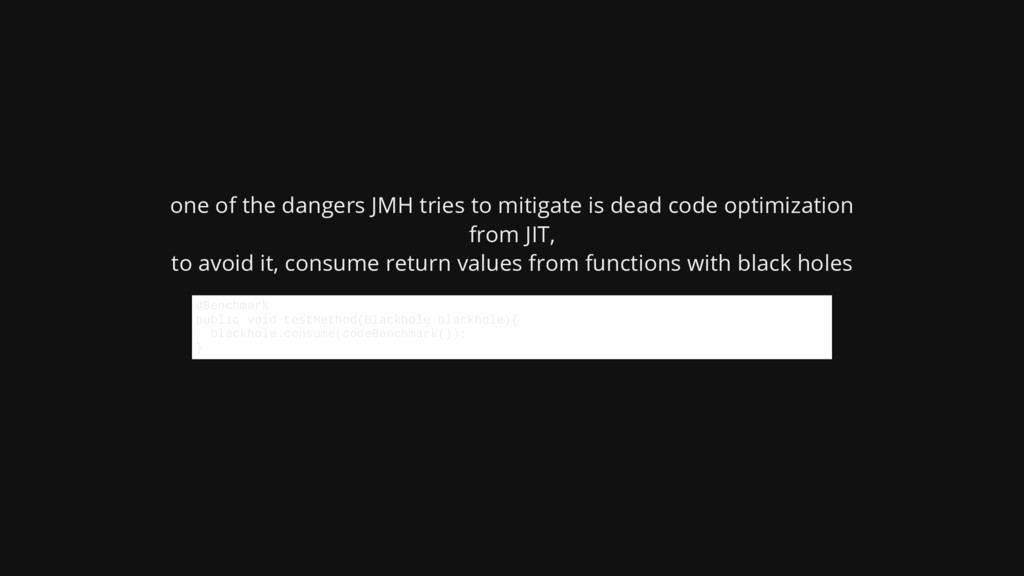
code optimization from JIT, to avoid it, consume return values from functions with black holes @Benchmark public void testMethod(Blackhole blackhole){ blackhole.consume(codeBenchmark()); }
![jmap -heap [pid] # to print heap usage jmap -histo](https://files.speakerdeck.com/presentations/c788e7bdf5b9467c8faadbd25a0add16/slide_10.jpg)
![jstat samples running JVM for selected metrics jstat -gc [pid]](https://files.speakerdeck.com/presentations/c788e7bdf5b9467c8faadbd25a0add16/slide_11.jpg)
![let’s play with it jcmd [pid] help](https://files.speakerdeck.com/presentations/c788e7bdf5b9467c8faadbd25a0add16/slide_14.jpg)
![jstat -gc [pid] [interval] or](https://files.speakerdeck.com/presentations/c788e7bdf5b9467c8faadbd25a0add16/slide_18.jpg)
![java -XX:NativeMemoryTracking=[o |summary|detail] jcmd [pid] VM.native_memory summary](https://files.speakerdeck.com/presentations/c788e7bdf5b9467c8faadbd25a0add16/slide_32.jpg)
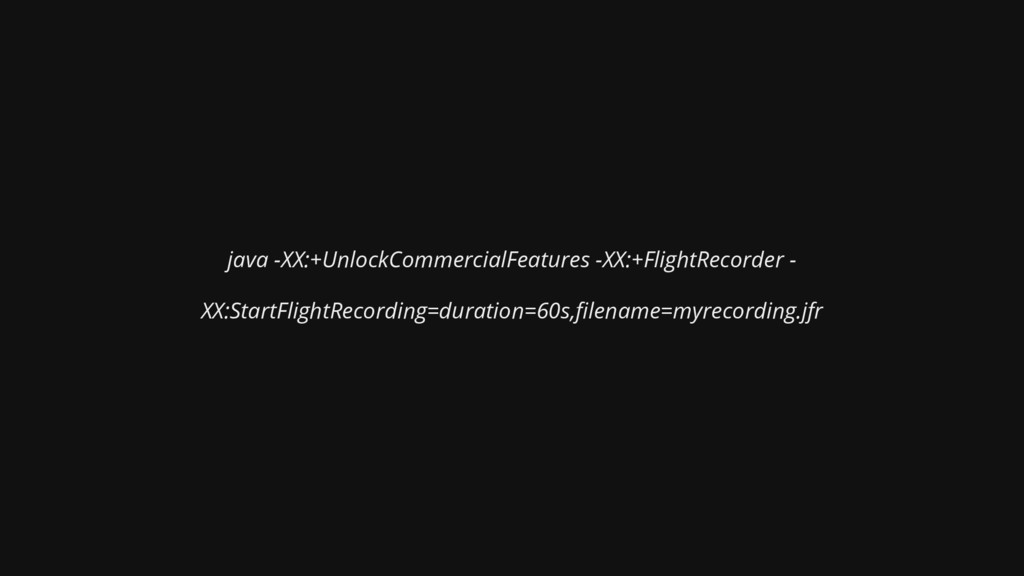
![java -XX:+UnlockCommercialFeatures -XX:+FlightRecorder jcmd [pid] JFR.start name=recording jcmd [pid] JFR.start](https://files.speakerdeck.com/presentations/c788e7bdf5b9467c8faadbd25a0add16/slide_39.jpg)
![sysstat pidstat -t -d -p [pid] 1 # IO usage](https://files.speakerdeck.com/presentations/c788e7bdf5b9467c8faadbd25a0add16/slide_42.jpg)
![sysdig sysdig prod.pid=[pid] -w [pid].scap # record events csysdig -r](https://files.speakerdeck.com/presentations/c788e7bdf5b9467c8faadbd25a0add16/slide_45.jpg)
![perf perf record -p [pid] -o [pid].perf # record events](https://files.speakerdeck.com/presentations/c788e7bdf5b9467c8faadbd25a0add16/slide_46.jpg)