Upgrade to Pro — share decks privately, control downloads, hide ads and more …

July Meetup 2013: MongoDB profiler and aggregation

July Meetup 2013: MongoDB profiler and aggregation

MongoDB Austin MUG presentation

Avatar for Kenny Gorman

Kenny Gorman

July 24, 2013
Tweet

More Decks by Kenny Gorman

Other Decks in Programming

Transcript

  1. MongoDB profiler and aggregation framework MongoDB Meetup July 2013 Kenny

    Gorman Founder, ObjectRocket @objectrocket @kennygorman
  2. Overview 1. Basic profiler use 2. Advanced profiler with aggregation

    framework 3. Response time analysis with profiler and aggregation framework. 4. Profile and time-series data
  3. What is the profiler? Your most important performance diagnosis tool

    • Captures metadata about what operations ran on the system • Saves data into capped collection • Designed for basic performance analysis • In the spirit of < instrument everything > • Very interesting advanced analysis possible ◦ Aggregation ◦ Historical/Time-series analysis ◦ Operational monitoring
  4. Using the profiler • Turn it on, leave it. •

    Development cycle • Production debugging • Overall performance management • Find candidates, pull out query, use explain() ◦ Rinse and Repeat while true: bad_statements = find_candidates() for statement in bad_statements: statement.explain()
  5. Using the profiler; Example $> db.setProfilingLevel(2); { "was" : 0,

    "slowms" : 100, "ok" : 1 } $> db.testme.save({"name":"Kenny"}); $> db.system.profile.find().pretty() { "ts" : ISODate("2013-02-11T18:45:06.857Z"), "op" : "insert", "ns" : "test.testme", "keyUpdates" : 0, "numYield" : 0, "lockStats" : {..}, "millis" : 0, "client" : "127.0.0.1", "user" : "" } example: https://gist.github.com/kgorman/4756589
  6. Annotated { "ts" : ISODate("2012-09-14T16:34:00.010Z"), // date it occurred "op"

    : "query", // the operation type "ns" : "game.players", // the db and collection "query" : { "total_games" : 1000 }, // query document "ntoreturn" : 0, // # docs returned with limit() "ntoskip" : 0, // # of docs to skip() "nscanned" : 959967, // number of docs scanned "keyUpdates" : 0, // updates of secondary indexes "numYield" : 1, // # of times yields took place "lockStats" : { ... }, // subdoc of lock stats "nreturned" : 0, // # docs actually returned "responseLength" : 20, // size of doc "millis" : 859, // how long it took "client" : "127.0.0.1", // client asked for it "user" : "" // the user asking for it } example: https://gist.github.com/kgorman/4957922
  7. • fastMod ◦ Good! Fastest possible update. In-place atomic operator

    ($inc,$set) • nretunred vs nscanned ◦ If nscanned != nreturned, you may have opportunity to tune. Indexing. • key updates ◦ Secondary indexes. Minimize them ◦ ~10% reduction in performance for each secondary index • moved & nmoved ◦ Documents grow > padding factor ◦ You can't fix it other than to pad yourself manually ◦ db.collection.stats() shows padding ◦ usePowerOf2Sizes • nreturned; high number of them ◦ cardinality ◦ Just pure I/O What to look for
  8. Profiler Analysis - FCS $>db.system.profile.find({"op":"query","ns":"test.testme"}).pretty(); { "ts" : ISODate("2013-02-11T19:53:16.302Z"), "op"

    : "query", "ns" : "test.testme", "query" : { "name" : 1 }, "ntoreturn" : 0, "ntoskip" : 0, "nscanned" : 32001, // why scanning so many? "keyUpdates" : 0, "numYield" : 0, "lockStats" : {...}, "nreturned" : 1, // just to return 1 "responseLength" : 56, "millis" : 29, // slow! "client" : "127.0.0.1", "user" : "" }
  9. Profiler Analysis - FCS $> db.testme.find({ "name": 1 }).explain() {

    "cursor" : "BasicCursor", // Basic "isMultiKey" : false, "n" : 1, "nscannedObjects" : 32001, "nscanned" : 32001, "nscannedObjectsAllPlans" : 32001, "nscannedAllPlans" : 32001, "scanAndOrder" : false, "indexOnly" : false, "nYields" : 0, "nChunkSkips" : 0, "millis" : 14, "indexBounds" : { // WTF! }, ... }
  10. Profiler Analysis - FCS $> db.testme.ensureIndex({"name":-1}); $> db.testme.find({"name":1}).explain() { "cursor"

    : "BtreeCursor name_-1", // Btree "isMultiKey" : false, "n" : 1, "nscannedObjects" : 1, "nscanned" : 1, "nscannedObjectsAllPlans" : 1, "nscannedAllPlans" : 1, "scanAndOrder" : false, "indexOnly" : false, "nYields" : 0, "nChunkSkips" : 0, "millis" : 0, "indexBounds" : { "name" : [ [ 1, // w00t! 1 ] ] }, ... }
  11. Profiler Analysis - FCS $>db.system.profile.find({"op":"query","ns":"test.testme"}).pretty(); { "ts" : ISODate("2013-02-11T20:00:52.015Z"), "op"

    : "query", "ns" : "test.testme", "query" : { "name" : 1 }, "ntoreturn" : 0, "ntoskip" : 0, "nscanned" : 1, // w00t! "keyUpdates" : 0, "numYield" : 0, "lockStats" : {...}, "nreturned" : 1, "responseLength" : 56, "millis" : 1, // /me gets a raise "client" : "127.0.0.1", "user" : "" }
  12. Profiler Analysis - helpful queries // last few entries show

    profile // sort by natural order (time in) db.system.profile.find({}).sort({$natural:-1}) // anything > 20ms db.system.profile.find({"millis":{$gt:20}}) // single coll order by response time db.system.profile.find({"ns":"test.foo"}).sort({"millis":-1}) // anything thats moved db.system.profile.find({"moved":true}) // large scans db.system.profile.find({"nscanned":{$gt:10000}}) // anything doing range or full scans db.system.profile.find({"nreturned":{$gt:1}}) example: https://gist.github.com/kgorman/c5774670feb7436f4d69
  13. Going Deeper with Profiler Analytics • In prod environment profiler

    has lots of data • Prioritize tuning opportunities • Prioritize performance issues • Aggregation, summarization required • Enter Aggregation Framework • http://docs.mongodb.org/manual/core/aggregation/
  14. Aggregation Framework - Example > db.system.profile.aggregate( { $group : {

    _id :"$op", count:{$sum:1}, "max response time":{$max:"$millis"}, "avg response time":{$avg:"$millis"} } }); { "result" : [ { "_id" : "command", "count" : 1, "max response time" : 0, "avg response time" : 0 }, { "_id" : "query", "count" : 12, "max response time" : 571, "avg response time" : 5 }, { "_id" : "update", "count" : 842, "max response time" : 111, "avg response time" : 40 }, { "_id" : "insert", "count" : 1633, "max response time" : 2, "avg response time" : 1 } ], "ok" : 1 } // focus on updates first, then queries, then inserts
  15. Aggregation Framework - Example // response time by operation type

    db.system.profile.aggregate( { $group : { _id :"$op", count:{$sum:1}, "max response time":{$max:"$millis"}, "avg response time":{$avg:"$millis"} }}); // slowest by namespace db.system.profile.aggregate( { $group : { _id :"$ns", count:{$sum:1}, "max response time":{$max:"$millis"}, "avg response time":{$avg:"$millis"} }}, {$sort: { "max response time":-1} }); // slowest by client db.system.profile.aggregate( {$group : { _id :"$client", count:{$sum:1}, "max response time":{$max:"$millis"}, "avg response time":{$avg:"$millis"} }}, {$sort: { "max response time":-1} }); // summary moved vs non-moved db.system.profile.aggregate( { $group : { _id :"$moved", count:{$sum:1}, "max response time":{$max:"$millis"}, "avg response time":{$avg:"$millis"} }}); example: https://gist.github.com/kgorman/995a3aa5b35e92e5ab57
  16. • Response time analysis techniques come from Oracle community circa

    2000-2004. • Response time = service time + queue time ( time_to_complete + time_waiting_in_queue ) • Each document in profile collection a couple response time attributes. ◦ millis ◦ timeAcquiring ◦ timeLocked • The only true measure of response time in MongoDB • Aids in prioritization of tuning opportunities. Finding the bang for the buck, or the immediate performance problem. Response time analysis
  17. system.profile.lockStats.timeLockedMicros The time in microseconds the operation held a specific

    lock. For operations that require more than one lock, like those that lock the localdatabase to update the oplog, then this value may be longer than the total length of the operation (i. e. millis.) system.profile.lockStats.timeAcquiringMicros The time in microseconds the operation spent waiting to acquire a specific lock. system.profile.millis The time in milliseconds for the server to perform the operation. This time does not include network time nor time to acquire the lock. Definitions:
  18. Response time analysis $>db.system.profile.aggregate( [ { $project : { "op"

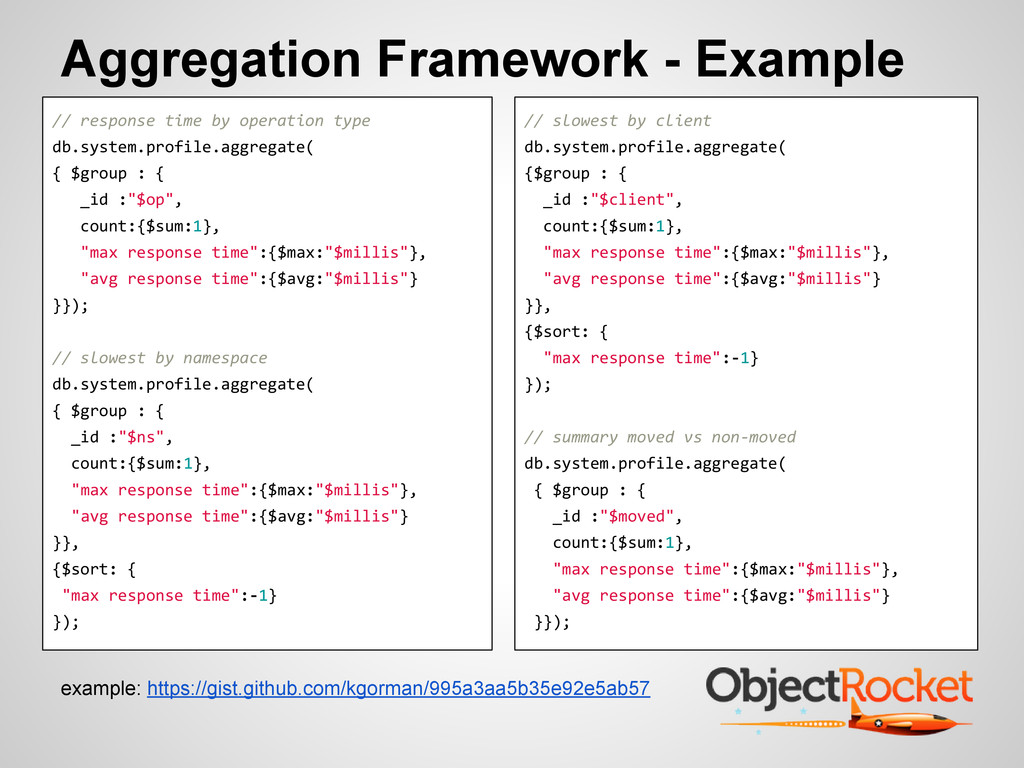
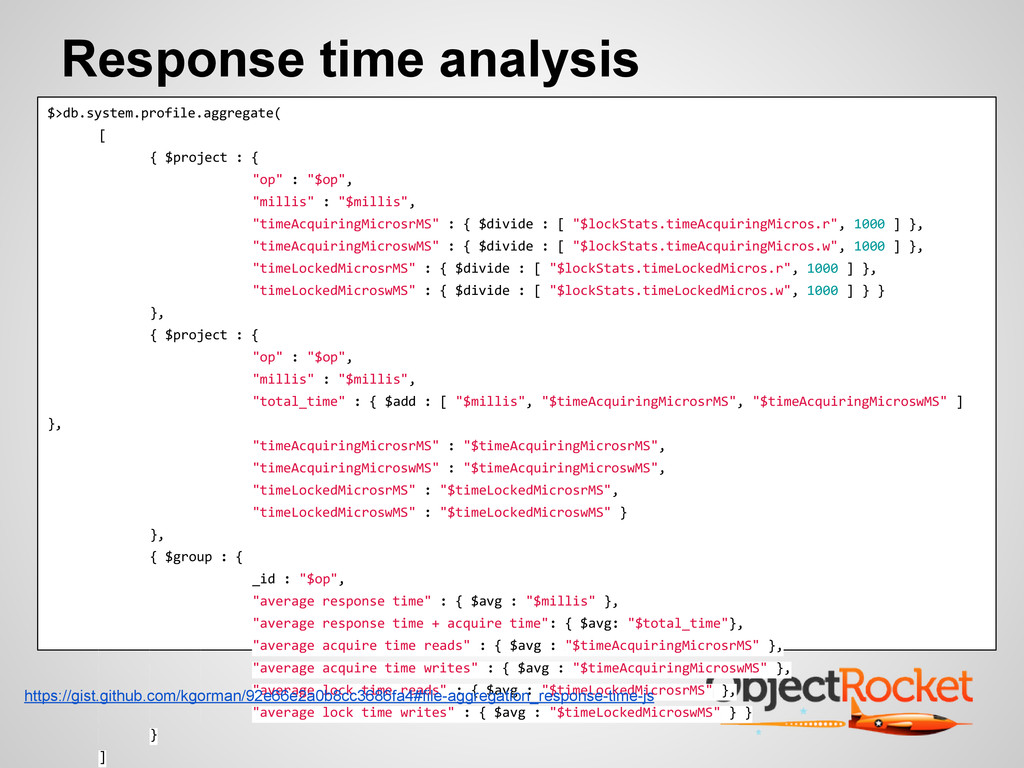
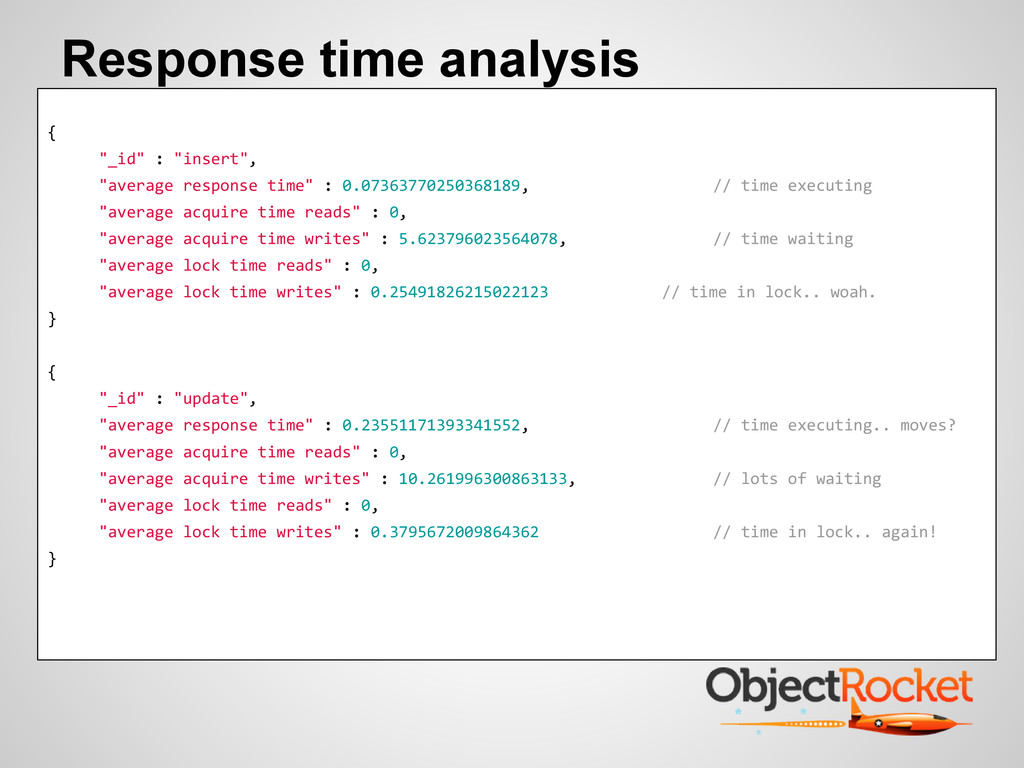
    : "$op", "millis" : "$millis", "timeAcquiringMicrosrMS" : { $divide : [ "$lockStats.timeAcquiringMicros.r", 1000 ] }, "timeAcquiringMicroswMS" : { $divide : [ "$lockStats.timeAcquiringMicros.w", 1000 ] }, "timeLockedMicrosrMS" : { $divide : [ "$lockStats.timeLockedMicros.r", 1000 ] }, "timeLockedMicroswMS" : { $divide : [ "$lockStats.timeLockedMicros.w", 1000 ] } } }, { $project : { "op" : "$op", "millis" : "$millis", "total_time" : { $add : [ "$millis", "$timeAcquiringMicrosrMS", "$timeAcquiringMicroswMS" ] }, "timeAcquiringMicrosrMS" : "$timeAcquiringMicrosrMS", "timeAcquiringMicroswMS" : "$timeAcquiringMicroswMS", "timeLockedMicrosrMS" : "$timeLockedMicrosrMS", "timeLockedMicroswMS" : "$timeLockedMicroswMS" } }, { $group : { _id : "$op", "average response time" : { $avg : "$millis" }, "average response time + acquire time": { $avg: "$total_time"}, "average acquire time reads" : { $avg : "$timeAcquiringMicrosrMS" }, "average acquire time writes" : { $avg : "$timeAcquiringMicroswMS" }, "average lock time reads" : { $avg : "$timeLockedMicrosrMS" }, "average lock time writes" : { $avg : "$timeLockedMicroswMS" } } } ] https://gist.github.com/kgorman/92e66e2a0b8cc3686fa4#file-aggregation_response-time-js
  19. Response time analysis { "_id" : "insert", "average response time"

    : 0.07363770250368189, // time executing "average acquire time reads" : 0, "average acquire time writes" : 5.623796023564078, // time waiting "average lock time reads" : 0, "average lock time writes" : 0.25491826215022123 // time in lock.. woah. } { "_id" : "update", "average response time" : 0.23551171393341552, // time executing.. moves? "average acquire time reads" : 0, "average acquire time writes" : 10.261996300863133, // lots of waiting "average lock time reads" : 0, "average lock time writes" : 0.3795672009864362 // time in lock.. again! }
  20. • Detailed analysis of where the time goes • Deep

    understanding of locking overhead • Exposure to concurrency internals • See potential problem before you are dead Why is this useful?